CROSS / CROSSUSDT Long Setup | Breaker Block ReclaimMARKET ANALYSIS
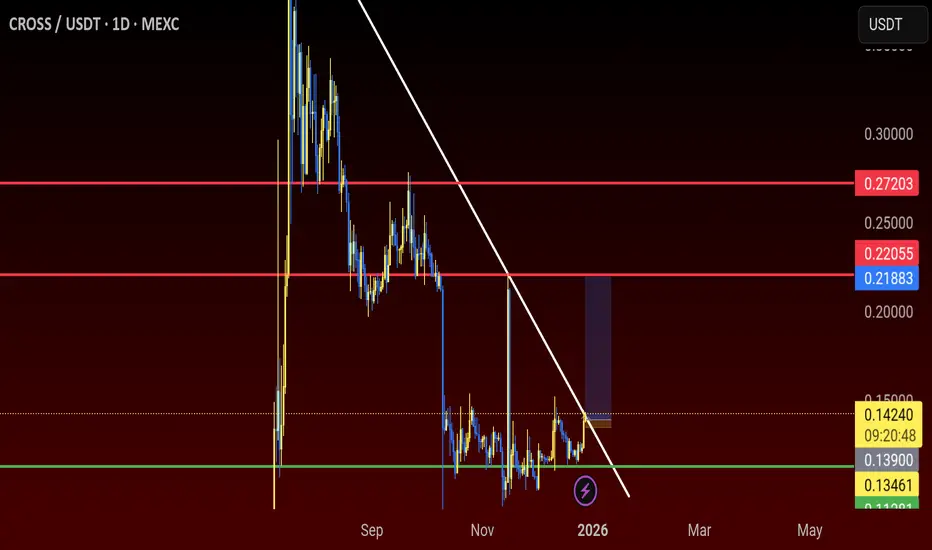
CROSS is currently reacting from a key technical area highlighted on the chart.
As long as the protected support zone remains intact, the bullish market structure remains valid and higher liquidity targets may continue to attract price action.
A breakdown below the invalidation level would weaken the current bullish scenario and require a reassessment of market conditions.
📍 Entry, Stop Loss and Take Profit levels are marked directly on the chart.
━━━━━━━━━━━━━━
⚠️ DISCLAIMER
This publication is provided solely for educational and market observation purposes.
Nothing contained in this analysis should be considered financial advice, investment advice, or a recommendation to buy or sell any financial instrument.
All trading and investment decisions remain solely the responsibility of the individual trader.
Always conduct your own research and apply proper risk management before entering any position.
━━━━━━━━━━━━━━
🎯 PARALOG
▪️Crypto Market Analysis
▪️BTC Futures Signals
▪️Bitcoin & Altcoin Market Analysis
Precision • Momentum • Timing
━━━━━━━━━━━━━━
Exchange: #MEXC Futures
#bitcoin #btc #crypto #futures #technicalanalysis
In-depth trading ideas
CROSS Holding 0.618 Support | Breakout Setup Loading?CRYPTOCAP:CROSS is currently consolidating right above the 0.618 Fibonacci support zone after a strong impulsive move upward. Price is compressing inside a tightening structure, which usually signals a volatility expansion move soon.
The important detail here is that buyers continue defending the 0.1189 support region despite multiple retests. At the same time, higher lows are forming underneath the price, indicating bullish pressure is slowly building.
If bulls manage to break the local resistance trendline, CROSS could quickly push toward higher Fibonacci resistance levels.
Long Entry Zone: 0.1189 - 0.1195
Targets:
• 0.1230
• 0.1271
• 0.1322
Stop Loss: Below 0.1160
A clean breakout from the current compression structure could trigger strong momentum continuation.
NFA | DYOR
crossBullish Scenario (low probability)
For any reversal to occur, the following must happen:
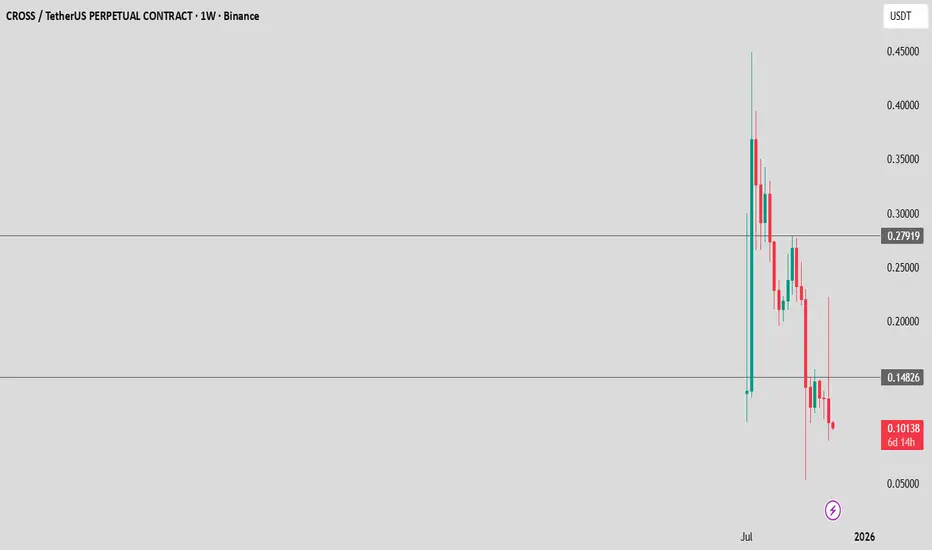
The price must stabilize and confirm a bottom at 0.10 or 0.07–0.08
A weekly close above 0.148 USDT
Only then:
Upside targets:
Target 1 → 0.148 USDT (this level must be reclaimed first)
Target 2 → 0.28 USDT
Target 3 → 0.30–0.35 USDT
Without a breakout above 0.148, there is no bullish confirmation.
Scalp Short – CROSS📉 Scalp Short – CROSS
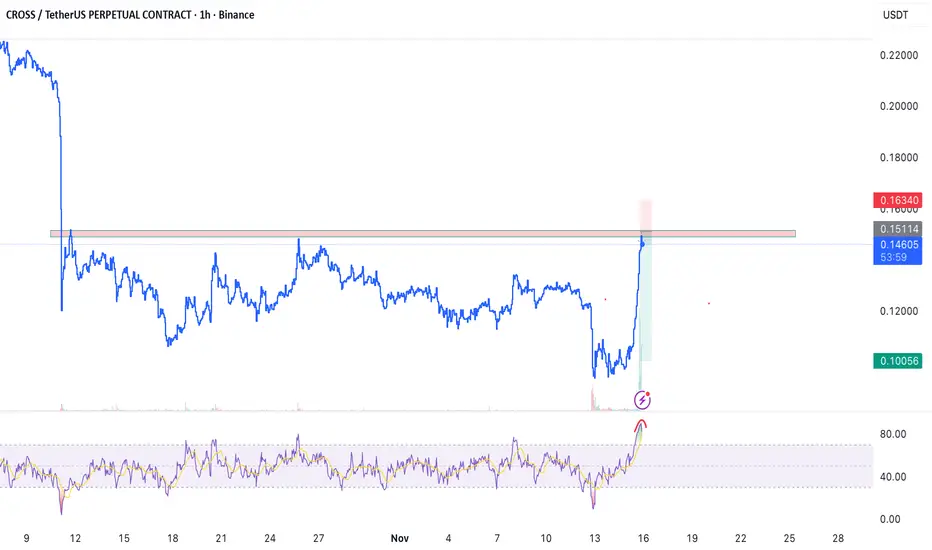
RSI is showing extreme overbought conditions across all lower timeframes, especially on the 1h chart where RSI has reached 90, signaling buyer exhaustion and a high probability of a downside correction. On the 5-minute chart, a strong bearish divergence has formed — a clear indication of short-term reversal potential.
With momentum weakening and divergence confirmed, this setup offers a high RR short opportunity to capture the expected correction.
🎯 Trade Setup:
TP: 0.10056
SL: 0.1634
RR: 1 : 4.13
Concise, sharp, leveraging momentum exhaustion and price structure for a clean short entry.
Cross / USDT : Near to breakout..Keep a close watchCROSSUSDT is testing a descending trendline that has been acting as resistance since late July. Price is now approaching this level again after several rejections.
If price breaks and holds above 0.315 with good volume, the next target could be around 0.345 to 0.35, which is about an 11% move from current price.
Key points:
Timeframe: 1 hour
Setup: Descending trendline breakout
Entry: Wait for breakout and retest confirmation above 0.315
Target: 0.345 area
Stop loss: Below breakout retest zone around 0.308
Risk management is important. Wait for confirmation before entering.
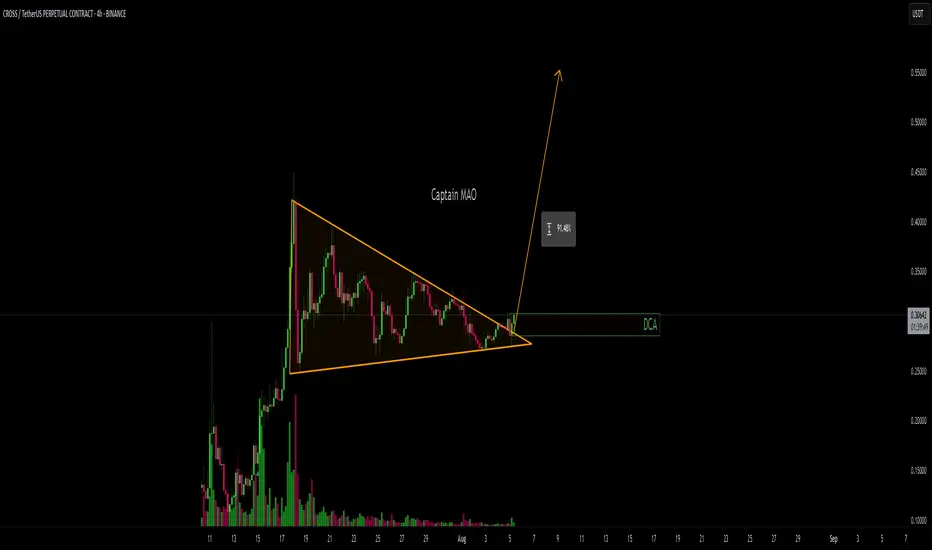
Cross/USDT - Higher !!From the initial buy setup, CROSS delivered an impressive +200% rally, confirming strong bullish interest. Over the past 20 days, price action formed a clean symmetrical triangle, signaling a healthy consolidation phase after the explosive move.
Now, breakout and successful retest of the pattern have been confirmed, indicating that momentum is shifting back in favor of the bulls. With structure and volume aligning, CROSS looks primed for another leg higher—potentially targeting +100% upside from the current level.
CROSS price prediction in the next weekHere’s the live price chart for CROSS (Cross Protocol):
📊 Short-Term Price Outlook (Next 7 Days)
🔍 Current Price & Market Snapshot
Current price: approximately $0.295–$0.297 USD. CROSS has seen a 3–6% rise over the past 24 hours and a ~13% drop over the past week .
Circulating supply: ~350 million; Market cap: ~$102 million .
📈 Technical & Algorithmic Forecasts
TradersUnion forecasts a 7‑day price of around $0.2523, implying a potential –14% move from today .
DigitalCoinPrice, using a simple annual growth model (~5%), projects a modest increase to $0.29334 by August 11, 2025 (i.e., effectively flat to mildly up) .
BeInCrypto reports that the weekly MACD in the 1-week timeframe turned bearish, with negative momentum persisting over ~50 periods .
CoinCodex estimates a range between $0.2146 and $0.2985 for August—with a conservative mid-month price around $0.2368 .
---
📉 Probable Price Ranges
Taking into account the above forecasts:
Scenario Estimated 7‑Day Range (USD)
Bearish (TradersUnion) $0.252
Neutral / Slightly Bearish **$0.236 – $0.253**
Mildly Bullish (annual model) **$0.291 – $0.293**
---
🧭 Summary & Outlook
Short‑term momentum is weak, with bearish indicators (e.g., MACD) pointing down, and several forecasts expecting a ~10–15% drop .
However, more stable growth‑based estimates keep the price near today’s levels, suggesting flat to mild upside if trend reversal occurs .
In essence, most algorithmic predictions suggest a slight decline, but there’s a path to stability or modest gain if upward momentum resumes.
---
🎯 Final Estimate for Next Week
Given current momentum and forecasts:
Expected trading range: $0.236 to $0.293 USD
Most likely outcome: a price near $0.25–$0.26, assuming bearish momentum continues.
Upside case: price holding above $0.29 if market sentiment improves.
---
⚠️ Key Risks to Watch
Bearish technical setups (e.g. MACD) suggest continuing downside pressure.
Market sentiment, exchange listings, or key updates could trigger sharp upward or downward moves.
Crypto markets are volatile—these are scenario based forecasts, not 💯 guarantees.
CROSS/USDTCROSS/USDT looks bullish after a clean breakout above the key resistance zone at $0.15. This level acted as a strong ceiling in recent sessions, and its breakout signals potential continuation. The price action is now poised to fill the inefficiency wick all the way to the $0.30 zone, offering a potential 2x move from the breakout level.