CRV: local squeeze with $0.2525 destinationThe Macro Picture ๐บ๏ธ
CRV unwound from the $0.2929 macro ceiling into a summer range and now sits at $0.2103, holding above the $0.2010 local low. Price is coiling in the middle of the range with the floor intact โ a base rebuilding, not a breakdown.
The Setup โ๏ธ
The Range Floor ๐ข
$0.2010 (Local Low) is the demand shelf, with $0.1696 (Macro Support) as the deeper backstop. Both have held, and that's the base this range pivots on.
The Decision Point ๐ด
$0.2299 (Local High) is the gate. A daily close above it flips the local structure bullish and opens the path to the $0.2525 measured-move target.
The Roadmap ๐ฃ๏ธ
Hold above $0.2010 โ break $0.2299 โ run toward $0.2525. Invalidation is a clean daily close below $0.1696 โ that breaks the range.
This is a GRID Range Play: a defined band to rotate, buying the lower half and scaling out into the breakout.
#CRV #Curve #crypto #trading #TA #3Commas #GRID
In-depth trading ideas
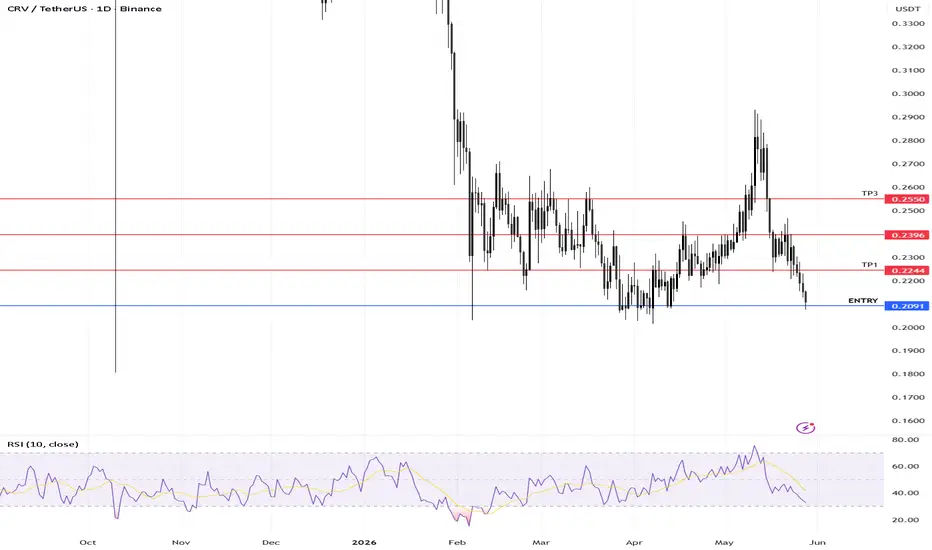
๏ปฟCRV Tests Major Descending Trendline โ Bearish Rejection SetupCRV is testing a multi-month descending trendline after a prolonged consolidation phase.
If the breakout attempt fails, price could pull back toward the $0.2032 support area.
Trading Levels
Direction: Short
Entry: $0.215
Take Profit 1: $0.200
Take Profit 2: $0.193
Stop Loss: $0.222
The setup remains valid while CRV stays below the trendline resistance.
CRVUSDT - Descending TrendLine, Breakout or fakeout?๐ Technical Analysis
๐ต Coin: HOSE:CRV #CRV
โณ Time Frame: 2D
๐ Pattern: Descending TrendLine (Major Resistance)
---
๐ Chart Overview
๐ธ Primary Trend Remains Bearish
Since reaching its peak around $1.16, CRV has consistently formed Lower Highs and Lower Lows, confirming that the medium-term downtrend is still intact.
The Descending TrendLine has repeatedly acted as a strong dynamic resistance, rejecting every significant recovery attempt.
๐ธ Price Is Testing a Key Dynamic Resistance
CRV is currently trading just below the Descending TrendLine, making this a crucial area that could determine the next major market direction.
The more frequently a resistance level is tested, the greater the probability of a breakoutโprovided it is confirmed by strong volume and a valid candle close.
๐ธ Momentum Is Gradually Improving
Although the overall trend remains bearish, selling pressure appears to be weakening compared to previous declines.
The current consolidation may serve as a foundation for a significant directional move.
---
๐ข Bullish Scenario (Breakout)
โ
If CRV successfully breaks and closes above the Descending TrendLine, it could signal the beginning of a bullish trend reversal in the short term.
๐ฏ Potential upside targets:
๐ฏ $0.2570
๐ฏ $0.2750
๐ฏ $0.2950
๐ฏ $0.3360
๐ฏ $0.4280 (Major Resistance)
๐ A breakout will have stronger confirmation if accompanied by:
๐ฅ Increasing trading volume.
๐ A strong bullish breakout candle with a solid body.
โ
A successful retest where the former resistance turns into new support.
---
๐ด Bearish Scenario (Rejection)
โ ๏ธ If price gets rejected once again by the Descending TrendLine, sellers are likely to remain in control.
๐ Possible downside scenarios:
Price could revisit the $0.19 support area.
If this support fails, the previous low around $0.1700 may be retested.
As long as price remains below the trendline, the overall market bias continues to favor the bears.
---
๐ Pattern Explanation โ Descending TrendLine
๐ A Descending TrendLine is a downward-sloping resistance line connecting a series of Lower Highs.
Key characteristics:
๐น Indicates that sellers continue to dominate the market.
๐น Every upward move tends to be rejected near the trendline.
๐น The longer price compresses beneath the trendline without making significant new lows, the greater the probability of a breakout.
๐น A confirmed breakout often marks the early stage of a momentum shift from bearish to bullish.
---
โ ๏ธ Conclusion
๐ CRV is currently trading at a highly critical technical level.
๐ข A confirmed breakout above the Descending TrendLine could open the door for a rally toward the next resistance zones.
๐ด However, another rejection would keep the bearish trend intact and increase the likelihood of a move back toward key support levels.
๐ Watch for price action, candle confirmation, and trading volume, as this area could become the starting point of the next major move.
#CRV #CRVUSDT #CurveDAO #Crypto #Cryptocurrency #Altcoin #TechnicalAnalysis #TradingView #PriceAction #ChartAnalysis #DescendingTrendline #Breakout #Resistance #Support #Bullish #Bearish #CryptoTrading #Binance #MarketAnalysis #TradingSetup
VRV USDT LONG SIGNAL#96 CRV/USDT โ Trade Setup (LONG)
๐ Position Type: LONG
๐ Timeframe: 1H
๐ Market: Futures
๐ฐ Entry Zone:
Market
0.2086
๐ Stop-Loss:
0.2050
๐ฏ Take-Profit Targets:
โข TP1: 0.2215
โข TP2: 0.2278
โข TP3: 0.2369
โข TP4: 0.2456
โ๏ธ Leverage:
5 *10
โซ๏ธ After TP1, move SL to Entry + 0.2%.
โช๏ธ Exit Plan:
โข 40% at TP1
โข 20% at TP2
โข 20% at TP3
ย 20% at. TP4
๐ Risk Management:
Risk only 1โ2% of your capital per trade.
โ ๏ธ Always check and confirm the setup on your chart before entering the trade.
CRV / CRVUSDT Long Setup | Breaker Block ReclaimMARKET ANALYSIS
CRV is currently reacting from a key technical area highlighted on the chart.
As long as the protected support zone remains intact, the bullish market structure remains valid and higher liquidity targets may continue to attract price action.
A breakdown below the invalidation level would weaken the current bullish scenario and require a reassessment of market conditions.
๐ Entry, Stop Loss and Take Profit levels are marked directly on the chart.
โโโโโโโโโโโโโโ
โ ๏ธ DISCLAIMER
This publication is provided solely for educational and market observation purposes.
Nothing contained in this analysis should be considered financial advice, investment advice, or a recommendation to buy or sell any financial instrument.
All trading and investment decisions remain solely the responsibility of the individual trader.
Always conduct your own research and apply proper risk management before entering any position.
โโโโโโโโโโโโโโ
๐ฏ PARALOG
โช๏ธCrypto Market Analysis
โช๏ธBTC Futures Signals
โช๏ธBitcoin & Altcoin Market Analysis
Precision โข Momentum โข Timing
โโโโโโโโโโโโโโ
Exchange: #MEXC Futures
#bitcoin #btc #crypto #futures #technicalanalysis
CRVUSDT 1D#CRV is on the verge of breaking out above a major resistance cluster, consisting of the descending resistance, the Ichimoku cloud, and the daily EMA100.
If the breakout is confirmed, the potential upside targets are:
๐ฏ $0.2643
๐ฏ $0.3137
๐ฏ $0.3537
๐ฏ $0.3936
๐ฏ $0.4504
๐ฏ $0.5228
โ ๏ธ Always remember to use a tight stop-loss and maintain proper risk management.
CRV USDT LONG SIGNAL# 66 CRV./USDT โ Trade Setup (LONG)
๐ Position Type: LONG
๐ Timeframe: 1 H
๐ Market: Futures
๐ฐ Entry Zone:
0.2240
0.2159
๐ Stop-Loss:
0.2090
๐ฏ Take-Profit Targets:
โข TP1:ย 0.2323
โข TP2:ย 0.2408
โข TP3:ย 0.2488
โข TP4:ย 0.2575
TP5:ย
TP6:ย
โ๏ธ Leverage:
5-
โ ๏ธ After reaching TP1, move Stop-Loss to Entry Price.
๐ Risk Management:
Risk only 1โ2% of your capital per trade.
Always confirm the setup on your chart before entry
CRVUSDT - Descending TrendLine, Breakout or Another Rejection?๐ Technical Analysis
๐ต Coin: HOSE:CRV #CRVUSDT
โณ Time Frame: 2D
๐ Pattern: Descending TrendLine
๐ Market Structure: Downtrend with Potential Breakout Attempt
๐ CRVUSDT remains in a medium- to long-term downtrend, characterized by a well-established Descending TrendLine that has acted as a dynamic resistance since the peak in mid-2025.
๐ The price is now approaching this Descending TrendLine once again after forming a Higher Low from the major support area around 0.17 USDT. This suggests increasing buying pressure, but a trend reversal is not yet confirmed until the price successfully breaks above the key resistance.
๐ Volume and breakout candle confirmation will be crucial in determining whether the move is a genuine breakout or simply a Fake Breakout before the downtrend resumes.
---
๐๐ป Pattern: Descending TrendLine
A Descending TrendLine is a downward-sloping resistance line that connects a series of Lower Highs.
โจ Key Characteristics:
๐ Indicates strong seller dominance throughout the downtrend.
๐ The more times the trendline is tested, the higher the probability of a breakout.
๐ A valid breakout is typically accompanied by increasing volume and a candle close above the trendline.
โ ๏ธ Rejection from the trendline often leads to a continuation of the bearish trend.
๐ฏ On this chart, the trendline has been tested multiple times, making the current area one of the most critical decision zones for CRV's next major move.
---
๐ข๐ Bullish Scenario (Breakout)
โ
A bullish confirmation will occur only if the price successfully:
๐ Breaks out and closes above the Descending TrendLine.
If the breakout holds, the next resistance targets are:
๐ฏ Target 1: 0.2570 USDT
๐ฏ Target 2: 0.2750 USDT
๐ฏ Target 3: 0.2950 USDT
๐ If buying momentum continues to strengthen, CRV could extend its rally toward:
๐ 0.3360 USDT
๐ 0.4280 USDT
๐ A successful breakout above the Descending TrendLine could also signal the beginning of a market structure shift from Downtrend โ Recovery โ Bullish Trend.
---
๐ด๐ Bearish Scenario (Rejection)
โ If the price fails to break above the Descending TrendLine and gets rejected:
๐ป Sellers are likely to regain control of the market.
๐ The key support zone to monitor is around:
๐ก๏ธ 0.1900 โ 0.1700 USDT
โ ๏ธ If this support zone breaks down, CRV could continue its downtrend and form a new Lower Low, keeping the overall bearish structure intact.
๐ As long as the price remains below the Descending TrendLine, the bearish bias continues to dominate from a technical perspective.
---
๐๐ Conclusion
๐จ CRVUSDT is currently trading at a major decision point.
๐ The Descending TrendLine will determine the next significant market direction.
๐ข A confirmed breakout above the trendline could open the door for a rally toward 0.2570 โ 0.4280 USDT.
๐ด A rejection from the trendline would increase the probability of another decline toward the 0.1700 USDT support area and potentially create a new Lower Low.
โณ Traders should wait for a confirmed breakout or rejection before making trading decisions, as this area could determine whether CRV continues its bearish trend or begins a meaningful trend reversal.
โ ๏ธ๐ก Always Manage Your Risk, Wait for Confirmation, and Never FOMO!
---
#CRV #CRVUSDT #CurveDAO #Crypto #Cryptocurrency #Altcoin #TechnicalAnalysis #TradingView #ChartAnalysis #PriceAction #DescendingTrendLine #Breakout #Resistance #Support #Bullish #Bearish #Binance #SwingTrading #CryptoTrading #MarketAnalysis #Trendline #TechnicalChart #CryptoSignals #MarketUpdate #TradingSetup
CRV: local squeeze with $0.24 destinationThe Macro Picture ๐บ๏ธ
CRV has spent two months trapped inside a broad $0.17โ$0.265 range, a volatility playground where every push to the edges gets faded back toward the mean. Since the May $0.29 structural peak, the market has settled into a rhythm of sharp flushes and equally sharp recoveries โ the June wick to $0.17 and the immediate snap back to $0.265 tell the story. Price now sits right at the equilibrium line near $0.205, with RSI reclaiming the midline. This is the coiled middle of the range, where the path of least resistance points back toward the upper boundary.
The Setup โ๏ธ
The Buy Area: The $0.18โ$0.20 band has absorbed every sell-off this cycle. Bulls are defending this shelf, and as marked on the chart, price is holding above it with momentum turning back up.
The Ceiling: The $0.22 decision line is the first hurdle. A clean reclaim flips the local structure bullish and opens the door toward the $0.265 macro resistance above.
The Range Play: The zone between $0.18 and $0.22 creates a structural playground for grid-based accumulation โ staggered entries across the range capture the chop while the market decides its next macro leg.
The Roadmap: Primary target sits at $0.24 โ the green roadmap points there as price works up from the equilibrium toward the range top. Invalidation: a clean daily close below $0.17 would invalidate this bullish thesis and signal a structural breakdown out of the range.
More setups in profile.
#CRV #CRYPTO #Curve #DeFi #TechnicalAnalysis
#CRV Possible Scenario Medium-Term: Sideways to Bearish. The asset has been experiencing volatile swings over the last several days, reaching a peak near 0.2170 before undergoing a sharp corrective decline toward the 0.1970 area.
โShort-Term: Bullish Reversal. Price action shows a strong V-shaped bounce from the local bottom established at 0.1970. The current hourly candle is actively trading at 0.2032, attempting to break out of the immediate corrective structure.
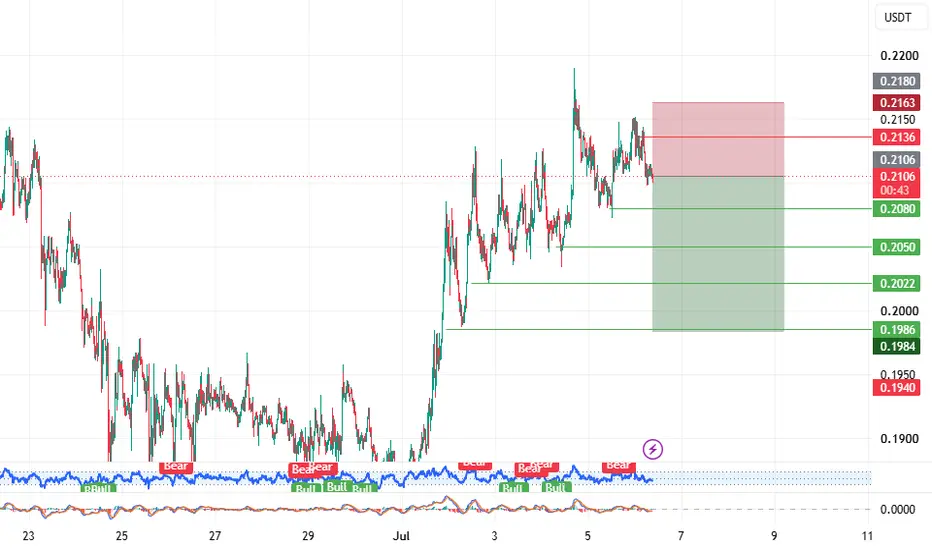
VRC USDT SHORT SIGNAL#18 CRV/USDT โ Trade Setup (SHORT)
๐ Position Type: SHORT
๐ Timeframe: 1 H
๐ Market: Futures
๐ฐ Entry Zone:
0.2106
0.2136
๐ Stop-Loss:
0.2165
๐ฏ Take-Profit Targets:
โข TP1:ย 0.2080
โข TP2:ย 0.2050
โข TP3:ย 0.2022
โข TP4:ย 0.1986
TP5:ย
TP6:ย
โ๏ธ Leverage:
5- 10
โ ๏ธ After reaching TP1, move Stop-Loss to Entry Price.
๐ Risk Management:
Risk only 1โ2% of your capital per trade.
Always confirm the setup on your chart before entry
Curve DAO - CRV price analysisCRYPTOCAP:CRV has printed a new all-time low... Yet the price action tells a more interesting story.
Despite setting a fresh ATL, it feels like someone is still defending OKX:CRVUSDT , preventing it from slipping into a true free fall.
Whether that's accumulation or simply strong support remains to be seen.
But the chart is becoming increasingly interesting.
๐ The road higher won't be easy. The first major challenge is reclaiming $0.29.
๐ If buyers succeed, the next battle begins around $0.40โ0.43 โ a zone that could become the real test of strength.
Only after breaking and holding above that range would the path toward $1 start looking realistic.
Until then, patience is probably the better strategy.
The market still has plenty to prove.
๐ฌ Can #Curve DAO rebuild its position as one of the leading DeFi projects, or are its best days already behind it?
______________
โ Follow us โค๏ธ for daily crypto insights & updates!
๐ Donโt miss out on important market moves
๐ง DYOR | This is not financial advice, just thinking out loud
$CRV is currently at $0.2166 โ and the chart says it's heading..๐ฅ BINANCE:CRVUSDT is sitting at $0.2166 right now โ and the 1D chart is signaling one more leg down before the real move begins. Most traders will chase this price. The ones who wait for $0.1878 will have the better trade.
๐ฐ 24H NEWS SNAPSHOT
Curve Finance launched Llamalend v2 on the Optimism network, allowing Curve LP tokens as collateral and introducing isolated lending markets โ a structural upgrade to the protocol. Despite this bullish fundamental, the daily chart shows price hasn't yet found its floor.
Volume recently ran at 4.49x the 30-day average, suggesting a liquidity flush is still possible before a sustained recovery.
๐ MARKET BIAS: Bullish โ but NOT yet
Waiting for price to complete the pullback into the $0.1878โ$0.1706 demand zone before any long entry is valid.
๐ฏ TRADE LEVELS
๐ Entry Zone: $0.1878 โ $0.1706 (wait for price to arrive)
๐ Stop Loss: $0.1628 (-13.3% from zone bottom | Risk: 1% of portfolio)
๐ฏ TP1: $0.2500 (+33% | 2.5:1 RR)
๐ฏ TP2: $0.2931 (+56% | 4.2:1 RR)
๐ฏ TP3: $0.3128 (+66% | 5:1 RR)
๐ Overall R:R: up to 5:1
๐ง CHART ANALYSIS
On the 1D, BINANCE:CRVUSDT has been in a steady downtrend from the $0.2931 high. The chart projects one more move lower into the demand zone at $0.1878โ$0.1706 โ a zone with a prior structural reaction โ before reversal. Current price at $0.2166 is NOT the entry. The setup only activates when price enters the zone. TP1 at $0.2500 reclaims current price. TP2 at $0.2931 retests the swing high. TP3 at $0.3128 is the macro target. Invalidation: a daily close below $0.1628.
๐ก๏ธ RISK MANAGEMENT
Do NOT enter now at $0.2166 chasing the setup โ that's how traders get caught in the drop. Set a price alert at $0.1900 and wait. When price arrives, confirm with a bullish 1D candle before sizing in. Max 1โ2% portfolio risk.
๐ EDUCATIONAL NUGGET
The biggest mistake retail traders make is entering a trade before it reaches the level. The setup is only valid when price is IN the zone โ not when you think it's "close enough." Patience is a position.
๐ Everyone is watching $0.2166. The trade is at $0.1878 โ set the alert and let price come to you.
๐ฌ Have you got your alert set for BINANCE:CRVUSDT ? Where's your entry? ๐
#CRV #CurveFinance
#CRVUSDT 1h SHORT#CRVUSDT 1h
CRV has formed a CAPS pattern on the daily timeframe as well as on this timeframe, and we are also seeing a SWAP zone.
If price reaches either red zone 1 or 2 and we get confirmation, a short position can be considered with 20x leverage, targeting the blue zones.
Weโre watching it closely.
#CRV
HOSE:CRV
CRVUSDT โ Descending Trendline Breakout, Major Reversal?On the CRVUSDT 2D timeframe chart, the price remains in a medium-to-long-term downtrend, confirmed by the formation of a Descending Trendline ๐ป that has been suppressing price action since the previous peak.
Currently, the price is testing this trendline after successfully bouncing from the low zone around $0.17 ๐ฏ, forming a strong bullish reaction. If buyers can push the price above the trendline and maintain the breakout, the probability of a trend reversal ๐ will increase significantly.
โโโโโโโโโโโโโโโโโโโโ
๐ Pattern Formation: Descending Trendline ๐ป
The primary pattern visible on this chart is a Descending Trendline Resistance.
๐ Pattern Characteristics:
๐น A series of Lower Highs forming a downward-sloping resistance line.
๐น Selling pressure has dominated the market for several months.
๐น The price is now approaching a critical area that could determine the next major trend direction.
๐น A valid breakout above the trendline is often considered an early signal of a market structure shift from bearish to bullish.
โ ๏ธ As long as this trendline remains unbroken, the overall market structure can still be considered bearish.
โโโโโโโโโโโโโโโโโโโโ
๐ข Bullish Scenario ๐
The bullish outlook will strengthen if the price can:
โ
Break and close above the Descending Trendline.
โ
Turn the former resistance into a new support level.
โ
Be accompanied by increasing buying volume.
๐ฏ Potential Resistance Targets:
๐ฅ Target 1: $0.2780
๐ฅ Target 2: $0.3350
๐ฅ Target 3: $0.4420
๐
Target 4: $0.5220
๐ Target 5: $0.5580
๐ Target 6: $0.6350
๐ If bullish momentum continues, the $0.6350 area becomes the primary target and could open the door for a larger medium-term recovery.
โโโโโโโโโโโโโโโโโโโโ
๐ด Bearish Scenario ๐
The bearish trend could regain control if:
โ The price fails to break above the Descending Trendline.
โ A strong rejection occurs at the trendline resistance.
โ The price loses nearby support levels and resumes downward movement.
โ ๏ธ Key Support Levels:
๐ก๏ธ Major Support Zone: $0.1900 โ $0.1700
If this support area is broken, the probability of continuing the downtrend and printing new lows will increase significantly.
โโโโโโโโโโโโโโโโโโโโ
๐ฏ Conclusion
CRV is currently at a critical decision point โก. After spending months under bearish pressure, the price is showing signs of recovery by challenging the Descending Trendline Resistance ๐ป that has acted as the main barrier to upward movement.
๐ A confirmed breakout above the trendline could become the catalyst for a bullish phase targeting the $0.2780 โ $0.6350 region ๐.
๐ However, until the breakout is fully confirmed, traders should remain cautious of a potential rejection and continuation of the bearish trend ๐.
๐ฅ The current trendline area is a crucial zone worth monitoring, as it may determine CRV's direction for the coming weeks and potentially months.
๐ก Trade the confirmation, not the speculation.
#CRV #CRVUSDT #CurveDAO #Crypto #Cryptocurrency #TechnicalAnalysis #Altcoin #Bullish #Bearish #Breakout #TrendlineBreakout #DescendingTrendline #PriceAction #SupportAndResistance #CryptoTrading #Binance #Altseason #MarketStructure #SwingTrading #ChartAnalysis #TrendReversal #CryptoMarket #TechnicalTrader ๐๐๐ฅ
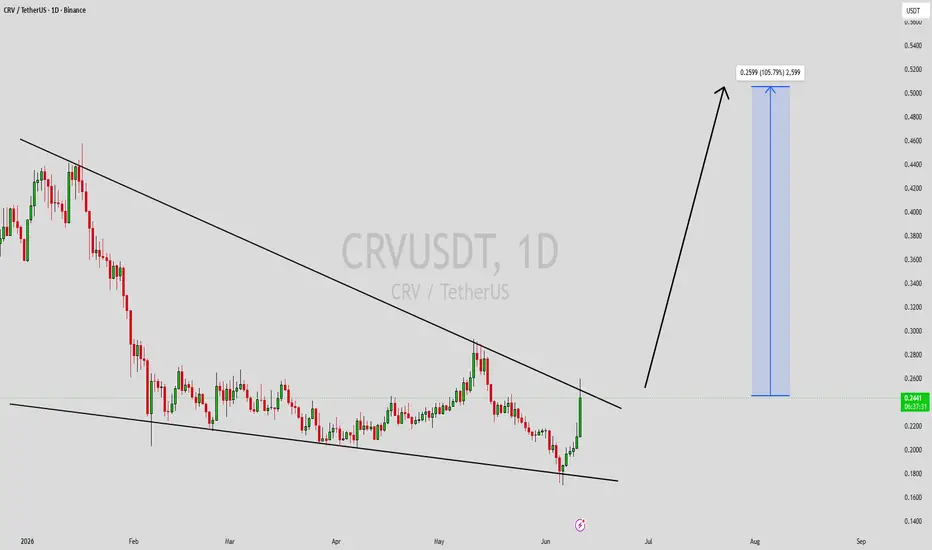
CRVUSDT Forming Falling WedgeCRVUSDT is forming a clear falling wedge pattern, a classic bullish wave signal that often indicates an upcoming breakout. The price has been consolidating within a tightening range, suggesting that bearish pressure is gradually fading while buyers are beginning to step in with greater confidence. With steady volume supporting accumulation at lower levels, the current structure points toward the possibility of a strong bullish breakout in the near future.
The projected move could lead to an impressive gain of around 90% to 100% once the price successfully breaks above the wedge resistance. This falling wedge pattern is commonly observed near the end of prolonged corrections or downtrends and often signals a transition from bearish sentiment to renewed bullish momentum.
Traders closely watching CRVUSDT are noticing increasing strength as the asset approaches a key breakout zone. Healthy trading volume adds further confidence to the setup, indicating that market participants may already be positioning themselves ahead of a potential trend reversal. Growing interest in CRVUSDT reflects improving market sentiment and confidence in its technical outlook.
If the breakout is confirmed with sustained volume, it could trigger the beginning of a fresh bullish leg. This setup may offer an attractive opportunity for medium-term traders seeking strong upside potential as momentum continues to build and the pattern nears completion.
โ
Show your support by hitting the like button!
โ
Leave a comment below! (What is your opinion about this coin?)
Your feedback and engagement keep me inspired to share more insightful market analysis with you!
Curve Finance (CRV) Technical Analysis
CRV is bouncing after sweeping the recent lows, but it is now testing an important resistance zone.
The move back into the 6H moving averages is a positive short-term sign. However, bulls still need to reclaim the red resistance area before this starts to look like a stronger reversal.
If CRV breaks and holds above this zone, the next target is the upper rejection area marked on the chart. If price gets rejected, the lower support zone could be retested.
Volume profile shows heavy supply above current price, so confirmation is key.
CRV levels to watch:
Support: recent lows
Resistance: current red zone, then upper range
Bullish: reclaim resistance
Bearish: rejection and lower support retest
CRV has bounced, but bulls still need to prove control.
Curve Finance (CRV): my second idea $10 targetCRV is showing strong signs of having carved out a macro bottom.
I may not claim to be a crypto expert, Iโve closely followed Curveโs fundamentals over an extended period. With regulatory clarity (e.g. the upcoming Clarity Act) approaching, CRV stands out as a strong candidate to benefit significantly from improved market conditions.
In addition, Iโve consistently followed analyses from CrediBull Crypto, whose track record and understanding of market structure I respect. One key thesis that resonates with me is that CRV has yet to experience a true, full-scale bull run. From that perspective, the current setup may represent the early stages of a larger expansion phase.
CrediBull also provides detailed breakdowns on the relationship between CRV and CVX, reinforcing the idea that this ecosystem is fundamentally stronger than price action alone has suggested in previous cycles. Importantly, I see his work as driven by genuine market insight rather than external incentives.
Iโm bullish on CRV and expect a structural expansion phase to unfold.
I stick to spot trading only. Let the market do the work. Stay focused and enjoy the bull cycle ahead.
#CRV Ready foe Short Term Recovery | Bulls Ready to Take Charge Yello, Paradisers! Is #CRV about to bounce aggressively from this key demand zone, or is there a trap for late buyers? Let's view #CurveDAO setup:
๐#CRVUSDT is currently moving inside a falling wedge, a structure that often leads to a strong breakout once the pressure phase is completed. Price is now approaching the lower boundary of the channel, which is a critical decision area for the next move.
๐ The strong demand zone around $0.203 is acting as the main support, and this area is further reinforced by a higher timeframe double bottom structure. As long as #CRVUSD holds above this level, the bullish scenario remains valid and we can expect buyers to step in.
๐A confirmed breakout above the descending resistance, followed by a clean retest and support from the 50EMA, would significantly increase the probability of a bullish move. This would signal that the market has shifted from distribution to accumulation. If that breakout occurs, the first upside target is the moderate resistance at $0.263, where we expect some reaction. A successful push above this level opens the path toward the major resistance at $0.293, which is the next key supply zone.
๐From a momentum perspective, the MACD is showing a bullish crossover, indicating that selling pressure is weakening and momentum is slowly shifting in favor of the bulls. However, price confirmation is still required. On the downside, if the price loses the support zone around $0.181, the bullish setup becomes invalid. This would likely lead to further downside and continuation of the bearish structure.
Trade smart, Paradisers. This setup will reward only the disciplined.
MyCryptoParadise
iFeel the success๐ด