CRV – Major Retest: Is This the Beginning of a Bullish Reversal?HOSE:CRV is currently retesting a major support zone between $0.245 – $0.200, an area that has previously acted as an important price support level across multiple periods.
On the Weekly timeframe, CRV is still trading below its Descending Trendline, which has consistently pressured price movements and maintained a bearish market structure over the long term.
However, there is something interesting about the current price action.
After recovering from the support area and briefly reaching re
Curve / Tether
No trades
No trades
In-depth trading ideas
CRVUSDT: Potential Bullish Reversal from Key Demand ZoneFundamental Analysis: Curve Finance continues expanding its DeFi ecosystem through crvUSD, LlamaLend, and cross-chain liquidity developments, supporting its long-term outlook.
Technical Analysis: CRV is trading near $0.2571 after a sharp correction. RSI near 30 signals oversold conditions, while MACD remains bearish. The $0.235–$0.240 support zone could offer a potential rebound opportunity.
Trading Levels (LONG):
🟢 Entry: $0.240 – $0.235
🔴 Stop-Loss: $0.230
🎯 TP1: $0.264
🎯 TP2: $0.282
🎯
CRV is still bearish (8H)After forming a high and a SW H, price created a bearish CH and subsequently broke the short-term trendline, confirming a shift in the short-term structure. Price is currently in the middle of a drop, and we are now waiting for it to reach an important support area.
We have identified a strong support zone on the chart, and this is the area where we are looking for potential buy/long positions. The reaction from this zone will be important, as we want to see how price behaves once it reaches th
The bullish waves of CRV are not over yet! (8H)The bullish phase of CRV started from the point where we placed the green arrow on the chart, and the overall structure continues to suggest that the bullish waves are not finished yet.
At the moment, it appears that CRV is developing Wave C of this bullish phase. Interestingly, Wave C itself seems to be forming a Symmetrical pattern, with the internal structure suggesting that another bullish leg may still remain.
Based on the current wave structure, we believe one more bullish wave, Wave i,
CRV — Technical Structure at a Key Decision Zone**CRV — Technical Structure at a Key Decision Zone | Curve DAO Token**
Curve DAO Token (CRV) is the governance token of Curve Finance, a major decentralized finance protocol focused on efficient liquidity and trading through its DEX/AMM infrastructure. The Curve ecosystem also includes **crvUSD** and **Llamalend**, expanding the protocol beyond decentralized exchange into stablecoins and on-chain lending.
From a fundamental perspective, Curve continues to show active ecosystem development. Rec
$CRV Long Trading SetupSo, for HOSE:CRV besides that we are currently on an uptrend, and besides that we are forming new levels of high, we see strong bullish momentum, and also a break-out of a psychological level of resistance, which is 0.4
So, we are giving it a chance for longs here.
Coin: BINANCE:CRVUSDT Long
Leverage: Isolated x2
Entry: 0.4010
target 1: 0.4620
Target 2: 0.5646
SL: 0.3
Curve Finance (CRV): my second idea $10 targetCRV is showing strong signs of having carved out a macro bottom.
I may not claim to be a crypto expert, I’ve closely followed Curve’s fundamentals over an extended period. With regulatory clarity (e.g. the upcoming Clarity Act) approaching, CRV stands out as a strong candidate to benefit significantly from improved market conditions.
In addition, I’ve consistently followed analyses from CrediBull Crypto, whose track record and understanding of market structure I respect. One key thesis that re
CRV (Y26.P4.E1). Level of interest (x2)Hi Traders,
I have 2 levels of interest for a potential pullback that fits our thesis of this flat corrective wave.
Avwap red or blue ..If BTC pulls back a fair bit, so I see CRV . Ideally take ou the liquidity.
Note the Elliott wave count aligns.
All the best,
S.Sari
Curve DAO - CRV price analysisCRYPTOCAP:CRV has printed a new all-time low... Yet the price action tells a more interesting story.
Despite setting a fresh ATL, it feels like someone is still defending OKX:CRVUSDT , preventing it from slipping into a true free fall.
Whether that's accumulation or simply strong support remains to be seen.
But the chart is becoming increasingly interesting.
📈 The road higher won't be easy. The first major challenge is reclaiming $0.29.
🆗 If buyers succeed, the next battle begins around $0.40
CRV/USDT | H1 | CRV GAINING MOMENTUM IN OVERLOAD ZONE🎯 TP1: $0.365791 (+2.58%) │ TP2: $0.374983 (+5.16%)
🛑 SL: $0.33242 (-8.00%) │ R/R: 1 : 0.64
⚠️ Stop is wider than TP2 target (R/R < 1) — the closer target is taken more often, but calculate your position size based on the stop size
FUNDAMENTAL BACKGROUND
CRV is receiving support from several project catalysts: a reduction in the token's annual emission, the launch of LlamaLend V2, and a listing on Upbit are stimulating demand, while outflows from Binance and weakening weekly unlocks are creati
$CRV IS BREAKING OUT OF A 4-YEAR BEARISH STRUCTURE | $6 NEXT?HOSE:CRV IS BREAKING OUT OF A 4-YEAR BEARISH STRUCTURE | $6 NEXT?
HOSE:CRV has completed ~97% of its entire macro drawdown and has now produced a strong reaction from the $0.19–$0.22 HTF demand/accumulation zone.
The recent ~80% rebound from the local bottom confirms aggressive demand at these levels.
From a pure market-structure perspective, the key level is $0.4584.
A sustained 2W breakout and close above this resistance would invalidate much of the prevailing bearish structure and open
CurveDAO Is Compressing. Framing The Breakout Scenario.Impulse legs show strength, but consolidation patterns define execution locations.
Fundamental & DeFi
Curve DAO Token (CRV) remains one of the core foundational pillars of Decentralized Finance (DeFi), serving as the primary automated market maker (AMM) for stablecoins and pegged assets. Despite historical market turbulence across the sector, Curve’s deep liquidity pools and protocol revenue model continue to make it a key gauge for institutional DeFi risk appetite.
Technical Analysis (4H)
CRVUSDT — Support Breakdown Opens a Short-Term Bearish SetupBINANCE:CRVUSDT CRV has now given a short-term sell signal following the breakdown of support.
On the 4H structure , price had previously moved higher, but is now giving back a large part of that move. This puts the recent buyers under pressure, and I expect them to make an attempt to defend the market.
That is exactly why I don't want to fight the market or assume the next move is guaranteed.
The current short-term setup is bearish, but the better risk/reward opportunity could come if price
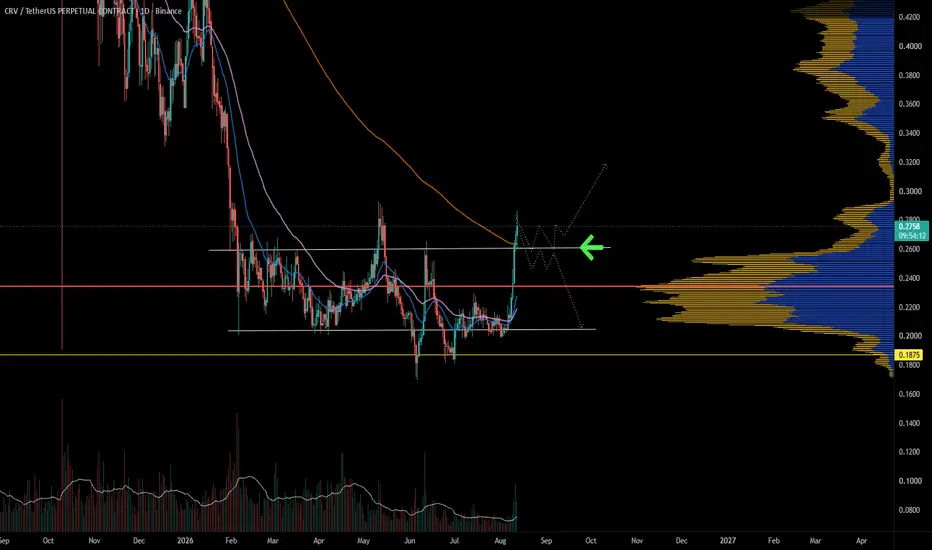
CRV: Daily Ascending Channel Confirmed Above $0.265 HighCRV: Daily Ascending Channel Confirmed Above $0.265 High – Chasing Warning and Strategic Retracement Short Setup
Curve DAO Token (CRV) has confirmed a major technical milestone as daily price candles decisively penetrated the $0.265 swing high, confirming that the macro daily market structure is operating within an ascending parallel channel. A vertical multi-day rally has propelled price action cleanly above the dynamic MA100 trendline resistance.
Based on the visual data from the daily cha
CRV UpdateCRV is showing renewed strength after breaking out from its multi-month accumulation range with a clear expansion in volume.
Price has reclaimed the short-term moving averages and is now testing a major resistance zone alongside the declining long-term moving average. The Synergy Signal confirms improving momentum, but it is approaching overbought territory, so a brief consolidation or retest would be healthy.
If CRV holds the breakout zone as support, the structure favors continuation. Losing
CRVUSDT Forming Bullish PennantCRVUSDT is forming a clear bullish pennant pattern, a classic bullish wave signal that often indicates an upcoming breakout. The price has been consolidating within a narrowing range, suggesting that selling pressure is weakening while buyers are beginning to regain control. With consistent volume confirming accumulation at lower levels, the setup hints at a potential bullish breakout soon. The projected move could lead to an impressive gain of around 30% to 40% once the price breaks above the p
CRV: local squeeze with $0.2525 destinationThe Macro Picture 🗺️
CRV unwound from the $0.2929 macro ceiling into a summer range and now sits at $0.2103, holding above the $0.2010 local low. Price is coiling in the middle of the range with the floor intact — a base rebuilding, not a breakdown.
The Setup ⚙️
The Range Floor 🟢
$0.2010 (Local Low) is the demand shelf, with $0.1696 (Macro Support) as the deeper backstop. Both have held, and that's the base this range pivots on.
The Decision Point 🔴
$0.2299 (Local High) is the gate. A daily c
CRV Tests Major Descending Trendline — Bearish Rejection SetupCRV is testing a multi-month descending trendline after a prolonged consolidation phase.
If the breakout attempt fails, price could pull back toward the $0.2032 support area.
Trading Levels
Direction: Short
Entry: $0.215
Take Profit 1: $0.200
Take Profit 2: $0.193
Stop Loss: $0.222
The setup remains valid while CRV stays below the trendline resistance.
CRVUSDT - Descending TrendLine, Breakout or fakeout?📊 Technical Analysis
💵 Coin: HOSE:CRV #CRV
⏳ Time Frame: 2D
📐 Pattern: Descending TrendLine (Major Resistance)
---
📌 Chart Overview
🔸 Primary Trend Remains Bearish
Since reaching its peak around $1.16, CRV has consistently formed Lower Highs and Lower Lows, confirming that the medium-term downtrend is still intact.
The Descending TrendLine has repeatedly acted as a strong dynamic resistance, rejecting every significant recovery attempt.
🔸 Price Is Testing a Key Dynamic Resistance
CRV
VRV USDT LONG SIGNAL#96 CRV/USDT – Trade Setup (LONG)
📈 Position Type: LONG
🕒 Timeframe: 1H
📊 Market: Futures
💰 Entry Zone:
Market
0.2086
🛑 Stop-Loss:
0.2050
🎯 Take-Profit Targets:
• TP1: 0.2215
• TP2: 0.2278
• TP3: 0.2369
• TP4: 0.2456
⚙️ Leverage:
5 *10
▫️ After TP1, move SL to Entry + 0.2%.
▪️ Exit Plan:
• 40% at TP1
• 20% at TP2
• 20% at TP3
20% at. TP4
📌 Risk Management:
Risk only 1–2% of your capital per trade.
⚠️ Always check and confirm the setup on your chart before entering the trad