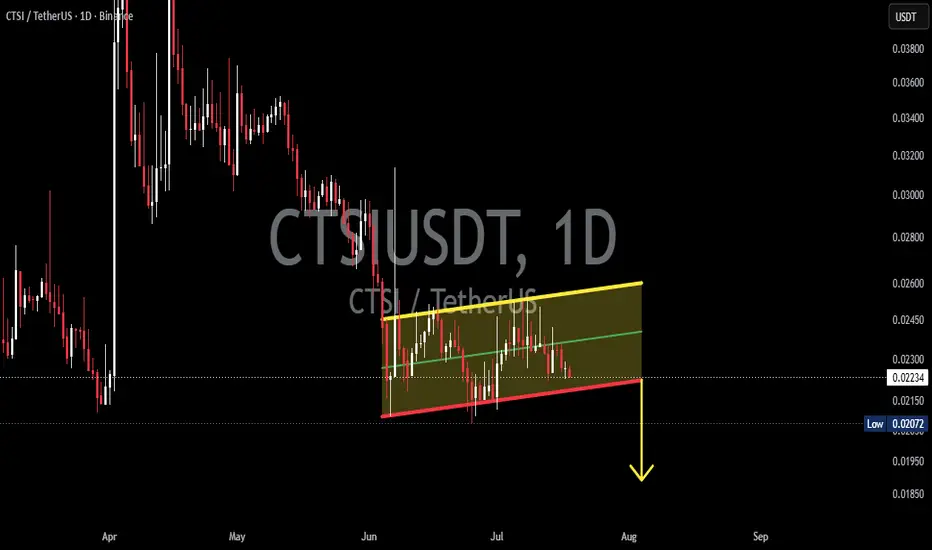
CTSIUSDT Testing a Bear Flag – Breakdown or Bull Trap?📊 Technical Analysis
💵 Coin: CRYPTOCAP:CTSI #CTSI
⏳ Time Frame: 1D
📉 Pattern: Bear Flag
🎯 Bias: Bearish Continuation
👀 Status: Testing the Lower Support Trendline
CTSI is currently forming a 🚩 Bear Flag pattern on the 1D timeframe, a classic bearish continuation pattern that typically develops after a strong downward move (flagpole), followed by a consolidation phase inside an ascending channel before the next major price movement.
📌 On this chart, price is trading within an ascending channel, which serves as the consolidation zone. As long as price remains inside this channel, both breakout and breakdown scenarios remain possible.
⚠️ However, since this pattern appears after a significant bearish trend, the probability still favors a continuation of the downtrend if the channel support is broken.
---
🔴 Bearish Scenario (Main Scenario) 📉
🚨 If price breaks down and closes below the lower trendline (Bear Flag support) with increasing volume, the 🚩 Bear Flag pattern will be confirmed.
This confirmation could trigger renewed selling pressure and continue the prevailing downtrend, which is the typical behavior of a Bear Flag.
📉 The stronger the breakdown, the higher the probability of a continuation toward the next key support levels.
📊 Probability
🔴 Bearish: 70–75%
---
🟢 Bullish Scenario (Alternative Scenario) 📈
✅ The bearish outlook will begin to weaken if price successfully breaks above the upper trendline with strong buying volume.
Such a breakout would indicate that buyers are regaining momentum, potentially shifting the short-term market structure into a bullish trend.
⚠️ However, as long as price remains inside the Bear Flag channel, any upward movement should still be considered a consolidation phase before the next major move.
📊 Probability
🟢 Bullish: 25–30%
---
📚 Pattern Explanation – 🚩 Bear Flag
A Bear Flag is a bearish continuation pattern that forms after a sharp decline (Flagpole), followed by a gradual upward consolidation inside a parallel ascending channel.
✨ Key Characteristics of a Bear Flag
✅ Begins with a strong bearish impulse (Flagpole)
📈 Price consolidates within an ascending channel
📉 Trading volume typically decreases during the consolidation phase
🚨 A breakdown below the channel support confirms the continuation of the bearish trend
🎯 The downside target is commonly projected using the length of the Flagpole once the pattern is confirmed.
💡 As long as the Bear Flag support remains intact, price is still in the consolidation phase, and traders should wait for a confirmed breakout or breakdown before making trading decisions.
---
📌 Conclusion 🎯
CTSI remains within a 🚩 Bear Flag structure on the 1D timeframe, making the channel support a critical level to watch.
🔻 Support Breakdown ➡️ Confirms the Bear Flag and increases the probability of further downside.
🔺 Resistance Breakout ➡️ Invalidates the Bear Flag and opens the possibility of a short-term trend reversal.
⚠️ Always wait for candle-close confirmation and strong volume before entering a trade. Don't forget to apply proper risk management in every position.
#CTSI #CTSIUSDT #Crypto #Cryptocurrency #Altcoins #Trading #TechnicalAnalysis #TradingView #BearFlag #Bearish #PriceAction #ChartPattern #CryptoTrading #Binance #MarketAnalysis #SwingTrading #Breakdown #SupportResistance #DYOR
In-depth trading ideas
CTSI/USDT - Descending Trendline: Preparing for a Breakout?CTSI/USDT on the 3D timeframe still appears to be in a long-term downtrend phase, but price is now showing signs of accumulation and starting to pressure a major descending trendline resistance. ⚡
This area is becoming a crucial point that could determine the next major market direction. 👀
The descending trendline formed since late 2024 remains the dominant resistance, but selling pressure is beginning to weaken as a stronger support base forms at the lower range. If volume starts increasing and candles manage to close above the trendline, the potential for a mid-to-long term reversal could begin to open up. 🚀
📉 Chart Structure & Pattern
The chart currently shows:
🔻 Descending Trendline / Long-Term Downtrend
Price has consistently formed lower highs and lower lows over the past several months, indicating that bearish dominance is still active. However, the slope of the decline is gradually weakening and volatility is decreasing, which often becomes an early signal of a potential reversal. 📊
📦 Accumulation Phase
The sideways movement at the lower range indicates a possible accumulation phase by buyers after a prolonged decline. This zone becomes very important before the market decides between breakout or breakdown. 🔄
⚠️ Major Resistance Areas
Several key resistance levels visible on the chart:
🔸 0.0370 → nearest resistance
🔸 0.0420 → early breakout confirmation
🔸 0.0505 – 0.0560 → strong supply zone
🔸 0.0730 → major bullish target
🚀 Bullish Scenario
The bullish scenario becomes stronger if:
✅ Price successfully breaks out and closes above the descending trendline
✅ Resistance at 0.0370 is broken with strong volume
✅ The 3D candle manages to hold above 0.0420
If the breakout is confirmed, the next upside targets could be:
🎯 Target 1: 0.0420
🎯 Target 2: 0.0505
🎯 Target 3: 0.0560
🎯 Target 4: 0.0730
🔥 A breakout from a long-term descending trendline often becomes an early signal of a market structure shift from bearish to bullish reversal.
🩸 Bearish Scenario
The bearish scenario remains valid if price fails to break the trendline and gets rejected again at the current resistance zone. ❌
⚠️ If rejection happens, price could potentially:
🔻 Drop back toward previous support zones
🔻 Continue forming lower lows
🔻 Retest the low area around 0.0230 – 0.0180
As long as price remains below the main descending trendline, the market technically remains under long-term bearish pressure. 📉
📌 Conclusion
CTSI is currently sitting at a very critical zone. Price is testing a major trendline resistance after a prolonged downtrend. 💥
✅ A valid breakout could open strong reversal opportunities toward higher resistance targets
❌ Meanwhile, a failed breakout may send the market back into bearish continuation mode
🔥 This area could become a major decision zone for CTSI over the coming weeks to months. 👀📈
#CTSI #CTSIUSDT #Crypto #Altcoin #TechnicalAnalysis #CryptoTrading #Bullish #Bearish #Breakout #Trendline #DescendingTrendline #Altseason #SupportResistance #ChartAnalysis #PriceAction #CryptoMarket #Trader #SwingTrading
CTSIUSDT Forming Bullish MomentumCTSIUSDT is forming a clear bullish momentum pattern, a classic bullish reversal signal that often indicates an upcoming breakout. The price has been consolidating within a narrowing range, suggesting that selling pressure is weakening while buyers are beginning to regain control. With consistent volume confirming accumulation at lower levels, the setup hints at a potential bullish breakout soon. The projected move could lead to an impressive gain of around 60% to 70% once the price breaks above the wedge resistance.
This bullish momentum pattern is typically seen at the end of downtrends or corrective phases, and it represents a potential shift in market sentiment from bearish to bullish. Traders closely watching CTSIUSDT are noting the strengthening momentum as it nears a breakout zone. The good trading volume adds confidence to this pattern, showing that market participants are positioning early in anticipation of a reversal.
Investors’ growing interest in CTSIUSDT reflects rising confidence in the project’s long-term fundamentals and current technical strength. If the breakout confirms with sustained volume, this could mark the start of a fresh bullish leg. Traders might find this a valuable setup for medium-term gains, especially as the pattern completes and buying momentum accelerates.
✅ Show your support by hitting the like button and
✅ Leaving a comment below! (What is your opinion about this Coin?)
Your feedback and engagement keep me inspired to share more insightful market analysis with you!
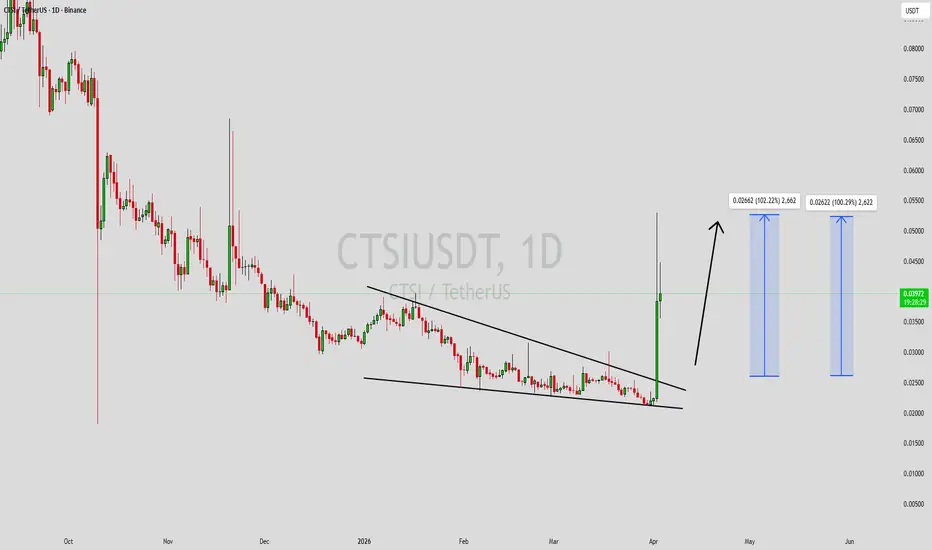
CTSIUSDT Forming Falling WedgeCTSIUSDT is forming a clear falling wedge pattern, a classic bullish reversal signal that often indicates an upcoming breakout. The price has been consolidating within a narrowing range, suggesting that selling pressure is weakening while buyers are beginning to regain control. With consistent volume confirming accumulation at lower levels, the setup hints at a potential bullish breakout soon. The projected move could lead to an impressive gain of around 90% to 100% once the price breaks above the wedge resistance.
This falling wedge pattern is typically seen at the end of downtrends or corrective phases, and it represents a potential shift in market sentiment from bearish to bullish. Traders closely watching CTSIUSDT are noting the strengthening momentum as it nears a breakout zone. The good trading volume adds confidence to this pattern, showing that market participants are positioning early in anticipation of a reversal.
Investors’ growing interest in CTSIUSDT reflects rising confidence in the project’s long-term fundamentals and current technical strength. If the breakout confirms with sustained volume, this could mark the start of a fresh bullish leg. Traders might find this a valuable setup for medium-term gains, especially as the wedge pattern completes and buying momentum accelerates.
✅ Show your support by hitting the like button and
✅ Leaving a comment below! (What is your opinion about this Coin?)
Your feedback and engagement keep me inspired to share more insightful market analysis with you!
CTSI About to Explode or Fakeout Incoming?Yello Paradisers is CTSI finally ready to break out, or are we looking at another trap to wipe out emotional traders?
💎#CTSIUSDT has been moving inside a clean descending channel, respecting both support and resistance levels. The price recently bounced strongly from the key demand zone around $0.041 to $0.044, showing clear signs of accumulation. Now, price is approaching the descending resistance, where a confirmed breakout could change the game entirely.
💎A clean break and daily close above the $0.050 level would likely trigger bullish momentum, with short-term upside toward the 0.056 area. If this level gets cleared, the real target lies at 0.063 to 0.065, which marks a strong resistance zone and a likely exit area for smart money.
💎However, it's important to stay focused. Until the breakout is confirmed, this move remains unverified. Many traders get caught in fakeouts by rushing in too early. A move below $0.0379 would invalidate the bullish setup entirely, and at that point, the bias shifts back to the downside.
Discipline, patience, robust strategies, and trading tactics are the only ways you can make it long-term in this market.
MyCryptoParadise
iFeel the success🌴
CTSIUSDT 1D#CTSI is moving inside a descending channel on the daily chart. Volume has increased significantly, and the MACD is giving a bullish signal. CTSI has attempted twice to break above the channel resistance but was rejected by a resistance cluster, which includes the channel resistance, the daily SMA50, the upper Bollinger Band, and the Ichimoku cloud. These were not drawn on the chart to avoid overcrowding.
However, alongside this resistance cluster, we believe BTC’s weakness has also limited CTSI’s growth. Consider buying here and near the support zone. In case of a breakout above the channel, the potential targets are:
🎯 $0.0550
🎯 $0.0617
🎯 $0.0689
🎯 $0.0760
🎯 $0.0863
🎯 $0.0993
⚠️ Always remember to protect your capital with a proper stop-loss and disciplined risk management.
CTSIUSDT Forming Falling WedgeCTSIUSDT is showcasing a textbook falling wedge pattern on the daily and weekly charts, a classic bullish reversal signal that's drawing sharp attention from crypto traders amid the ongoing altcoin recovery phase in late 2025. This converging downward-sloping formation, with the upper resistance line steeper than the lower support, indicates waning bearish momentum as sellers exhaust their grip and buyers quietly accumulate at progressively higher lows—think of it as the market coiling like a spring before an explosive breakout. Recent price action around $0.0412 has respected the wedge's boundaries with precision, and the surge in trading volume—up over 4.44 million USDT in the last 24 hours—confirms genuine interest, not just speculative noise. As CTSIUSDT hovers near the apex of this pattern, a decisive close above the upper trendline near $0.045 could trigger the long-awaited upside thrust, aligning perfectly with broader blockchain scalability narratives where projects like Cartesi are positioned to capitalize on Ethereum's rollup boom. High-conviction setups like this falling wedge in CTSIUSDT aren't just technical footnotes; they're roadmaps for 90% to 100%+ gains in the midterm bull run, especially as RSI climbs from oversold territory and moving averages hint at a golden cross reversal.
Diving deeper into the fundamentals fueling this CTSIUSDT momentum, Cartesi's Linux-based virtual machine continues to bridge traditional software devs into Web3, enabling app-specific rollups with off-the-shelf tools like Python and Rust— a game-changer that's sparked fresh investor buzz following the July 2025 token buyback and Honeypot v2's mainnet fraud-proof deployment. With over 170 developers snapping up spots in Brazil's latest Cartesi courses and integrations like Espresso Systems' Decaf testnet live for multiple rollups, the ecosystem is humming with real utility, from validator marketplaces to staking rewards that lock in long-term holders. This isn't hype; it's substantiated growth, as CTSI's market cap stabilizes at $36.56 million while altcoin season index ticks up, signaling smart money rotating from Bitcoin dominance into undervalued gems like this. The falling wedge breakout in CTSIUSDT isn't isolated—it's amplified by Cartesi's Stage-2 security categorizations on L2BEAT and partnerships that promise fast BFT consensus, making it a prime pick for traders eyeing 2025's projected highs of $0.128 or more. Volume spikes here scream conviction, turning what was once a sidelined token into a breakout contender with 200% rally potential on the horizon.
✅ Show your support by hitting the like button and ✅ Leaving a comment below! (What is You opinion about this Coin) Your feedback and engagement keep me inspired to share more insightful market analysis with you!
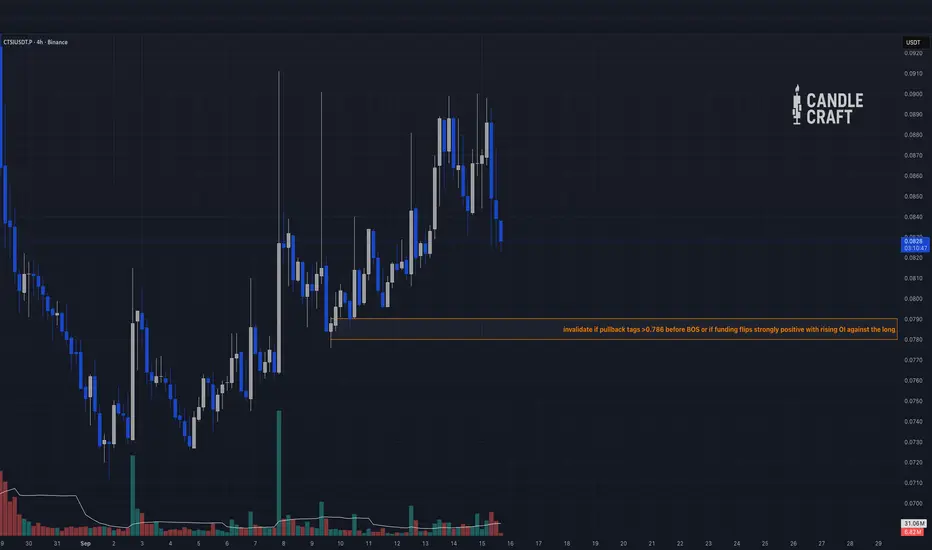
CTSI — The Three-Quarter Trap Before ExpansionCTSI is dangling bait. Price hovers at 0.083, giving comfort to longs — but the real prize sits lower. Markets love the three-quarter retrace: deep enough to flush weak hands, not deep enough to kill the trend.
Imagine a slingshot: you pull it back further than feels safe, the band creaks, everyone panics — and then it rips forward with force. That’s exactly what CTSI is building into 0.0793–0.0779.
HTF / MTF (12H / 4H)
• Price ~0.0830, range-to-up bias
• Key retrace zones: 0.0808 (0.618), 0.0793 (0.750), 0.0779 (0.786)
• Structure: basing, coiling energy
LTF (15m Playbook)
• Wait for BOS↑ after sweep into 0.0793–0.0779
• Fresh OB/FVG inside BOS impulse = trigger zone
• Liquidity magnets: 0.0865 → 0.0890 → 0.0915
Flow / Derivatives
• OI climbing = healthy participation
• Funding neutral
• CVD weak but primed for reversal on absorption
• Liqs stacked 0.089–0.093 = exit fuel
Idea Map
• Long setup from 0.0796 (BOS FVG fill)
• Invalidation: below 0.0772
• Targets: 0.0845 → 0.0890 → 0.0918
• R:R potential ~3.9:1
⚡ Liquidity hunts aren’t about comfort. They’re designed to look ugly, feel wrong, and trap the majority. That’s why they work.
Candle Craft | Signal. Structure. Execution.
CTSIUSDT Forming Bullish PennantCTSIUSDT is currently forming a bullish pennant pattern, a strong continuation setup that often signals an upcoming breakout. After a healthy upward rally, the price has entered into consolidation, creating a pennant structure with tightening price action. This type of formation, especially when supported by solid trading volume, typically precedes a sharp bullish move, making CTSIUSDT an exciting coin to watch in the short term.
The technical outlook suggests that once CTSIUSDT breaks out of this pennant, the price could surge significantly, potentially delivering 90% to 100%+ gains. Market participants are already showing interest, with volume remaining steady, a clear indication that buyers are positioning themselves for the next leg up. Historically, bullish pennant breakouts attract heavy momentum and can lead to rapid gains within a relatively short period.
Investor sentiment around CTSI is improving, as more traders recognize its potential during this consolidation phase. The tightening range is also reducing volatility, which often leads to a powerful expansion once the breakout occurs. If momentum continues to build, CTSIUSDT could target higher resistance levels quickly, validating the bullish pennant pattern and rewarding early investors.
Overall, CTSIUSDT is shaping up to be one of the stronger setups in the market right now. With a bullish pennant pattern, good trading volume, and increasing investor attention, the technicals align with the potential for a strong upside rally. Traders and investors should keep this pair on their watchlist as the breakout opportunity approaches.
✅ Show your support by hitting the like button and
✅ Leaving a comment below! (What is You opinion about this Coin)
Your feedback and engagement keep me inspired to share more insightful market analysis with you!
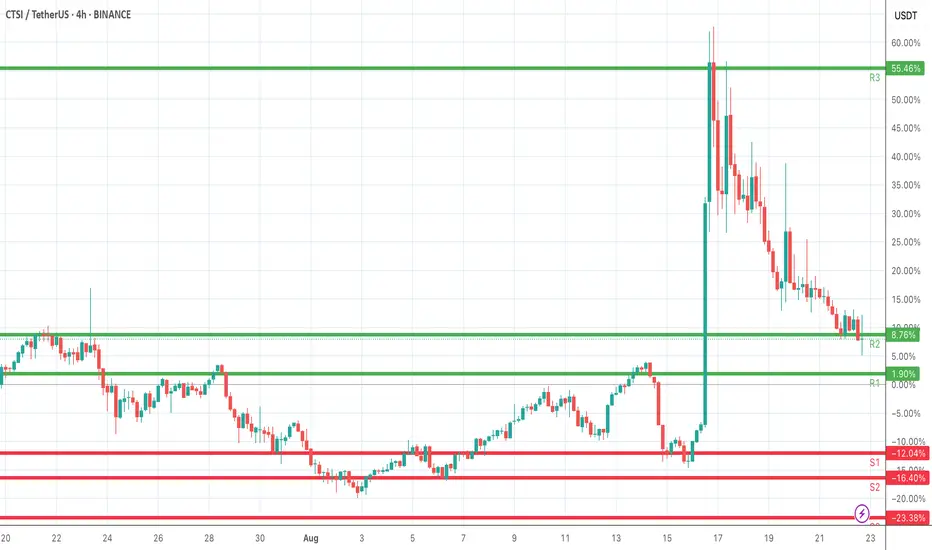
CTSI/USDT 4H chartCTSI/USDT 4H chart
Levels:
• Resistance (R3): ~55.46%
• Resistance (R2): ~8.76%
• Resistance (R1): ~1.90%
• Support (S1): ~-12.04%
• Support (S2): ~-16.40%
• Support Zone: extends toward ~-23.38%
What the chart shows:
1. Price pumped hard to R3 (55.46%) but got rejected strongly.
2. Now it’s consolidating near R2 (8.76%), struggling to hold above it.
3. If it loses momentum, it may retest R1 (1.90%) or even dip into the support zone (S1–S2).
4. For a bullish move again, price must break and hold above R2 → R3, which seems like a tough resistance zone.
Trading perspective:
• Bullish case: If CTSI bounces above R2 and sustains, it could attempt another leg up.
• Bearish case: If it fails to hold R2, we might see a drop toward S1/S2.
At the moment, momentum looks weakened (lots of red candles after the big pump), so it may consolidate or retest support before any big move.
$CTSI Overbought Surge: 4H Trading Strategy with RSI AlertBINANCE:CTSIUSDT
Trading Levels:
Entry: 1.00 (0.1215 USDT) - The level where the initial purchase is planned.
DCA (Dollar-Cost Averaging): 1.135 (0.1293 USDT) - An additional buying point if the price rises.
SL (Stop Loss): 1.272 (0.1373 USDT) - The level where the loss would be limited.
TP (Take Profit):TP1: 0.786 (0.1091 USDT)
TP2: 0.618 (0.0994 USDT)
TP3: 0.5 (0.0925 USDT)
TP4: 0 (0.0636 USDT) - A significantly lower target, possibly a long-term goal or error.
RSI (Relative Strength Index) Indicator:
The current RSI value is 87.80, which is deeply in the overbought territory (above 70 and nearing 90). This suggests the price may be overextended, indicating a potential reversal or correction soon.
Analysis and Interpretation:
Strategy: The chart uses Fibonacci levels to determine entry, exit, and loss points. The entry is set at 0.1215 USDT, with a DCA at 0.1293 USDT if the price continues to rise, and a stop loss at 0.1373 USDT to protect capital.
Profit Targets: TP1 to TP3 are based on Fibonacci retracement levels (0.786, 0.618, 0.5), indicating a technical approach to taking profits incrementally. TP4 at 0.0636 USDT seems unrealistically low and might be a mistake.
RSI: The extremely high RSI value (87.80) signals a strong overbought condition. This could imply an imminent pullback or consolidation, especially if the price fails to sustain its recent upward momentum.
Recommendation:
Monitor the price closely around the entry level (0.1215 USDT) and DCA (0.1293 USDT). Given the overbought RSI, exercise caution with new entries or consider preparing for a potential sell-off.
CTSIUSDT Forming Bullish MomentumCTSIUSDT has recently broken out of a long-standing resistance zone with a strong bullish impulse, confirming a breakout that has caught the attention of many traders and analysts. The price action reflects a clear bullish structure, and the breakout from the accumulation range is supported by significant volume—an early sign of strong market conviction. This technical development sets the stage for a potential rally targeting a projected gain of 90% to 100%+ in the coming weeks.
The momentum behind CTSI is building, and this rally isn’t just speculative—it’s backed by volume and structure. Price has pushed through previous consolidation levels and flipped them into potential support, which could act as a launchpad for the next leg up. With altcoins starting to gain traction across the market, CTSI is emerging as one of the more promising setups among mid-cap crypto pairs.
Market interest is clearly shifting toward CTSI as investors and traders begin to recognize its breakout potential. The chart structure, momentum, and renewed interest all suggest that this coin may be entering a new phase of price discovery. If the bullish momentum continues, we could see rapid gains and possibly a parabolic move in the short term.
✅ Show your support by hitting the like button and
✅ Leaving a comment below! (What is You opinion about this Coin)
Your feedback and engagement keep me inspired to share more insightful market analysis with you!
Cartesi 5,531% Profits Potential & 2025/26 Bull MarketMy dear friends, let us start a new day of writing with great Altcoins for you today.
I've been looking at hundreds of charts, literally hundreds. Nothing is trading at bottom prices anymore.
The Altcoins market is still within a long-term support zone and sometimes a long-term consolidation zone, but the true bottom, as in the lowest possible, is already gone. This is good, we had plenty of warnings and plenty of time to buy when prices were the lowest, it is time to move to the next phase.
We no longer have the lowest ever but still have very good entry prices all across the market. A great example is Cartesi, CTSIUSDT.
Here you can see the final big ABC and the action recovering above the mid-March low. While full green this week, CTSIUSDT still trades below its 3-Feb. low. This means that it is still early for this pair.
There is a long-term higher low between now (early April 2025) and October 2020.
We are facing the start of a bullish impulse in the form of a 5-up waves pattern.
Notice the potential for profits on the chart. This is what reveals that it is still early. It is still early because even if things end up badly, say a weak bull market, CTSIUSDT can hit $1.11 and produce a bullish wave totaling 1,310%. Since the bull market will be everything but weak, we can expect higher prices.
Not weak but ultra-strong. Something unexplainable and unimaginable. We have to see it, feel it and live through it in order to believe it.
Namaste.
4000% move for Cartesi (CTSI) in 2024?At this time the market is offering a few ‘fantastic’ opportunities for outstanding returns. Yet, if you’re tuning into social media you might believe the whole market is about to explode. As wonderful as that may be, this is not 2017. You have to be selective, disciplined and patient. If you think that’s you, read this:
On the above 2 week chart after 1100 days of downtrend we have:
1) Price action and RSI resistance breakouts. The price action breakout is also the first higher high since August 2020!
2) Support on past resistance. Blue arrows.
3) The Bull flag pattern confirmation forecasts a 4000% move in price action from 20 cents to $8 (see below).
4) Markets do not go up in a straight line. You'll have to tolerate the odd 30-40% correction until target. Those swings trade opportunities will be mentioned elsewhere.
Is it possible price action might correct further? Sure.
Is it probable? No.
Ww
Type: trade
Risk: <=6%
Timeframe for long: days
Return: 3000-4000%
Bull flag
CTSI About to Detonate? Yello Paradisers! Are you ready before CTSI makes its next explosive move? Because this setup is flashing signals that most traders will only realize when it's already too late.
💎#CTSI/USDT has been trading within a clearly defined descending channel, consistently respecting both the resistance and support trendlines. What's important now is how the price has reacted after dipping into the lower boundary. After breaking slightly below the descending support, the price immediately rebounded from the key horizontal support area at $0.0552 a region that has repeatedly proven its strength over the last few weeks.
💎This recent price action confirms strong buyer interest at the current levels, and as long as the $0.0550–$0.0570 zone holds, #CTSI remains in a potential accumulation phase. The reaction here suggests that smart money might be stepping in early, preparing for a breakout move that could take retail traders by surprise.
💎If momentum begins to build and the structure breaks above the descending resistance line, the first technical obstacle will be around $0.0700 a moderate resistance that has capped price action before. A sustained move through this level would confirm the breakout, with the next key target sitting at the strong resistance zone near $0.0850. This would represent a solid bullish extension for those positioned early inside the channel.
💎However, the invalidation point is also very clear. A breakdown below the $0.0500 region, where the final demand sits, would invalidate the bullish setup and open the door to deeper downside. For now, though, the structure is favoring a potential reversal, and the market is giving us a clean range to work with.
Strive for consistency, not quick profits. Treat the market as a businessman, not as a gambler.
MyCryptoParadise
iFeel the success🌴
CTSI Breaks Major Downtrend – Is the Next Leg Up Here?CTSI/USDT – Bullish Breakout in Play
CTSI has broken out of a long-term descending trendline, signaling a major shift in market structure. After reclaiming the $0.063–$0.068 resistance zone as support, bulls are clearly in control.
Key Highlights:
✅ Downtrend broken after months of lower highs.
✅ Minor resistance flipped to support, confirming strength.
✅ RSI at 75.62 shows strong bullish momentum.
✅ Structure is now forming higher highs and higher lows — a key trend reversal sign.
🎯Upside Targets:TP1: $0.085
TP2: $0.110
Support to hold: $0.063
CTSI is gaining momentum — if support holds, the next leg up could be explosive.