Chainbase C/USDT - Critical Decision Zone, Breakout or Breakdown📊 Technical Analysis — C/USDT
⏳ Time Frame: 2D
💰 Current Price: Around 0.0581 USDT
📐 Key Structure: Descending Trendline + Horizontal Demand Zone
🟨 Demand Zone: 0.055 – 0.047 USDT
---
📐 Pattern Formation
The chart shows a long-term Descending Triangle structure formed by:
🔻 Descending Trendline
Compare with Chainbase / Tether USD
C USDT LONG SIGNAL#27. C /USDT – Trade Setup (LONG)
📈 Position Type: LONG
🕒 Timeframe: 1H
📊 Market: Futures
💰 Entry Zone:
0.05815
0.05660
🛑 Stop-Loss:
0.05550
🎯 Take-Profit Targets:
• TP1: 0.05952
• TP2: 0.06185
• TP3: 0.06448
• TP4. 0.06729
Tp5.
⚙️ Leverage:
5*
▫️ After TP1, move SL to Entry + 0.2%
C USDT LONG SIGNAL#27. C /USDT – Trade Setup (LONG)
📈 Position Type: LONG
🕒 Timeframe: 1H
📊 Market: Futures
💰 Entry Zone:
0.05815
0.05660
🛑 Stop-Loss:
0.05550
🎯 Take-Profit Targets:
• TP1: 0.05952
• TP2: 0.06185
• TP3: 0.06448
• TP4. 0.06729
Tp5.
⚙️ Leverage:
5*
▫️ After TP1, move SL to Entry + 0.2%
CUSDT: Bullish Breakout Holds – Can Buyers Push Higher?CUSDT has broken out of its recent consolidation range and is now holding above former resistance, signaling growing bullish momentum. Buyers continue to defend the breakout area, keeping the short-term trend positive.
As long as 0.06550 holds as support, the bullish outlook remains valid. A sustai
$CUSDT Respecting HTF Structure While Liquidity BuildsBINANCE:CUSDT Respecting HTF Structure While Liquidity Builds 👀
CUSDT continues holding above the rising HTF trendline while price compresses between major demand and premium resistance. The recent rejection from the 0.098–0.100 supply zone slowed momentum, but sellers still failed to break the br
Chainbase (CUSDT) Bullish Consolidation, Easy 100-200% Fast JumpGood afternoon my fellow Cryptocurrency trader, I hope you are having a wonderful day.
CUSDT (Chainbase)—I shared multiple times for you in the past three months. This is another one with a very strong chart. The slowly rising prices, ascending channel above EMA89, is nothing more than bullish cons
$C is pressing directly against the key $0.10 resistance zone. $C is pressing directly against the key $0.10 resistance zone. A confirmed daily breakout above $0.10 followed by a successful retest and hold as support would validate the bullish setup and could trigger a strong rally toward the $0.18 region 🚀
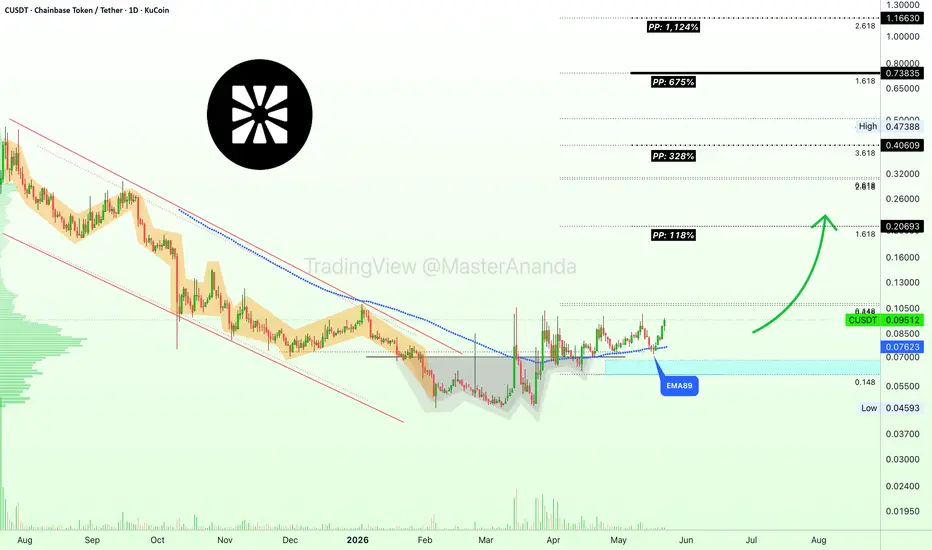
Chainbase Token (CUSDT), Highly profitable: More than 1,111% PPChainbase (CUSDT) flipped EMA89 in late March and has been trading above this level since, once resistance now turned support.
We've been looking at many projects that are accumulating at very low prices, near their all-time low and this we consider a desirable situation, we read these charts as bu
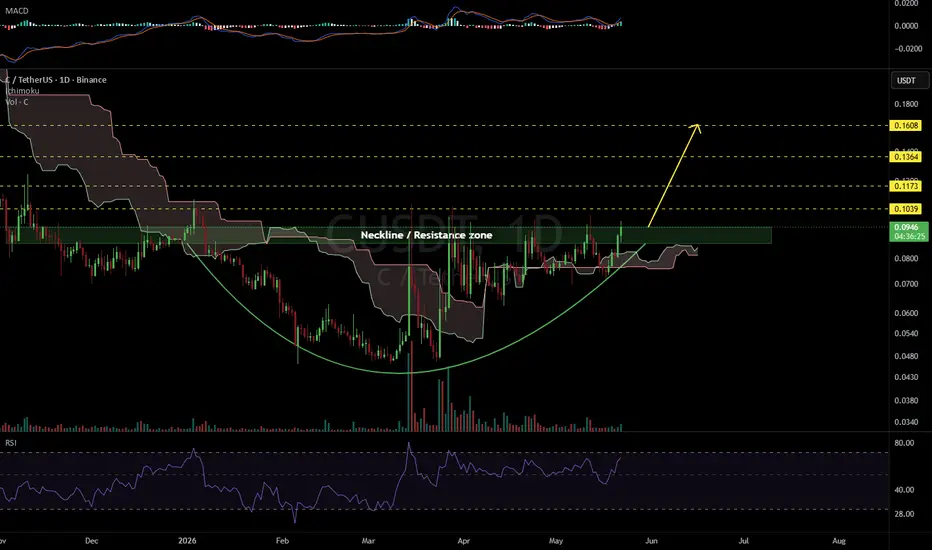
CUSDT 1D#C has formed a rounding bottom pattern on the daily chart and is trading above the Ichimoku cloud. In case of a breakout above the neckline of the pattern, the potential upside targets are:
🎯 $0.1039
🎯 $0.1173
🎯 $0.1364
🎯 $0.1608
⚠️ Always use a tight stop-loss and maintain proper risk management
See all ideas
Summarizing what the indicators are suggesting.
Oscillators
Neutral
Oscillators
Neutral
Summary
Neutral
Summary
Neutral
Summary
Neutral
Moving Averages
Neutral
Moving Averages
Neutral
Displays a symbol's price movements over previous years to identify recurring trends.
Frequently asked questions
The current price of Chainbase / Tether USD (C) is 0.1129 USDT — it hasn't changed in the past 24 hours. Try placing this info into the context by checking out what coins are also gaining and losing at the moment and seeing C price chart.
Chainbase / Tether USD (C) reached its highest price on Dec 26, 2025 — it amounted to 21.0000 USDT. Find more insights on the C price chart.
See the list of crypto gainers and choose what best fits your strategy.
Chainbase / Tether USD (C) reached the lowest price of 0.0031 USDT on May 2, 2026. View more Chainbase / Tether USD dynamics on the price chart.
See the list of crypto losers to find unexpected opportunities.
The safest choice when buying C is to go to a well-known crypto exchange. Some of the popular names are Binance, Coinbase, Kraken. But you'll have to find a reliable broker and create an account first. You can trade C right from TradingView charts — just choose a broker and connect to your account.
Crypto markets are famous for their volatility, so one should study all the available stats before adding crypto assets to their portfolio. Very often it's technical analysis that comes in handy. We prepared technical ratings for Chainbase / Tether USD (C): today its technical analysis shows the buy signal, and according to the 1 week rating C shows the buy signal. And you'd better dig deeper and study 1 month rating too — it's buy. Find inspiration in Chainbase / Tether USD trading ideas and keep track of what's moving crypto markets with our crypto news feed.
You can discuss Chainbase / Tether USD (C) with other users in our public chats, Minds or in the comments to Ideas.