Chainbase C/USDT - Critical Decision Zone, Breakout or Breakdown📊 Technical Analysis — C/USDT
⏳ Time Frame: 2D
💰 Current Price: Around 0.0581 USDT
📐 Key Structure: Descending Trendline + Horizontal Demand Zone
🟨 Demand Zone: 0.055 – 0.047 USDT
---
📐 Pattern Formation
The chart shows a long-term Descending Triangle structure formed by:
🔻 Descending Trendline — Price continues to form lower highs and remains under pressure from the descending trendline that has been developing since mid-2025.
🟨 Horizontal Demand Zone at 0.055–0.047 — This area acts as a m
In-depth trading ideas
C USDT LONG SIGNAL#27. C /USDT – Trade Setup (LONG)
📈 Position Type: LONG
🕒 Timeframe: 1H
📊 Market: Futures
💰 Entry Zone:
0.05815
0.05660
🛑 Stop-Loss:
0.05550
🎯 Take-Profit Targets:
• TP1: 0.05952
• TP2: 0.06185
• TP3: 0.06448
• TP4. 0.06729
Tp5.
⚙️ Leverage:
5*
▫️ After TP1, move SL to Entry + 0.2%.
▪️ Exit Plan:
• 40% at TP1
• 20% at TP2
• 20% at TP3
20% at TP4
📌 Risk Management:
Risk only 1–2% of your capital per trade.
⚠️ Always check and confirm the setup on your chart before entering
C USDT LONG SIGNAL#27. C /USDT – Trade Setup (LONG)
📈 Position Type: LONG
🕒 Timeframe: 1H
📊 Market: Futures
💰 Entry Zone:
0.05815
0.05660
🛑 Stop-Loss:
0.05550
🎯 Take-Profit Targets:
• TP1: 0.05952
• TP2: 0.06185
• TP3: 0.06448
• TP4. 0.06729
Tp5.
⚙️ Leverage:
5*
▫️ After TP1, move SL to Entry + 0.2%.
▪️ Exit Plan:
• 40% at TP1
• 20% at TP2
• 20% at TP3
20% at TP4
📌 Risk Management:
Risk only 1–2% of your capital per trade.
⚠️ Always check and confirm the setup on your chart before entering
CUSDT: Bullish Breakout Holds – Can Buyers Push Higher?CUSDT has broken out of its recent consolidation range and is now holding above former resistance, signaling growing bullish momentum. Buyers continue to defend the breakout area, keeping the short-term trend positive.
As long as 0.06550 holds as support, the bullish outlook remains valid. A sustained move higher could drive the price toward 0.06872, while a break below support would invalidate the setup.
Trade Setup
Entry: 0.06616
Target: 0.06872
Stop Loss: 0.06550
I'll wait for continued b
C USDT LONG SIGNAL#41. C/USDT – Trade Setup (LONG)
📈 Position Type: LONG
🕒 Timeframe: 1 H
📊 Market: Futures
💰 Entry Zone:
0.06749
🛑 Stop-Loss:
0.065
🎯 Take-Profit Targets:
• TP1: 0.06892
• TP2: 0.07026
• TP3: 0.07159
• TP4: 0.07323
TP5: 0.07461.
TP6: 0.07620
⚙️ Leverage:
5- 10
⚠️ After reaching TP1, move Stop-Loss to Entry Price.
📌 Risk Management:
Risk only 1–2% of your capital per trade.
Always confirm the setup on your chart before entry
$CUSDT Respecting HTF Structure While Liquidity BuildsBINANCE:CUSDT Respecting HTF Structure While Liquidity Builds 👀
CUSDT continues holding above the rising HTF trendline while price compresses between major demand and premium resistance. The recent rejection from the 0.098–0.100 supply zone slowed momentum, but sellers still failed to break the broader bullish structure. Current price action looks more like controlled consolidation than aggressive bearish continuation.
The main area to watch now is the 0.084–0.078 demand region. That zone ali
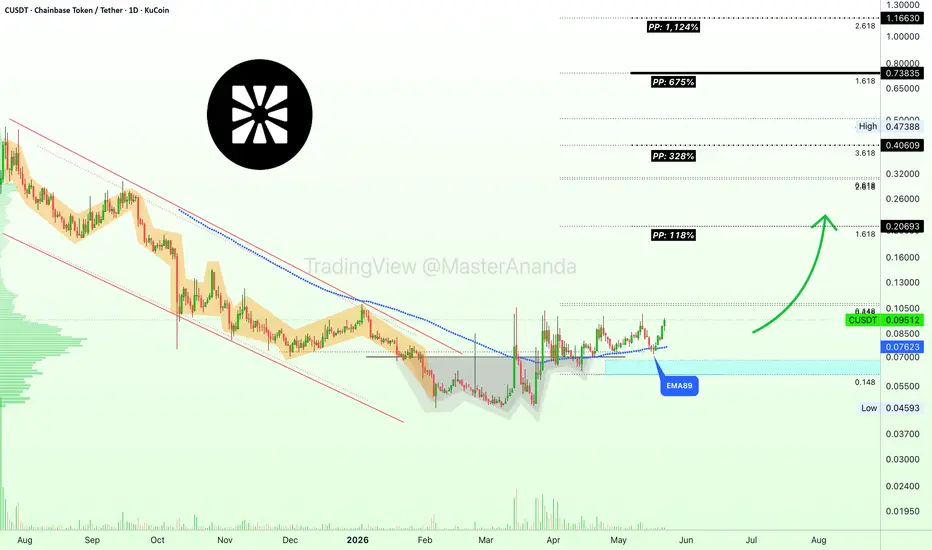
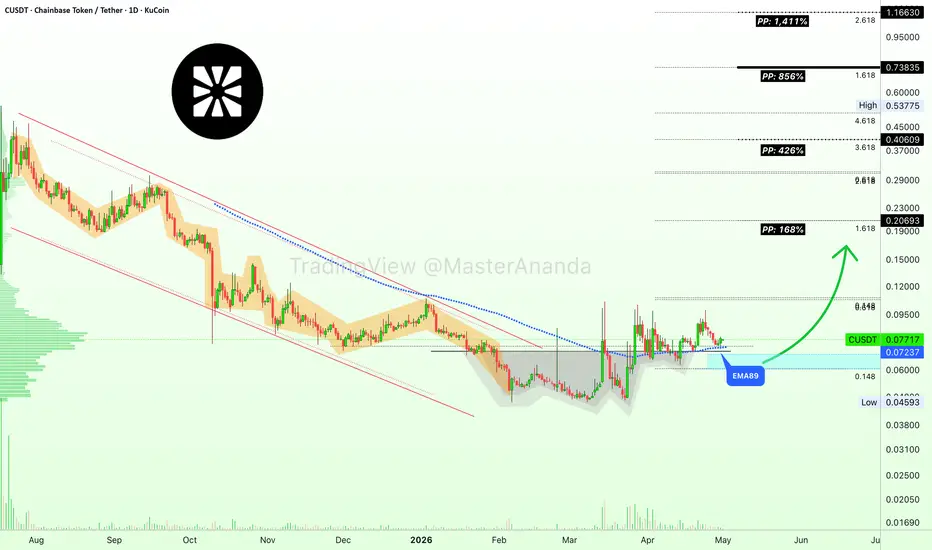
Chainbase (CUSDT) Bullish Consolidation, Easy 100-200% Fast JumpGood afternoon my fellow Cryptocurrency trader, I hope you are having a wonderful day.
CUSDT (Chainbase)—I shared multiple times for you in the past three months. This is another one with a very strong chart. The slowly rising prices, ascending channel above EMA89, is nothing more than bullish consolidation. Consolidation can happen with an upward bent or a downward bent, here it is upward and this reveals strength.
This is a strong build-up process that tends to finish with a very strong adva
$C is pressing directly against the key $0.10 resistance zone. $C is pressing directly against the key $0.10 resistance zone. A confirmed daily breakout above $0.10 followed by a successful retest and hold as support would validate the bullish setup and could trigger a strong rally toward the $0.18 region 🚀
Chainbase Token (CUSDT), Highly profitable: More than 1,111% PPChainbase (CUSDT) flipped EMA89 in late March and has been trading above this level since, once resistance now turned support.
We've been looking at many projects that are accumulating at very low prices, near their all-time low and this we consider a desirable situation, we read these charts as bullish. You know I call it the "extreme opportunity buy-zone."
The problem with accumulation at bottom prices are few but significant. A project can continue to consolidate for longer than we are able
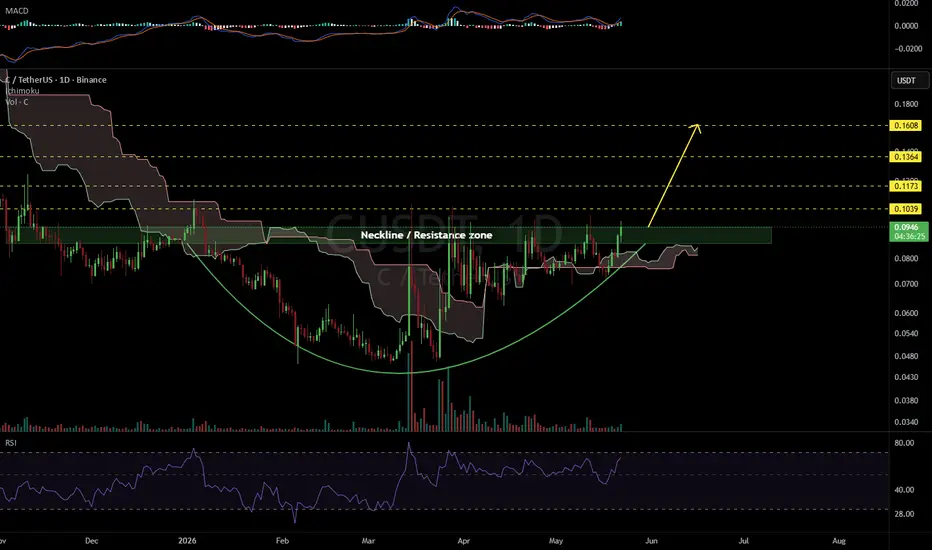
CUSDT 1D#C has formed a rounding bottom pattern on the daily chart and is trading above the Ichimoku cloud. In case of a breakout above the neckline of the pattern, the potential upside targets are:
🎯 $0.1039
🎯 $0.1173
🎯 $0.1364
🎯 $0.1608
⚠️ Always use a tight stop-loss and maintain proper risk management.
CUSDT — Quiet Accumulation Before Expansion?March 27, 2026
🚀 CUSDT — Quiet Accumulation Before Expansion?
CUSDT is positioning within the microcap rotation narrative, where capital often flows once major sectors begin to slow down.
These environments tend to reward patience — with sharp upside once momentum kicks in.
🧠 Stage 1 (Minervini Perspective)
CUSDT is developing a classic Stage 1 base:
✔ Downtrend → exhausted
✔ Price stabilization → ongoing
✔ Accumulation range → established
✔ Early reaction → visible
Price has been compres
Chainbase (CUSDT) Bottom Process & Recovery CompleteChainbase has an interesting chart setup with repeating dates, repeating patterns and a chart that implies the altcoins market is transitioning toward a bullish period.
CUSDT. First a downtrend that ends 6-February 2026. The bottom range is first activated 19-January. Only in late March does CUSDT manages to move back above water.
While trading at the bottom, there were several attempts to move above EMA89. 24-Feb with a strong rejection, the session ended with a long wick. 14-March closed abo
C/USDT (1H) – Trendline Breakout & Demand Zone RetestThis setup presents a potential spot long opportunity on the 1-hour timeframe, supported by multiple technical factors aligning at a key area of interest.
Technical Logic:
Trendline Breakout: Price has successfully broken above the major descending trendline that had been capping upside momentum, indicating a potential shift in market structure.
Volume Profile Confluence: The breakout is supported by a strong demand zone (purple box) perfectly aligned with the Point of Control (POC) on
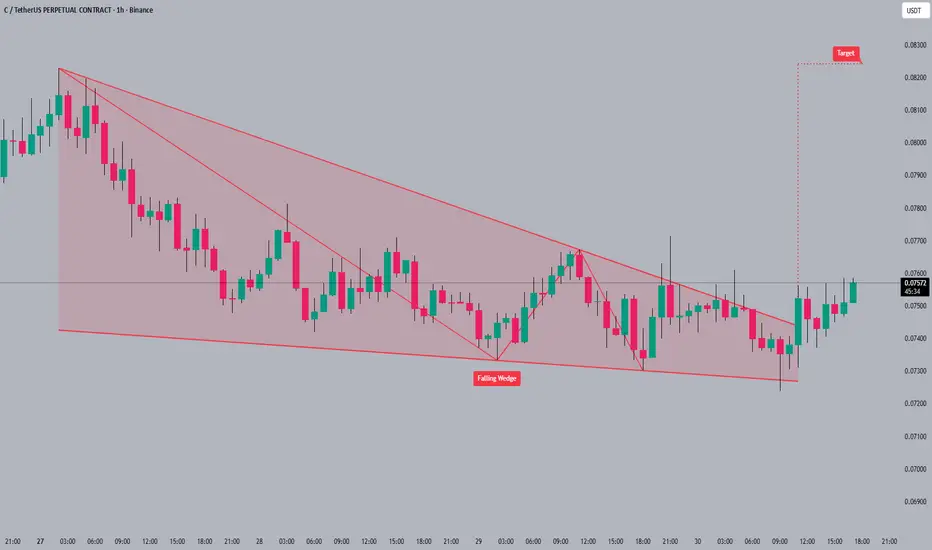
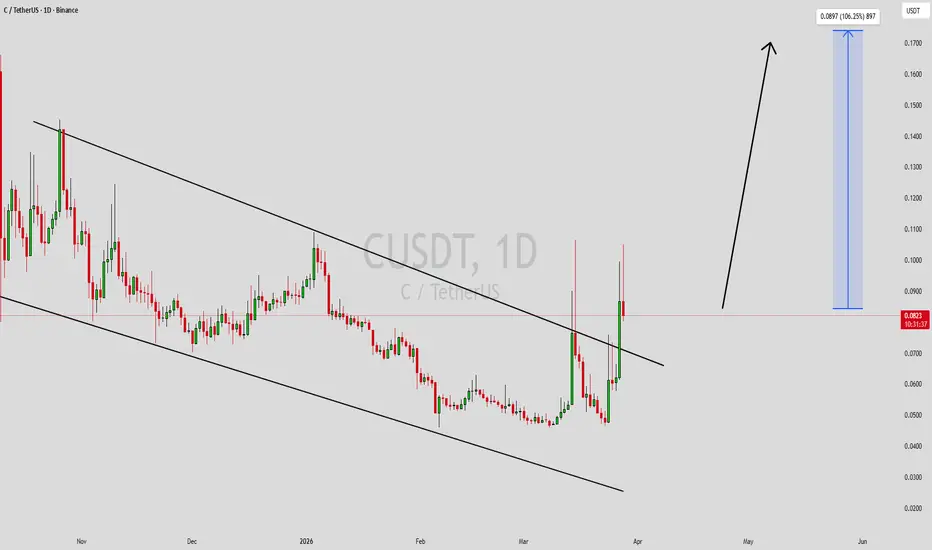
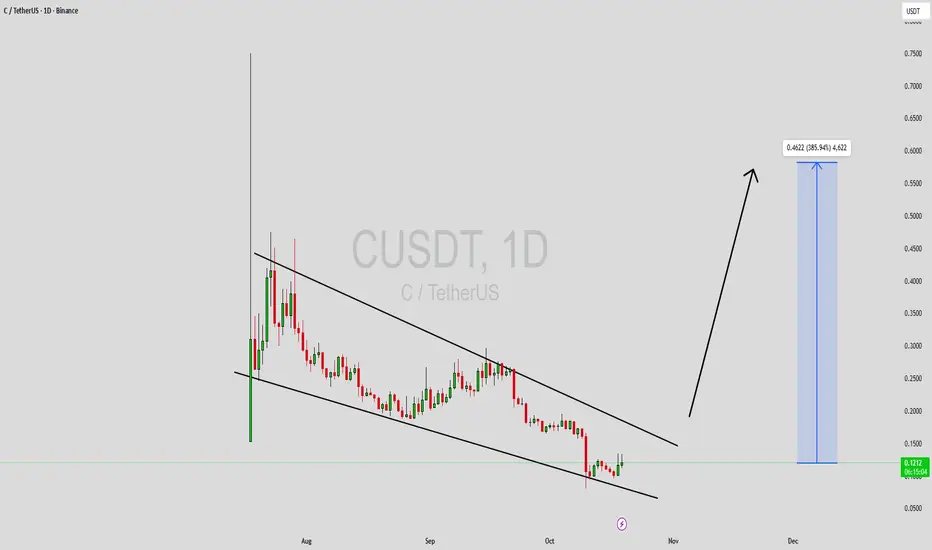
CUSDT Forming Falling WedgeCUSDT is forming a clear falling wedge pattern, a classic bullish reversal signal that often indicates an upcoming breakout. The price has been consolidating within a narrowing range, suggesting that selling pressure is weakening while buyers are beginning to regain control. With consistent volume confirming accumulation at lower levels, the setup hints at a potential bullish breakout soon. The projected move could lead to an impressive gain of around 90% to 100% once the price breaks above the
#COIN
The price is currently consolidating at the bottom of a falling wedge pattern 📉. The falling wedge pattern suggests a potential bullish reversal 🐂. The next target after a breakout from the wedge is approximately 0.07800 🎯.
A breakout from a falling wedge is a high probability setup that can lead to quick gains 📈.
#COIN #crypto #trading #patterns
CUSDT 1D#C is trading within a falling wedge pattern on the daily timeframe. Enter this coin only if it breaks above both the wedge resistance and the daily EMA50. In that scenario, the potential targets are:
🎯 $0.0823
🎯 $0.1018
🎯 $0.1175
🎯 $0.1332
🎯 $0.1557
🎯 $0.1842
⚠️ Always use tight stop-losses and maintain strict risk management.
CUSDT Forming Falling WedgeCUSDT is forming a clear falling wedge pattern, a classic bullish reversal signal that often indicates an upcoming breakout. The price has been consolidating within a narrowing range, suggesting that selling pressure is weakening while buyers are beginning to regain control. With consistent volume confirming accumulation at lower levels, the setup hints at a potential bullish breakout soon. The projected move could lead to an impressive gain of around 50% to 60% once the price breaks above the w
CUSDT Forming Falling WedgeCUSDT is currently developing a falling wedge pattern, a strong bullish indicator that often precedes explosive upward movements. This formation suggests that the recent downtrend may be nearing its end as selling momentum weakens and buyers begin to accumulate positions. The good volume activity adds further strength to this setup, signaling that investor interest is growing rapidly. If the breakout confirms above the wedge resistance, CUSDT could potentially deliver a massive gain of 300% to 3
CUSDT 12H#C has formed a Rounding Bottom pattern on the 12H timeframe chart. It may retest the support level of 🛡 $0.2418 before the next leg up. In case of a successful bounce and a breakout above the resistance zone, the potential targets are:
🎯 $0.3020
🎯 $0.3289
🎯 $0.3672
🎯 $0.4160
⚠️ Always remember to use a tight stop-loss and follow proper risk management.