CVXUSDT 1D#CVX has broken above the neckline of the an inverse Head & Shoulders pattern on the daily timeframe, and the retest is currently in progress. The 50-day EMA is also acting as a key support level, reinforcing the bullish structure. If the price successfully bounces from this support zone, the potential upside targets are:
๐ฏ $1.490
๐ฏ $1.608
๐ฏ $1.757
โ ๏ธ Always use a tight stop-loss and apply proper risk management.
Convex Finance/USD Tether Spot
No trades
No trades
In-depth trading ideas
๏ปฟCVXUSDT - Descending TrendLine โ Breakout or Another Rejection?๐๐ Technical Analysis
๐ต Coin: NYSE:CVX #CVX
โณ Time Frame: 2D
๐ Pattern: Descending TrendLine (Long-Term Resistance)
๐ CVXUSDT is still trading below a long-term Descending TrendLine that has been suppressing price action for nearly a year. This trendline has repeatedly acted as a dynamic resistance, triggering multiple rejections and making it one of the most critical technical levels to watch.
๐ The price is now approaching this resistance after rebounding from its recent lows. The market's reaction around this trendline will likely determine the next major direction.
---
๐๐ Pattern Overview
๐ป Descending TrendLine
๐ The chart continues to form a Lower High structure, confirming that sellers have remained in control since the previous peak.
๐ As long as the price stays below the trendline, the bearish trend remains dominant.
๐ A valid breakout requires:
โ
A confirmed candle close above the trendline.
๐ Strong buying volume.
๐ฅ Sufficient bullish momentum to avoid a false breakout.
---
๐ Horizontal Resistance Levels
๐ฏ If the trendline is successfully broken, the price will face several key resistance zones that could act as profit-taking or consolidation areas.
๐ก Resistance 1: 1.615 USDT
๐ก Resistance 2: 1.920 USDT
๐ก Resistance 3: 2.080 USDT
๐ก Resistance 4: 2.300 USDT
โ ๏ธ Each resistance level may trigger temporary pullbacks before any continued upward movement.
---
๐ข๐ Bullish Scenario (Breakout Confirmation)
โ
If CVX breaks above the Descending TrendLine and closes above it, this could signal the beginning of a bullish momentum shift.
๐ Such a breakout may also invalidate the long-standing Lower High structure.
๐ฏ Potential bullish targets:
๐ 1.615 USDT
๐ 1.920 USDT
๐ 2.080 USDT
๐ 2.300 USDT
๐ก The stronger the breakout volume, the higher the probability of a trend reversal toward a new bullish phase.
---
๐ด๐ Bearish Scenario (Trendline Rejection)
โ ๏ธ If the price fails to break above the Descending TrendLine and experiences another strong rejection, sellers are likely to remain in control.
๐ In this scenario, CVX could:
๐ป Continue forming Lower Highs.
๐ป Retest the recent support zone.
๐ป Extend its downtrend if selling pressure increases.
๐จ As long as the primary resistance remains intact, the bearish trend continues to be the dominant scenario.
---
๐โจ Conclusion
โก CVXUSDT is currently trading in a critical decision zone.
๐ข Bullish: A confirmed breakout above the Descending TrendLine could open the path toward the 1.615โ2.300 USDT resistance range.
๐ด Bearish: A rejection from the trendline would preserve the current bearish structure and increase the probability of another downside move.
๐ Price action around this trendline will be the key factor in determining CVX's next major trend over the coming weeks.
๐ Always wait for a confirmed breakout or rejection before making any trading decisions.
---
#CVX #CVXUSDT #Crypto #Cryptocurrency #TechnicalAnalysis #TradingView #PriceAction #Altcoins #DescendingTrendLine #TrendlineBreakout #Breakout #Resistance #Support #Bullish #Bearish #TrendReversal #Binance #CryptoTrading #MarketAnalysis #TradingSignals
#CVXUSDT : Long-Term Breakout Signals Massive Upside Potentia#CVX
The price is moving within a descending channel on the 1-hour timeframe and has reached the lower boundary. It is now poised for a bounce and is expected to retest this boundary.
The Relative Strength Index (RSI) indicates a downward trend, which is likely to continue given the overbought conditions.
A key support zone (in green) has been identified at 1.10. The price has bounced off this zone several times, making it a strong support level.
The price is trending towards the 100-period moving average, which we are approaching. This trend supports an upward move.
Entry Price: 1.22
First Target: 1.25
Second Target: 1.28
Third Target: 1.31
You can close at the second target or wait for the third target. The choice is yours.
Stop Loss: At the resistance zone (in green).
Remember this simple rule: Money Management.
Any questions? Please leave a comment.
Thank you.
#CVXUSDT : Long-Term Breakout Signals Massive Upside Potentia#CVX
The price is moving within a descending channel on the 1-hour timeframe and has reached the lower boundary. It is now poised for a bounce and is expected to retest this boundary.
The Relative Strength Index (RSI) indicates a downward trend, which is likely to continue given the overbought conditions.
A key support zone (in green) has been identified at 1.09. The price has bounced off this zone several times, making it a strong support level.
The price is trending towards the 100-period moving average, which we are approaching. This trend supports an upward move.
Entry Price: 1.20
Target 1: 1.27
Target 2: 1.23
Target 3: 1.31
You can close at the second target or wait for the third target to be reached. The choice is yours.
Stop Loss: At the resistance zone (in green).
Remember this simple rule: Money Management.
Any questions? Please leave a comment.
Thank you.
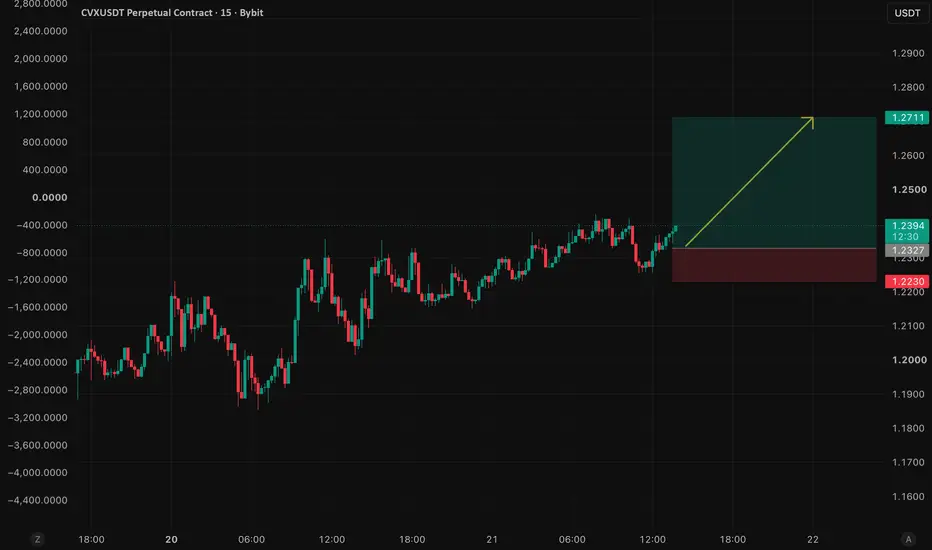
CVXUSDT: Higher Lows Point to Bullish ContinuationCVXUSDT continues to print higher lows, showing that buyers remain in control after the recent recovery. The price is holding above a key support zone, keeping the short-term bullish structure intact.
As long as 1.2230 holds, the path toward 1.2711 remains valid. A breakout above the recent swing high could accelerate bullish momentum.
Trade Setup
Entry: 1.2327
Target: 1.2711
Stop Loss: 1.2230
I'm watching for increasing buying volume and a confirmed breakout to validate the next move higher.
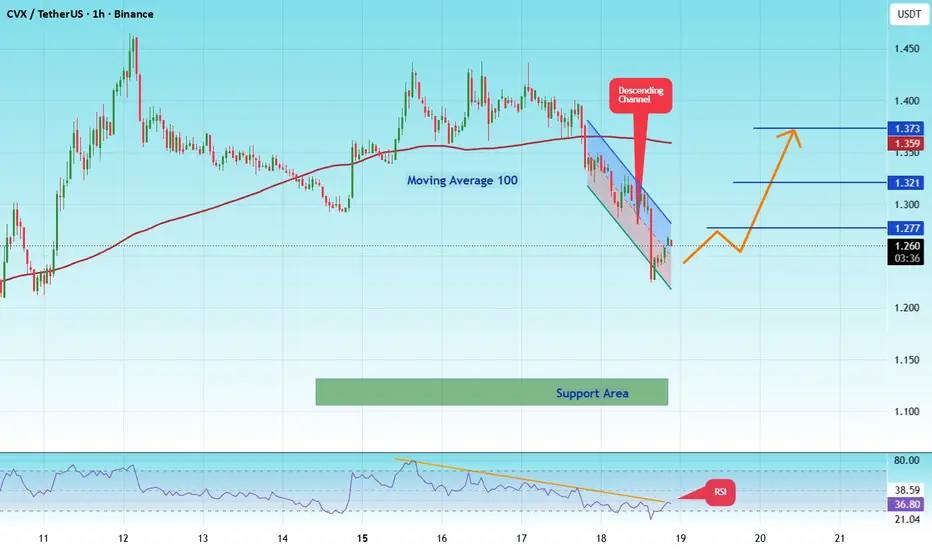
#CVXUSDT : Long-Term Breakout Signals Massive Upside Potentia#CVX
The price is moving within a descending channel on the 1-hour timeframe and has reached the lower boundary. It is now poised for a bounce and is expected to retest this boundary.
The Relative Strength Index (RSI) indicates a downward trend, which is likely to continue given the overbought conditions.
A key support zone (in green) has been identified at 1.10. The price has bounced off this zone several times, making it a strong support level.
The price is trending towards the 100-period moving average, which we are approaching. This trend supports an upward move.
Entry Price: 1.23
Target 1: 1.27
Target 2: 1.32
Target 3: 1.37
You can close at the 2nd target or wait for the 3rd target. The choice is yours.
Stop Loss: At the resistance zone (in green).
Remember this simple rule: Money Management.
Any questions? Please leave a comment.
Thank you.
#CVXUSDT : Long-Term Breakout Signals Massive Upside Potentia#CVX
The price is moving within a descending channel on the 1-hour timeframe and has reached the lower boundary. It is now poised for a bounce and is expected to retest this boundary.
The Relative Strength Index (RSI) indicates a downward trend, which is likely to continue given the overbought conditions.
There is a key support zone (in green) at 1.02, and the price has bounced off this zone several times, making it a strong support level.
The price is trending towards the 100-period moving average, which we are approaching. This trend supports an upward move.
Entry Price: 1.09
Target 1: 1.11
Target 2: 1.14
Target 3: 1.16
Stop Loss: At the resistance zone (in green)
Remember this simple rule: Money Management.
Any questions? Please leave a comment.
Thank you.
#CVXUSDT : Long-Term Breakout Signals Massive Upside Potentia#CVX
The price is moving within a descending channel on the 1-hour timeframe and has reached the lower boundary. It is now poised for a bounce and is expected to retest this boundary.
The Relative Strength Index (RSI) indicates a downward trend, which is likely to continue given the overbought conditions.
There is a key support zone (in green) at 1.18, and the price has bounced off this zone several times, making it a strong support level.
The price is trending towards the 100-period moving average, which we are approaching. This trend supports an upward move.
Entry Price: 1.34
Target 1: 1.36
Target 2: 1.39
Target 3: 1.42
Stop Loss: At the resistance zone (in green)
Remember this simple rule: Money Management.
Any questions? Please leave a comment.
Thank you.
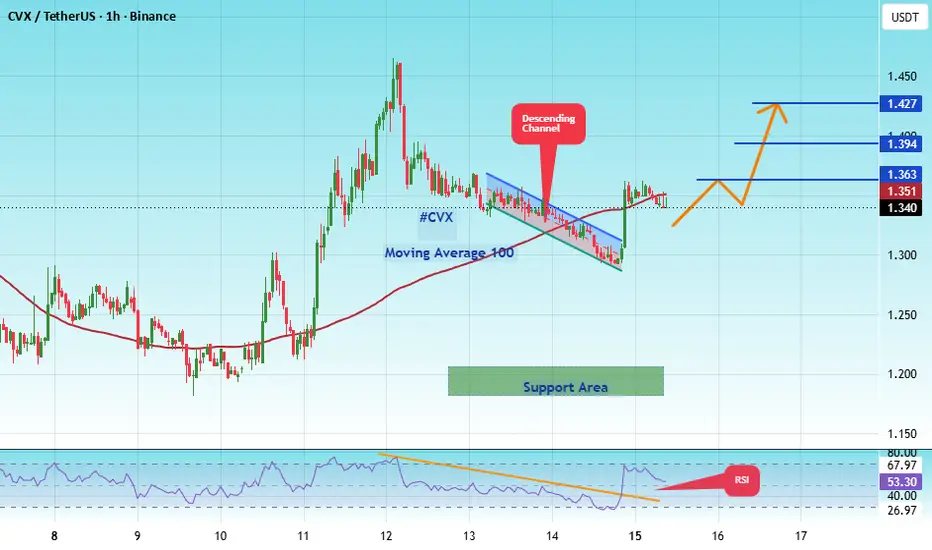
#CVXUSDT chart (1-hour timeframe)#CVX
The price is moving within a descending channel on the 1-hour timeframe and has reached the lower boundary. It is now poised for a bounce and is expected to retest this boundary.
The Relative Strength Index (RSI) indicates a downward trend, which is likely to continue given the overbought conditions.
There is a key support zone (in green) at 1.10, and the price has bounced off this zone several times, making it a strong support level.
The price is trending towards the 100-period moving average, which we are approaching. This trend supports an upward move.
Entry Price: 1.23
Target 1: 1.27
Target 2: 1.31
Target 3: 1.36
Stop Loss: At the resistance zone (in green)
Remember this simple rule: Money Management.
Any questions? Please leave a comment.
Thank you.
#CVXUSDT : Long-Term Breakout Signals Massive Upside Potentia#CVX
The price is moving within a descending channel on the 1-hour timeframe and has reached the lower boundary. It is now poised for a bounce and is expected to retest this boundary.
The Relative Strength Index (RSI) indicates a downward trend, which is likely to continue given the overbought conditions.
There is a key support zone (in green) at 1.44, and the price has bounced off this zone several times, making it a strong support level.
The price is trending towards the 100-period moving average, which we are approaching. This trend supports an upward move.
Entry Price: 1.49
First Target: 1.52
Second Target: 1.557
Third Target: 1.60
You can stop at the first and second targets and close the price, or continue towards the third target. Stop Loss: At the resistance zone (in green).
Remember this simple rule: Money Management.
Any questions? Please leave a comment.
Thank you.
#CVXUSDT : Long-Term Breakout Signals Massive Upside Potentia#CVX
The price is moving within a descending channel on the hourly timeframe. It has reached the lower boundary and is trending towards a bounce. A retest of this boundary is expected.
The Relative Strength Index (RSI) indicates a downward trend, and this trend is likely to continue due to the overbought condition.
A key support zone (in green) has been identified at 1.56. The price has bounced off this zone several times, making it a strong support level.
The price is trending towards the 100-period moving average, which we are approaching. This trend supports an upward move.
Entry Price: 1.70
Target 1: 1.73
Target 2: 1.76
Target 3: 1.80
You can close at the second target or wait for the third target to be reached. The choice is yours.
Stop Loss: At the resistance zone (in green).
Remember this simple rule: Money Management.
Any questions? Please leave a comment.
Thank you.
Convex Finance (CVX) Can Grow 5,000% ยท Remember 2021This is another project that I've been tracking and we can take it as a trading opportunity and also to show the altcoins market is no longer bearish, turning bullish.
The bottom process here is more pronounced compared to other projects. Convex Finance (CVXUSDT) has been consolidating within the same support range since mid-November 2025. This same support range was also activated in February, March and April of that same year, 2025. Then again September, October and November 2024, making this a very strong support zone.
Just now, this week, the action is moving away from the zone that I have highlighted orange to the blue one. This zone would mean better conditions and no more an extreme opportunity buy which is what was happening in the orange space.
The latest bottom range has been active for at least 6 months; overall, this same range has been active for several years.
What will be the reaction when we see this project growing 3,000 to 5,000%?
I wonder... It is going to happen, a sideways range has been active for almost four years. We've seen how fast everything changes and also how strongly some crypto projects can grow in a matter of days.
Ok. CVXUSDT is trading at bottom and is ready to change course. Each time the current support zone gets a challenge the market replies with a bullish jump. The same with resistance. Whenever resistance gets challenged there is a drop. There are strong differences though between resistance and support.
First, we have long-term lower highs. At resistance, we get a close one week and the next week starts the sell-off and a major down-wave. At support, we are seeing a long-term accumulation process. This process is what I am using to predict that next time resistance will break.
The people buying the coins at low prices are likely the ones ready to hold long-term. Like those Bitcoin holders from years ago... Something like this can be happening across hundreds of altcoins. Long-term accumulation at the bottom. Then we will read the stories about all the millionaires that were created through patience when the next bull market reaches new all-time highs.
Everything is looking great. I love this market, love Crypto, love to write and to share.
Thank you for reading by the way, your continued support is highly appreciated.
I hope you enjoy the content. Something good might happen and it is just for entertainment... Remember 2021.
Namaste.
#CVX/USDT : Long-Term Breakout Signals Massive Upside Potentia#CVX
The price is moving within a descending channel on the 1-hour timeframe and has reached the lower boundary. It is now poised for a bounce and is expected to retest this boundary.
The Relative Strength Index (RSI) indicates a downward trend, which is likely to continue given the overbought conditions.
There is a key support zone (in green) at 1.63, and the price has bounced off this zone several times, making it a strong support level.
The price is trending towards the 100-period moving average, which we are approaching. This trend supports an upward move.
Entry Price: 1.755
First Target: 1.78
Second Target: 1.83
Third Target: 1.88
You can stop at the first and second targets and close the price, or continue towards the third target. Stop Loss: At the resistance zone (in green).
Remember this simple rule: Money Management.
Any questions? Please leave a comment.
Thank you.
CVXUSDT - Massive Breakout? Bullish Momentum Is Starting?CVX/USDT on the 2D timeframe is currently in a consolidation phase after experiencing a prolonged bearish pressure. The price continues to move below the main descending trendline, which has acted as a dynamic resistance since mid-2025. ๐
However, selling pressure appears to be weakening, and the price is now moving tighter near the lower support area while approaching the end of the trendline. Structures like this often become an early sign of a major breakout if resistance is successfully broken. โก๐
๐ Pattern Formation ๐โก๏ธ๐
This chart shows indications of:
๐ธ Descending Triangle / Falling Resistance Structure
๐ธ Price continues forming lower highs below the descending trendline
๐ธ Horizontal support area remains strong enough to hold the downside
๐ธ Volatility is decreasing, which usually signals a major move ahead ๐
The yellow trendline is the key level that will determine the next major direction. ๐ก
---
๐ข Bullish Scenario ๐
If the price successfully breaks out and closes strongly above the descending trendline along with the 1.90 USDT resistance area, bullish momentum could begin to develop. ๐
๐ฏ Next upside targets:
โ
2.32 USDT
โ
2.85 USDT
โ
3.73 USDT
A valid breakout could trigger:
๐ฅ Short squeeze
๐ฅ Increased trading volume
๐ฅ Market structure shift into bullish territory
The stronger the breakout volume, the higher the probability of reaching the upper targets. ๐โก
---
๐ด Bearish Scenario ๐
As long as the price remains below the resistance trendline, CVX is still technically under bearish pressure. โ ๏ธ
The bearish scenario becomes active if:
โ Price fails to break out
โ Faces rejection around the 1.90 USDT area
โ Breaks down below the lower support zone around 1.50โ1.60 USDT
If that support level is lost, the price could continue declining and print new lows. ๐๐ฅ
---
๐ Conclusion
CVXUSDT is currently sitting in a crucial zone and approaching a major decision point. The descending trendline remains the primary resistance that must be broken for bullish momentum to fully return. ๐๐
As long as the lower support holds, rebound and recovery potential still remains open. However, traders should stay cautious of fake breakouts and strong rejections around resistance zones. โ ๏ธ
Charts like this are often worth monitoring closely because massive price movements can emerge once a long consolidation phase finally ends. ๐๐ฅ
#CVX #CVXUSDT #Crypto #Cryptocurrency #Trading #TechnicalAnalysis #Altcoin #Bullish #Bearish #Breakout #CryptoTrading #SupportResistance #ChartAnalysis #Altcoins #CryptoMarket
#CVX/USDT : Long-Term Breakout Signals Massive Upside Potentia#CVX
The price is moving within a descending channel on the hourly timeframe. It has reached the lower boundary and is trending towards a bounce. A retest of this boundary is expected.
The Relative Strength Index (RSI) indicates a downward trend, and this trend is likely to continue due to the overbought condition.
A key support zone (in green) was found at 1.68, and the price has bounced off this zone several times, making it a strong support level.
The price is trending towards the 100-period moving average, which we are approaching. This trend supports an upward move.
Entry Price: 1.76
First Target: 1.80
Second Target: 1.84
Third Target: 1.89
You can close at the second target or wait for the third target to be reached. The choice is yours.
Stop Loss: At the resistance zone (in green).
Remember this simple rule: Money Management.
Any questions? Please leave a comment.
Thank you.
#CVX/USDT : Long-Term Breakout Signals Massive Upside Potentia#CVX
The price is moving within a descending channel on the 1-hour timeframe and has reached the lower boundary. It is now poised for a bounce and is expected to retest this boundary.
The Relative Strength Index (RSI) indicates a downward trend, which is likely to continue given the overbought conditions.
There is a key support zone in green at 1.71, and the price has bounced off this zone several times, making it a strong support level.
The price is trending towards the 100-period moving average, which we are approaching. This trend supports an upward move.
Entry Price: 1.77
Target 1: 1.80
Target 2: 1.83
Target 3: 1.87
You can stop at the first and second targets and close the position, or continue towards the third target.
Stop Loss: At the resistance zone in green.
Remember this simple rule: Money Management.
Any questions? Please leave a comment.
Thank you.
#CVX/USDT : Long-Term Breakout Signals Massive Upside Potentia#CVX
The price is moving within a descending channel on the hourly timeframe. It has reached the lower boundary and is trending towards a bounce. A retest of this boundary is expected.
The Relative Strength Index (RSI) indicates a downward trend, and this trend is likely to continue due to the overbought condition.
There is a key support zone in green at 1.77, and the price has bounced off this zone several times, making it a strong support level.
The price is trending towards the 100-period moving average, which we are approaching. This trend supports an upward move.
Entry Price: 1.82
Target 1: 1.86
Target 2: 1.90
Target 3: 1.96
Stop Loss: At the resistance zone in green
Remember this simple rule: Money management.
Any questions, please leave a comment.
Thank you.
#CVXUSDT : Long-Term Breakout Signals Massive Upside Potentia#CVX
The price is moving within a descending channel on the 4-hour timeframe. It has reached the lower boundary and is heading for a bounce. A retest of this boundary is expected.
The Relative Strength Index (RSI) indicates a downward trend, and this trend is likely to continue due to the overbought condition.
There is a key support zone in green at 1.65. The price has bounced off this zone several times, making it a strong support level.
The price is trending towards the 100-period moving average, which we are approaching. This trend supports an upward move.
Entry Price: 1.70
Target 1: 1.75
Target 2: 1.75
Target 3: 1.78
Stop Loss: At the resistance zone in green
Remember this simple rule: Money Management.
Any questions, please leave a comment.
Thank you.
#CVXUSDT โ Short Setup from Key Supply Zone#CVX
The price is moving within a descending channel on the hourly timeframe. It has reached the lower boundary and is trending towards a bounce. A retest of this boundary is expected.
The Relative Strength Index (RSI) indicates a downward trend, and this trend is likely to continue due to the overbought condition.
There is a key support zone in green at 1.64, and the price has bounced off this zone several times, making it a strong support level.
The price is trending towards the 100-period moving average, which we are approaching. This trend supports an upward move.
Entry Price: 1.68
Target 1: 1.70
Target 2: 1.73
Target 3: 1.76
Stop Loss: At the resistance zone in green
Remember this simple rule: Money management.
Any questions, please leave a comment.
Thank you.
#CVXUSDT โ Short Setup from Key Supply Zone#CVX
The price is moving within an ascending channel on the hourly timeframe. It has reached the lower boundary and is heading towards a breakout. A retest of this boundary is expected.
The Relative Strength Index (RSI) indicates a downward trend, and this trend is likely to continue due to the overbought condition.
There is a key resistance zone in green at 1.48, and the price has bounced off it several times, making it a strong support level.
A consolidation trend is observed below the 100-period moving average, which we are approaching. This trend supports a decline towards this level.
Entry Price: 1.75
Target 1: 1.70
Target 2: 1.67
Target 3: 1.62
Stop Loss: At the resistance zone in green.
Remember this simple rule: Manage your money wisely.
For any questions, please leave a comment.
Thank you.
#CVX/USDT : Long-Term Breakout Signals Massive Upside Potentia#CVX
The price is moving within a descending channel on the hourly timeframe. It has reached the lower boundary and is trending towards a bounce. A retest of this boundary is expected.
The Relative Strength Index (RSI) indicates a downward trend, and this trend is likely to continue due to the overbought condition.
There is a key support zone in green at 1.95, and the price has bounced off this zone several times, making it a strong support level.
The price is trending towards the 100-period moving average, which we are approaching. This trend supports an upward move.
Entry Price: 2.00
First Target: 2.06
Second Target: 2.14
Third Target: 2.22
Stop Loss: At the resistance zone in green
Remember this simple rule: Money management.
Any questions, please leave a comment.
Thank you.
#CVX/USDT : Long-Term Breakout Signals Massive Upside Potentia
#CVX
The price is moving within a descending channel on the hourly timeframe. It has reached the lower boundary and is trending towards a bounce. A retest of this boundary is expected.
The Relative Strength Index (RSI) indicates a downward trend, and this trend is likely to continue due to the overbought condition.
There is a key support zone in green at 1.68, and the price has bounced off this zone several times, making it a strong support level.
The price is trending towards the 100-period moving average, which we are approaching. This trend supports an upward move.
Entry Price: 1.73
Target 1: 1.76
Target 2: 1.80
Target 3: 1.86
Stop Loss: At the resistance zone in green
Remember this simple rule: Money management.
Any questions, please leave a comment.
Thank you.