# CVX (Convex Finance) — Key Support & Resistance | Potential # CVX (Convex Finance) — Key Support & Resistance | Potential Breakout Setup
**Convex Finance (CVX)** is a decentralized finance (DeFi) protocol built on Ethereum, designed to optimize liquidity rewards and staking efficiency across platforms such as Curve Finance and Frax Finance.
From a fundamental perspective, CVX plays an important role in the DeFi ecosystem through governance, liquidity incentives and protocol revenue sharing. With a maximum supply of 100 million tokens, CVX provides stak
Convex Finance/USDT
No trades
No trades
In-depth trading ideas
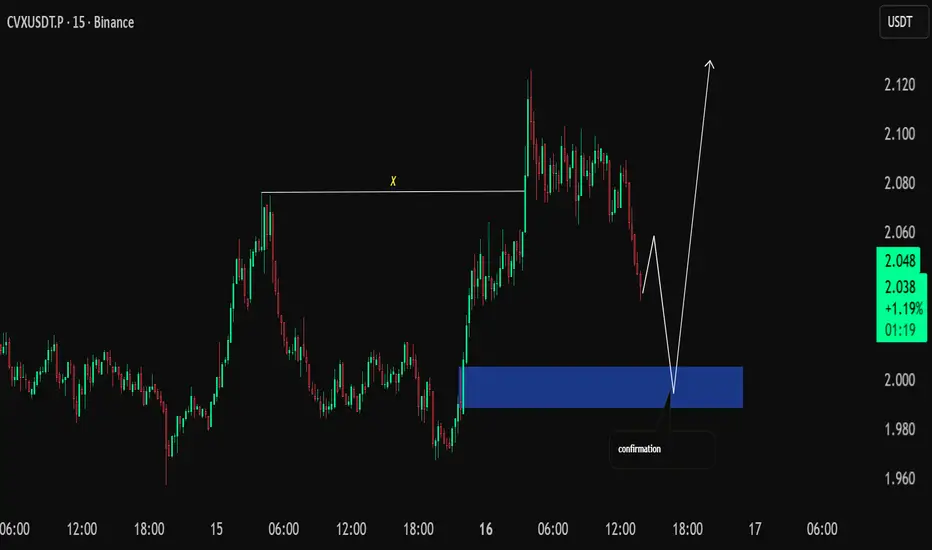
CVXUSDT.P IDEA short 🟠 CVXUSDT.P — Short Setup
Waiting for the reaction candle to close before considering a short entry.
📉 Plan:
1. Wait for the reaction candle to close.
2. Look for a retest of the level.
3. If the setup confirms, consider a short entry.
⚠️ If the structure doesn’t develop as expected, skip the trade. No need to force an entry.
Patience and confirmation over prediction. 🎯
#CVX #CVXUSDT #CryptoTrading #TradingView #ShortSetup #PriceAction #TechnicalAnalysis #DayTrading #Altcoins
CVX: local squeeze with $1.644 destinationCVX has spent the summer carving out a range, bouncing off the $1.12 lows and rotating back toward the middle of the band. Price is now coiling into Equilibrium — the kind of compression that resolves with a directional move.
The Macro Picture 🗺️
The broader structure is a range, not a trend. Macro Resistance caps the top at $2.081 with Local High / Decision just below at $1.961, while Macro Support anchors the base at $1.034. Price has spent weeks oscillating between them rather than picking a
CVXUSDT 1D#CVX has broken above the neckline of the an inverse Head & Shoulders pattern on the daily timeframe, and the retest is currently in progress. The 50-day EMA is also acting as a key support level, reinforcing the bullish structure. If the price successfully bounces from this support zone, the potential upside targets are:
🎯 $1.490
🎯 $1.608
🎯 $1.757
⚠️ Always use a tight stop-loss and apply proper risk management.
CVXUSDT - Descending TrendLine – Breakout or Another Rejection?📊📈 Technical Analysis
💵 Coin: NYSE:CVX #CVX
⏳ Time Frame: 2D
📉 Pattern: Descending TrendLine (Long-Term Resistance)
🔍 CVXUSDT is still trading below a long-term Descending TrendLine that has been suppressing price action for nearly a year. This trendline has repeatedly acted as a dynamic resistance, triggering multiple rejections and making it one of the most critical technical levels to watch.
📍 The price is now approaching this resistance after rebounding from its recent lows. The market'
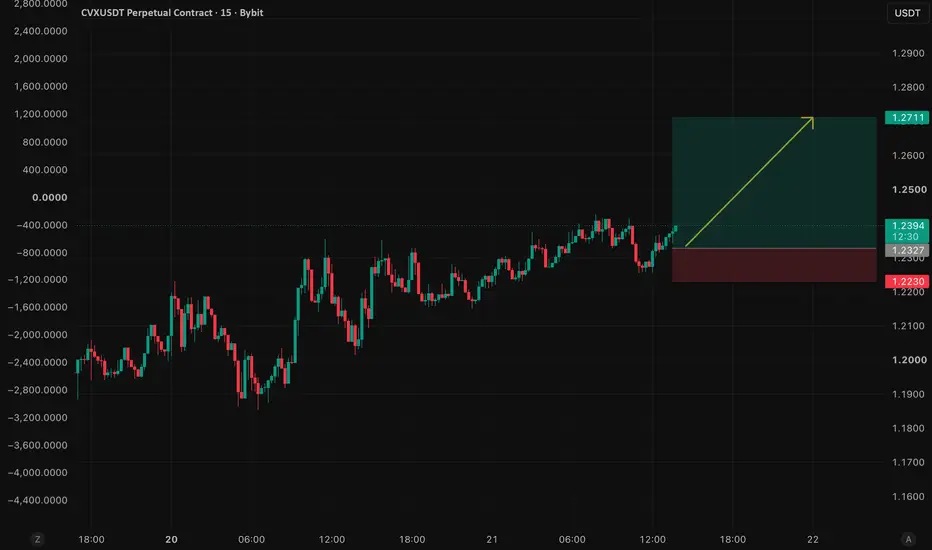
CVXUSDT: Higher Lows Point to Bullish ContinuationCVXUSDT continues to print higher lows, showing that buyers remain in control after the recent recovery. The price is holding above a key support zone, keeping the short-term bullish structure intact.
As long as 1.2230 holds, the path toward 1.2711 remains valid. A breakout above the recent swing high could accelerate bullish momentum.
Trade Setup
Entry: 1.2327
Target: 1.2711
Stop Loss: 1.2230
I'm watching for increasing buying volume and a confirmed breakout to validate the next move higher
Convex Finance (CVX) Can Grow 5,000% · Remember 2021This is another project that I've been tracking and we can take it as a trading opportunity and also to show the altcoins market is no longer bearish, turning bullish.
The bottom process here is more pronounced compared to other projects. Convex Finance (CVXUSDT) has been consolidating within the same support range since mid-November 2025. This same support range was also activated in February, March and April of that same year, 2025. Then again September, October and November 2024, making this
CVXUSDT - Massive Breakout? Bullish Momentum Is Starting?CVX/USDT on the 2D timeframe is currently in a consolidation phase after experiencing a prolonged bearish pressure. The price continues to move below the main descending trendline, which has acted as a dynamic resistance since mid-2025. 📉
However, selling pressure appears to be weakening, and the price is now moving tighter near the lower support area while approaching the end of the trendline. Structures like this often become an early sign of a major breakout if resistance is successfully bro
$CVXUSDT (1H) Price Analysis – Bullish Rebound from Demand ZoneBINANCE:CVXUSDT is currently showing a bullish recovery setup on the 1-hour timeframe as price pulls back into a strong demand zone near $1.77. This area has previously acted as support, indicating renewed buyer interest after the recent correction.
The entry price is around $1.774, with price expected to stabilize above this support zone. As long as CVX holds above the demand area, the bullish structure remains intact. On the upside, the first resistance target is $1.902 (Target One), followe
CVXUSDT 12H#CVX has broken above the descending resistance on the 12H timeframe, but the candle has not closed yet. If the candle closes above the trendline and a successful retest is confirmed, we can expect the following targets:
🎯 $2.657
🎯 $2.918
🎯 $3.288
🎯 $3.761
⚠️ Always apply tight stop-losses and maintain strict risk management.
My cvx playFor my crypto port, instead of crv im gonna make a play on cvx. This is 100% allocation. At this point I'm picking 1 alt and just keeping simple. CRV has massive upside but CVX has 4x the voting power and is below its intrinsic value by a lot while CRV is not. Lastly CVX supply is 100% diluted while CRV still has release of tokens until 3 billion supply. The $55 all time high would require a market cap extremely less probable than CVX hitting my goals. Ty
CVXUSDT 1D#CVX is moving inside a falling wedge pattern on the daily chart. In case of a breakout above the wedge resistance and the daily SMA50, the potential targets are:
🎯 $2.205
🎯 $2.589
🎯 $2.900
🎯 $3.211
🎯 $3.653
🎯 $4.216
❌ Invalidation: a daily candle closing below the wedge.
⚠️ Always remember to use a tight stop-loss and maintain proper risk management.
CVX/USDT 4H AnalysisThe price is forming a round bottom pattern after touching the lower boundary of the descending channel.
Currently showing signs of reversal with increasing volume.
If price breaks above the midline of the channel, a move toward 2.20–2.25 looks likely.
Confirmation: 4H close above 2.00
Targets: 2.20 – 2.25
Support: 1.80
💡 Watching for breakout confirmation and volume continuation before entry.
CVX under 3$ is a good investment.I believe CVX can form a higher low with this trend line acting as support at 3.10.
If BTC continue it's uptrend to $130k and more there's high change it will mark a low on CVX and many others. This will be an opportunity to maybe enter at an interesting price for the beginning of a possible alt season once BTC reach a definitive new all time high for this cycle to close the year.
Thank you.
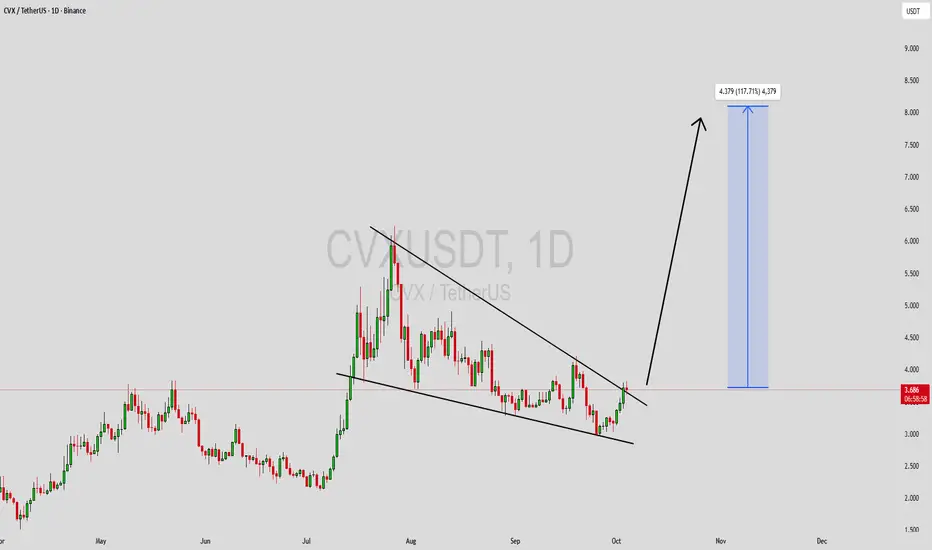
CVXUSDT Forming Falling WedgeCVXUSDT is showing a well-defined falling wedge pattern on the chart — a classic bullish reversal formation that often signals the end of a downtrend and the start of a strong upward move. The price has been consolidating within narrowing trendlines, suggesting that bearish momentum is weakening while buying pressure is gradually increasing. This setup, combined with consistent volume activity, indicates that a breakout could be imminent and may lead to a substantial rally in the coming sessions
CVXUSDT UPDATE#CVX
UPDATE
CVX Technical Setup
Pattern: Bullish falling wedge pattern
Current Price: $0.680
Target Price: $1.225
Target % Gain: 80.32%
NYSE:CVX is breaking out of a falling wedge pattern on the 1D timeframe. Current price is $0.680 with a target near $1.225, indicating around 80% potential upside. The breakout signals renewed bullish momentum with structure favoring continuation toward higher levels. Always use proper risk management.
Time Frame: 1D
Risk Management Tip: Always use proper r
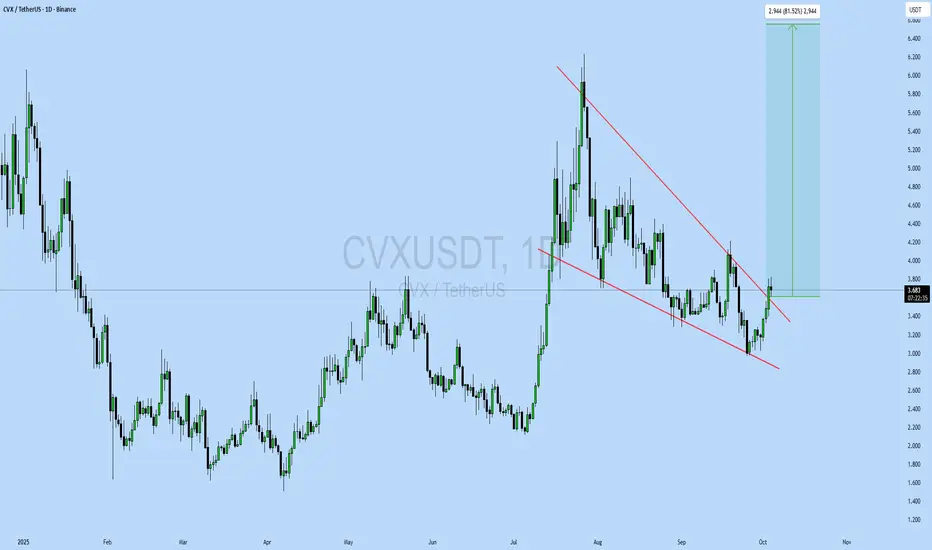
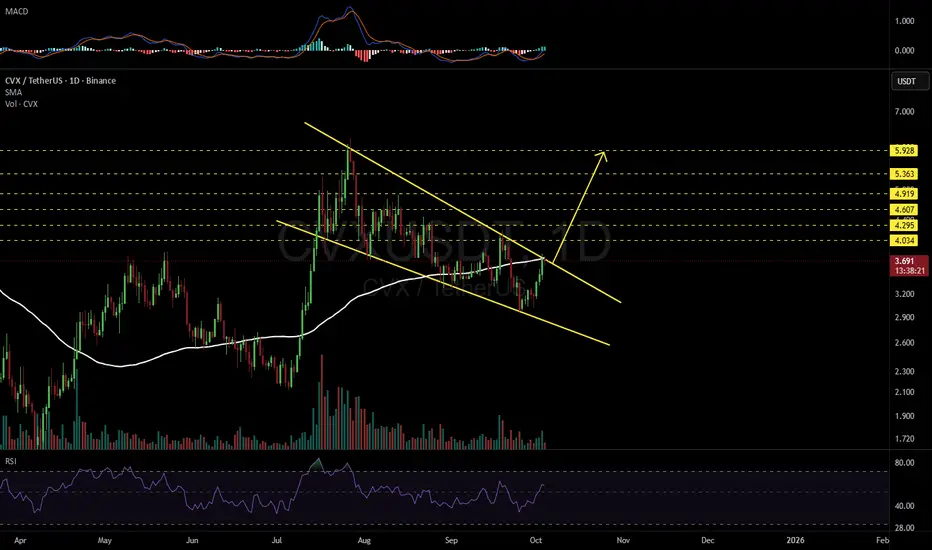
CVXUSDT 1D#CVX is trying to break out above the falling wedge resistance and the SMA100 on the daily chart. Keep an eye on it. In case of a solid breakout, the potential targets are:
🎯 $4.034
🎯 $4.295
🎯 $4.607
🎯 $4.919
🎯 $5.363
🎯 $5.928
⚠️ Always remember to use a tight stop-loss and follow proper risk management.
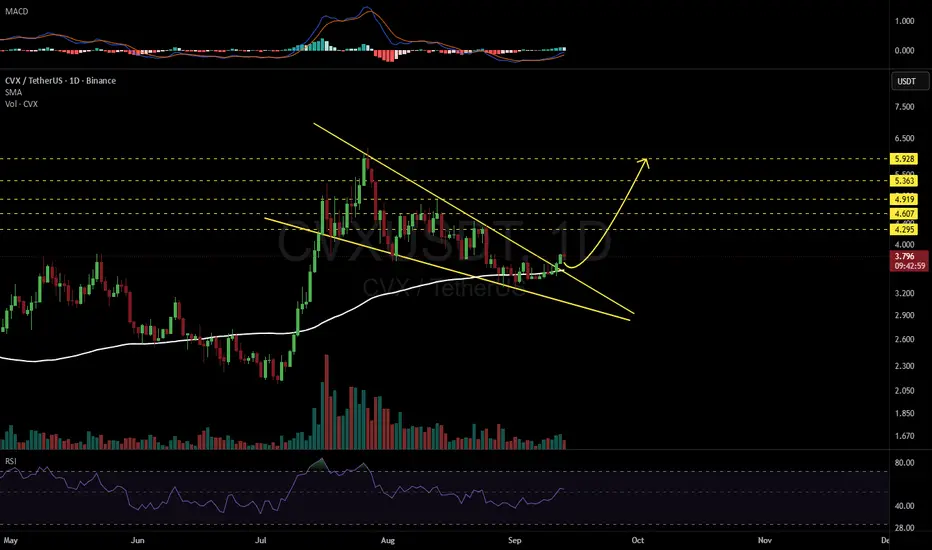
CVXUSDT 1D#CVX has broken above the falling wedge pattern on the daily chart. A retest of the daily SMA100 and the wedge is expected before the next leg up, so consider buying in ladders. In case of a successful bounce, the targets are:
🎯 $4.295
🎯 $4.607
🎯 $4.919
🎯 $5.363
🎯 $5.928
⚠️ Always remember to use a tight stop-loss and follow proper risk management.
The key is whether it can rise above 5.886.
Hello, fellow traders!
If you "Follow" me, you'll always get the latest information quickly.
Have a great day.
-------------------------------------
I don't necessarily recommend coins (tokens) that exhibit this behavior.
However, if you have spare funds or have or can generate significant profits from other coins (tokens), I think it's worth looking into these coins (tokens) when they're ready to trade.
The key is to maintain the price above the M-Signal indicator on the 1M chart.
------
CVX/USDT: Long-Term Breakout Signals Massive Upside PotentialFirstly, our Algo-based indicators are used to create this analysis: DON'T MISS US. FOLLOW US, COMMENT AND BOOST.
This weekly chart for CVX/USDT reveals a major bullish breakout from a long-term pattern, suggesting that the asset may be in the early stages of a significant new uptrend.
Analysis:
Descending Channel Breakout: For over two years, CVX has been trading within a clear descending channel. Recently, the price has decisively broken out of this channel to the upside, signaling a
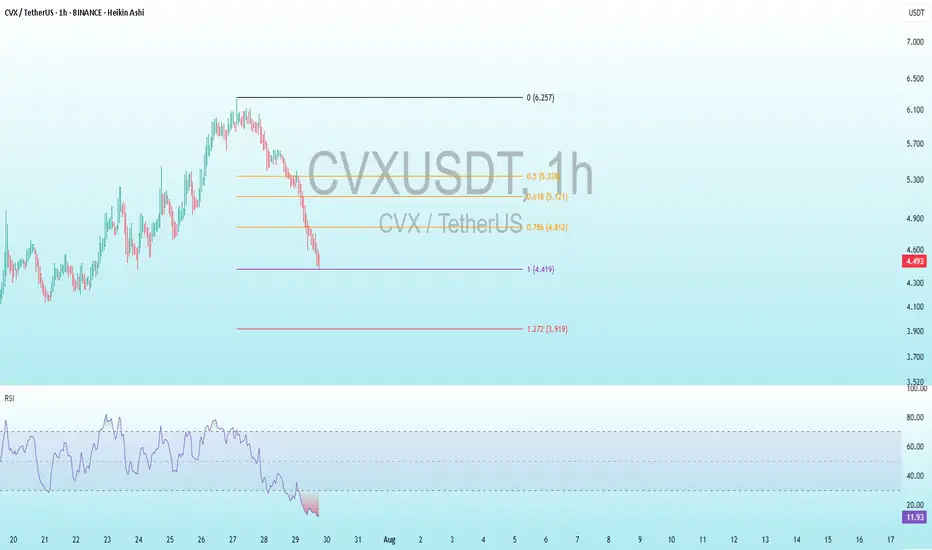
CVX Bullish DivergenceBINANCE:CVXUSDT
Trade Setup:
Target 1: 4.812 (0.786 Fibonnaci Golden Zone).
Target 2: 5.121 (0.618 Fibonnaci Golden Zone).
Target 3: 5.338 (0.5 Fibonnaci Golden Zone).
Target 4: 6.257 (0 Fibonnaci).
Stop Loss: 3.919 (above recent high, ~25% above current price).
RSI Analysis: The RSI is showing a bullish divergence, suggesting potential bullish momentum. The current RSI is around 11.86, approaching oversold territory, so caution is advised.