#CYBERUSDT Forming Bullish Continuation ?#CYBER
The price is moving within a descending channel on the 1-hour timeframe and has reached the lower boundary. It is now poised for a bounce and is expected to retest this boundary.
The Relative Strength Index (RSI) indicates a downward trend, which is likely to continue given the overbought conditions.
There is a key support zone in green at 0.319, and the price has bounced off this zone several times, making it a strong support level.
The price is trending towards the 100-period moving average, which we are approaching. This trend supports an upward move.
Entry Price: 0.344
Target 1: 0.352
Target 2: 0.361
Target 3: 0.372
Stop Loss: At the resistance zone in green
Remember this simple rule: Money management.
Any questions? Please leave a comment.
Thank you.
In-depth trading ideas
#CYBERUSDT Forming Bullish Continuation ?#CYBER
The price is moving within a descending channel on the 1-hour timeframe and has reached the lower boundary. It is now poised for a bounce and is expected to retest this boundary.
The Relative Strength Index (RSI) indicates a downward trend, which is likely to continue given the overbought conditions.
A key support zone (in green) has been identified at 0.320. The price has bounced off this zone several times, making it a strong support level.
The price is trending towards the 100-period moving average, which we are approaching. This trend supports an upward move.
Entry Price: 0.352
First Target: 0.357
Second Target: 0.364
Third Target: 0.373
You can close at the second target or wait for the third target to be reached. The choice is yours.
Stop Loss: At the resistance zone (in green).
Remember this simple rule: Money Management.
Any questions? Please leave a comment.
Thank you.
#CYBERUSDT Forming Bullish Continuation ?#CYBER
The price is moving within a descending channel on the 1-hour timeframe and has reached the lower boundary. It is now poised for a bounce and is expected to retest this boundary.
The Relative Strength Index (RSI) indicates a downward trend, which is likely to continue given the overbought conditions.
There is a key support zone in green at 0.313, and the price has bounced off this zone several times, making it a strong support level.
The price is trending towards the 100-period moving average, which we are approaching. This trend supports an upward move.
Entry Price: 0.338
Target 1: 0.348
Target 2: 0.359
Target 3: 0.373
Stop Loss: At the resistance zone in green
Remember this simple rule: Money management.
Any questions? Please leave a comment.
Thank you.
#CYBERUSDT Forming Bullish Continuation ?#CYBER
The price is moving within a descending channel on the 1-hour timeframe and has reached the lower boundary. It is now poised for a bounce and is expected to retest this boundary.
The Relative Strength Index (RSI) indicates a downward trend, which is likely to continue given the overbought conditions.
There is a key support zone in green at 0.330. The price has bounced off this zone several times, making it a strong support level.
The price is trending towards the 100-period moving average, which we are approaching. This trend supports an upward move.
Entry Price: 0.361
Target 1: 0.366
Target 2: 0.376
Target 3: 0.388
Stop Loss: At the resistance zone in green
Remember this simple rule: Money management.
Any questions? Please leave a comment.
Thank you.
CYBERUSDT - Bear Flag: Breakdown Ahead Toward Lower?On the 8H timeframe, CYBER/USDT remains in a dominant downtrend structure after experiencing a sharp decline from above the $0.50 region. Price is currently trading within a Bear Flag 🐻🚩 formation, a classic continuation pattern that often develops after a strong bearish impulse.
A Bear Flag forms when price enters a temporary upward consolidation channel following a significant decline (the flagpole). This structure is often interpreted as a distribution phase before the next leg lower begins.
---
🐻🚩 Bear Flag Pattern Formation
🔍 Pattern Components:
✅ Flagpole
📉 A sharp decline from approximately $0.46 - $0.47 down to the $0.34 area.
⚡ This move reflects strong selling pressure and clear bearish dominance.
---
✅ Ascending Flag Channel
📈 Price is slowly moving higher inside an ascending channel.
🟢 The lower trendline continues to act as dynamic support.
🔴 The upper trendline serves as dynamic resistance.
---
✅ Key Resistance
🟨 Major resistance is located around $0.40 - $0.41.
🚧 This zone represents the primary invalidation level for the Bear Flag pattern.
As long as price remains below this resistance zone, the bearish structure remains valid.
---
🐻 Bearish Scenario (Primary Outlook)
Historically, Bear Flags tend to favor trend continuation to the downside.
⚠️ Bearish Confirmation:
🔻 Breakdown below the lower channel trendline.
🔻 An 8H or Daily candle closes beneath channel support.
🔻 Increasing volume during the breakdown.
🎯 Downside Targets:
🎯 Target 1: $0.342
🎯 Target 2: $0.333
🎯 Target 3: $0.326
💥 If the $0.326 support fails to hold, price could continue its bearish expansion toward lower levels based on the Bear Flag projection.
---
🐂 Bullish Scenario (Bear Flag Invalidation)
Although the primary trend remains bearish, a bullish reversal becomes possible if buyers regain momentum.
🚀 Bullish Confirmation:
✅ Breakout above the upper channel trendline.
✅ Strong close above the $0.40 - $0.41 resistance zone.
✅ Significant increase in buying volume.
🎯 Upside Targets:
🎯 Target 1: $0.42
🎯 Target 2: $0.44
🎯 Target 3: $0.46
📈 However, until the key resistance is broken, any upward move may simply be a relief rally within the broader downtrend.
---
🔎 Key Levels to Watch
🚧 Resistance:
🟨 $0.40 - $0.41 (Key Resistance)
🛡️ Support:
🟢 $0.342
🟢 $0.333
🟢 $0.326
---
📈 Conclusion
CYBER/USDT is currently forming a Bear Flag Pattern 🐻🚩 on the 8H timeframe following a strong bearish impulse.
The ascending channel appears more like a consolidation phase rather than a true trend reversal.
📌 As long as price remains below the $0.40 - $0.41 resistance zone, probabilities continue to favor the bearish scenario, with downside targets at $0.342, $0.333, and potentially $0.326.
⏳ Traders should wait for a confirmed breakout or breakdown before making decisions, as the current structure represents a critical decision zone for the next major move.
⚠️ Always manage your risk and never trade without a plan.
#CYBER #CYBERUSDT #BearFlag #BearishPattern #Crypto #Cryptocurrency #Altcoin #Altcoins #Binance #TradingView #TechnicalAnalysis #ChartAnalysis #PriceAction #SupportAndResistance #MarketStructure
#CYBERUSDT Forming Bullish Continuation ?#CYBER
The price is moving within a descending channel on the 1-hour timeframe and has reached the lower boundary. It is now poised for a bounce and is expected to retest this boundary.
The Relative Strength Index (RSI) indicates a downward trend, which is likely to continue given the overbought conditions.
There is a key support zone in green at 0.444. The price has bounced off this zone several times, making it a strong support level.
The price is trending towards the 100-period moving average, which we are approaching. This trend supports an upward move.
Entry Price: 0.478
First Target: 0.490
Second Target: 0.503
Third Target: 0.519
You can stop at the first and second targets and close the price, or continue towards the third target. Stop Loss: At the resistance zone in green.
Remember this simple rule: Money Management.
Any questions? Please leave a comment.
Thank you.
CYBERUSDT | Long-Term Downtrend Compression → BreakoutCYBERUSDT | Long-Term Downtrend Compression → Breakout → Multi-Stage Expansion 🚀
CYBERUSDT has been trading under a prolonged bearish structure, forming consistent lower highs within a descending trendline. However, recent price action shows signs of trend exhaustion and a shift toward accumulation at the lows.
━━━━━━━━━━━━━━━
📊 Market Structure Breakdown
• Extended downtrend with strong trendline respect
• Gradual compression near base → reduced volatility
• Formation of a tight range → accumulation phase
• Early breakout signals emerging from structure
This suggests:
→ Seller exhaustion
→ Liquidity absorption at lows
→ Transition toward expansion phase
━━━━━━━━━━━━━━━
💡 Key Levels & Targets
🔹 Accumulation Base: ~0.57
→ Critical support zone
🎯 Target 1: ~0.70
→ Initial breakout confirmation
🎯 Target 2: ~1.34
→ Major structure / liquidity zone
🎯 Target 3: ~3.41
→ High liquidity resistance
🎯 Expansion Potential: ~2.86+ move (~500% range)
→ Full expansion scenario
━━━━━━━━━━━━━━━
🚀 Projected Scenario
The projected path reflects a classic accumulation-to-expansion cycle:
1. Breakout from compression base
2. Gradual build-up toward initial targets
3. Acceleration into mid-range liquidity
4. Strong expansion toward higher resistance zones
This represents a high R:R reversal setup .
━━━━━━━━━━━━━━━
⚠️ Invalidation
• Breakdown below accumulation zone (~0.57)
• Failure to sustain breakout momentum
• Continued sideways compression
This would delay or invalidate the bullish scenario.
━━━━━━━━━━━━━━━
🧠 Key Insight
Markets that compress for extended periods after a downtrend often generate high-momentum breakout moves .
Compression → Expansion is the key dynamic here.
━━━━━━━━━━━━━━━
📌 Conclusion
CYBERUSDT is approaching a critical breakout zone .
A confirmed move above structure could trigger a multi-stage expansion toward higher liquidity levels .
Watch the breakout — this is where momentum shifts aggressively.
#CYBERUSDT Forming Bullish Continuation ?#CYBER
The price is moving within a descending channel on the hourly timeframe. It has reached the lower boundary and is trending towards a bounce. A retest of this boundary is expected.
The Relative Strength Index (RSI) indicates a downward trend, and this trend is likely to continue due to the overbought condition.
A key support zone (in green) has been identified at 0.500. The price has bounced off this zone several times, making it a strong support level.
The price is trending towards the 100-period moving average, which we are approaching. This trend supports an upward move.
Entry Price: 0.535
First Target: 0.543
Second Target: 0.552
Third Target: 0.563
You can close at the second target or wait for the third target to be reached. The choice is yours.
Stop Loss: At the resistance zone (in green).
Remember this simple rule: Money Management.
Any questions? Please leave a comment.
Thank you.
#CYBER/USDT Forming Bullish Continuation ?#CYBER
The price is moving within a descending channel on the hourly timeframe. It has reached the lower boundary and is trending towards a bounce. A retest of this boundary is expected.
The Relative Strength Index (RSI) indicates a downward trend, and this trend is likely to continue due to the overbought condition.
There is a key support zone in green at 0.568, and the price has bounced off this zone several times, making it a strong support level.
The price is trending towards the 100-period moving average, which we are approaching. This trend supports an upward move.
Entry Price: 0.578
Target 1: 0.583
Target 2: 0.589
Target 3: 0.595
Stop Loss: At the resistance zone in green
Remember this simple rule: Money management.
Any questions, please leave a comment.
Thank you.
#CYBERUSDT Forming Bullish Continuation ?#CYBER
The price is moving within a descending channel on the 1-hour timeframe and has reached the lower boundary. It is now poised for a bounce and is expected to retest this boundary.
The Relative Strength Index (RSI) indicates a downward trend, which is likely to continue given the overbought conditions.
There is a key support zone (in green) at 0.500. The price has bounced off this zone several times, making it a strong support level.
The price is trending towards the 100-period moving average, which we are approaching. This trend supports an upward move.
Entry Price: 0.532
First Target: 0.538
Second Target: 0.545
Third Target: 0.556
You can stop at the first and second targets and close below them, or continue towards the third target. Stop Loss: At the resistance zone (in green).
Remember this simple rule: Money Management.
Any questions? Please leave a comment.
Thank you.
#CYBERUSDT Forming Bullish Continuation ?#CYBER
The price is moving within a descending channel on the hourly timeframe. It has reached the lower boundary and is trending towards a bounce. A retest of this boundary is expected.
The Relative Strength Index (RSI) indicates a downward trend, and this trend is likely to continue due to the overbought condition.
There is a key support zone in green at 0.500, and the price has bounced off this zone several times, making it a strong support level.
The price is trending towards the 100-period moving average, which we are approaching. This trend supports an upward move.
Entry Price: 0.520
Target 1: 0.529
Target 2: 0.538
Target 3: 0.548
Stop Loss: At the resistance zone in green
Remember this simple rule: Money management.
Any questions, please leave a comment.
Thank you.
#CYBER/USDT Forming Bullish Continuation ?#CYBER
The price is moving within a descending channel on the hourly timeframe. It has reached the lower boundary and is trending towards a bounce. A retest of this boundary is expected.
The Relative Strength Index (RSI) indicates a downward trend, and this trend is likely to continue due to the overbought condition.
A key support zone (in green) was found at 0.530, and the price has bounced off this zone several times, making it a strong support level.
The price is trending towards the 100-period moving average, which we are approaching. This trend supports an upward move.
Entry Price: 0.540
First Target: 0.544
Second Target: 0.550
Third Target: 0.557
Stop Loss: At the resistance zone (in green)
Remember this simple rule: Money Management.
Any questions, please leave a comment.
Thank you.
CYBER Showing Weakness at Resistance–Bearish Reversal Incoming?#$CYBER is currently in a strong uptrend with high volume, but price action is now flashing early warning signs on the 30-minute timeframe.
What I’m Seeing:
Strong bullish structure (HH & HL)
Multiple rejections at a key resistance zone
Bearish Divergence on RSI
Clear Double Top Formation
Despite the bullish momentum, price failed to break resistance, which suggests buyers are losing strength.
Trade Plan (Bearish Scenario)
I’m not entering early — waiting for confirmation.
Clear support breakdown
Strong candle close below support
Volume expansion on breakdown
Short Entry: After breakdown or breakdown + retest
Stop Loss: Above double top / recent high
Targets: Next key support zones (partial profit booking)
Chances increase for a pullback or short-term trend reversal.
No breakdown = No trade. Patience pays.
Do you think #CYBER will fake out or dump from here?
Comment your bias below
👍 Like | 💬 Comment | 🔔 Follow for more high-probability setups with proper risk management.
#CYBER #CYBERUSDT #Crypto #Cryptocurrency #Altcoins #Binance #TechnicalAnalysis #PriceAction #RSIDivergence #DoubleTop #Breakdown #ShortSetup #DayTrading #Scalping #CryptoTrading #RiskManagement #TradingViewIdeas #ChartAnalysis
CYBERUSDT 1D#CYBER is trading within a falling wedge pattern on the daily timeframe. Volume has increased significantly, and the price is currently facing resistance at the wedge resistance and the daily SMA50. In case of a breakout above both levels, the potential upside targets are:
🎯 $0.950
🎯 $1.097
🎯 $1.245
🎯 $1.455
🎯 $1.722
⚠️ Always use tight stop-losses and maintain strict risk management.
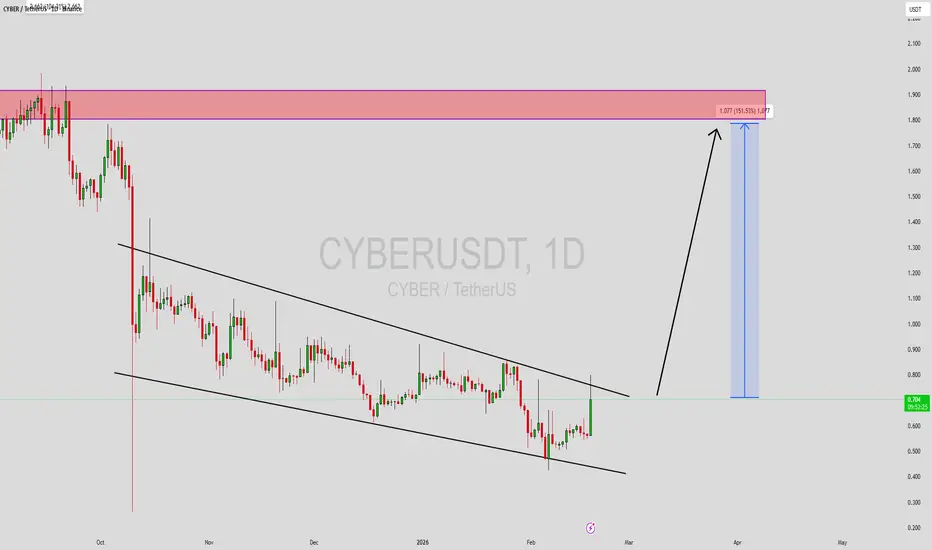
CYBERUSDT Forming Falling WedgeCYBERUSDT is forming a clear falling wedge pattern, a classic bullish reversal signal that often indicates an upcoming breakout. The price has been consolidating within a narrowing range, suggesting that selling pressure is weakening while buyers are beginning to regain control. With consistent volume confirming accumulation at lower levels, the setup hints at a potential bullish breakout soon. The projected move could lead to an impressive gain of around 140% to 150% once the price breaks above the wedge resistance.
This falling wedge pattern is typically seen at the end of downtrends or corrective phases, and it represents a potential shift in market sentiment from bearish to bullish. Traders closely watching CYBERUSDT are noting the strengthening momentum as it nears a breakout zone. The good trading volume adds confidence to this pattern, showing that market participants are positioning early in anticipation of a reversal.
Investors’ growing interest in CYBERUSDT reflects rising confidence in the project’s long-term fundamentals and current technical strength. If the breakout confirms with sustained volume, this could mark the start of a fresh bullish leg. Traders might find this a valuable setup for medium-term gains, especially as the wedge pattern completes and buying momentum accelerates.
✅ Show your support by hitting the like button and
✅ Leaving a comment below! (What is your opinion about this Coin?)
Your feedback and engagement keep me inspired to share more insightful market analysis with you!
#CYBER/USDT Forming Bullish Continuation ?#CYBER
The price is moving within a descending channel on the hourly timeframe. It has reached the lower boundary and is heading towards a breakout, with a retest of the upper boundary expected.
The Relative Strength Index (RSI) is showing a downward trend, approaching the lower boundary, and an upward bounce is anticipated.
There is a key support zone in green at 0.494, and the price has bounced from this level several times. Another bounce is expected.
The RSI is showing a trend towards consolidation above the 100-period moving average, which we are approaching, supporting the upward move.
Entry Price: 0.513
Target 1: 0.538
Target 2: 0.567
Target 3: 0.606
Stop Loss: Below the green support zone.
Remember this simple thing: Money management.
For any questions, please leave a comment.
Thank you.
#CYBER/USDT Forming Bullish Continuation ?#CYBER
The price is moving within a descending channel on the hourly timeframe. It has reached the lower boundary and is heading towards a breakout, with a retest of the upper boundary expected.
The Relative Strength Index (RSI) is showing a downward trend, approaching the lower boundary, and an upward bounce is anticipated.
There is a key support zone in green at 0.500, and the price has bounced from this level several times and is expected to bounce again.
The indicator is showing a trend towards consolidation above the 100-period moving average, which we are approaching, supporting the upward move.
Entry Price: 0.523
First Target: 0.545
Second Target: 0.568
Third Target: 0.596
Stop Loss: Below the green support zone.
Remember this simple thing: Money management.
For any questions, please leave a comment.
Thank you.
ABC Completed on CYBER | This Is Where Smart Money BuysFrom my perspective, CYBER appears to have completed a full ABC corrective structure and is now positioning itself for a potential continuation to the upside. After finishing this correction, the price is expected to perform a pullback into key support zones before resuming its bullish movement.
The green highlighted area represents a very important and high-confluence support zone. This is the region where we should be looking for long (buy) opportunities. We only take risk in areas where the probability of success is clearly higher, because disciplined and calculated risk-taking is the correct approach in trading.
There are two green support zones marked on the chart. In both of these areas, the main plan is to look for buy / long positions. Entries should be executed using a DCA (Dollar Cost Averaging) strategy within the defined entry zone, rather than entering with full size at a single price level.
All target levels are clearly marked on the chart and should be respected according to your trading plan. Partial profit-taking along the way is recommended to reduce risk and protect gains.
Proper risk and capital management must not be ignored under any circumstances. Always trade with predefined risk, use appropriate position sizing, and avoid overexposure to a single setup.
If you have a coin or altcoin you want analyzed, first hit the like button and then comment its name so I can review it for you
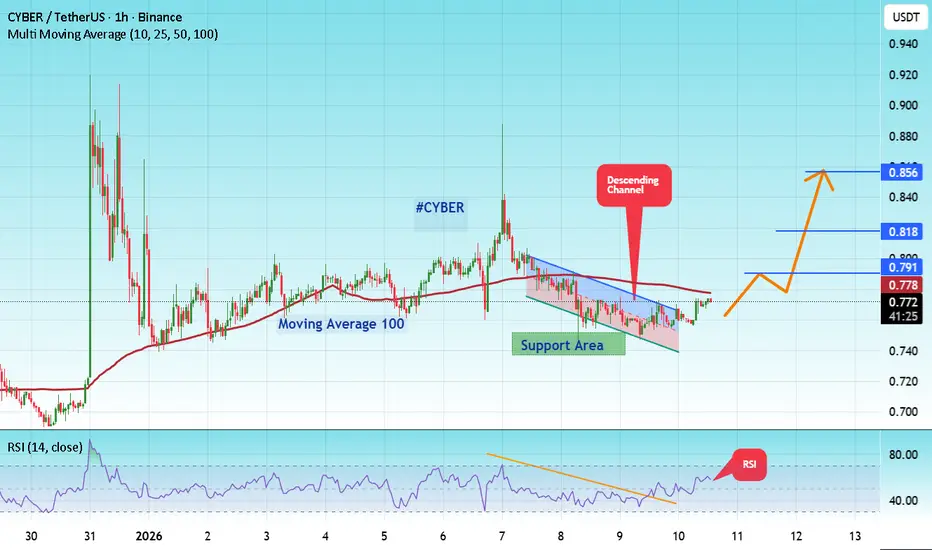
#CYBER/USDT Forming Bullish Continuation ?#CYBER
The price is moving within a descending channel on the hourly timeframe. It has reached the upper boundary and is heading towards breaking it. A retest of this boundary is expected.
The Relative Strength Index (RSI) is showing an upward trend, as it has approached the upper boundary. A bearish reversal is expected.
There is a key support zone in green at 0.746. The price has bounced from this zone several times and is expected to bounce again.
A consolidation trend is observed above the 100-period moving average, which we are approaching. This trend supports a decline towards this level.
Entry Price: 0.771
Target 1: 0.791
Target 2: 0.818
Target 3: 0.856
Stop Loss: Above the green support zone.
Remember this simple thing: Money management.
For any questions, please leave a comment.
Thank you.
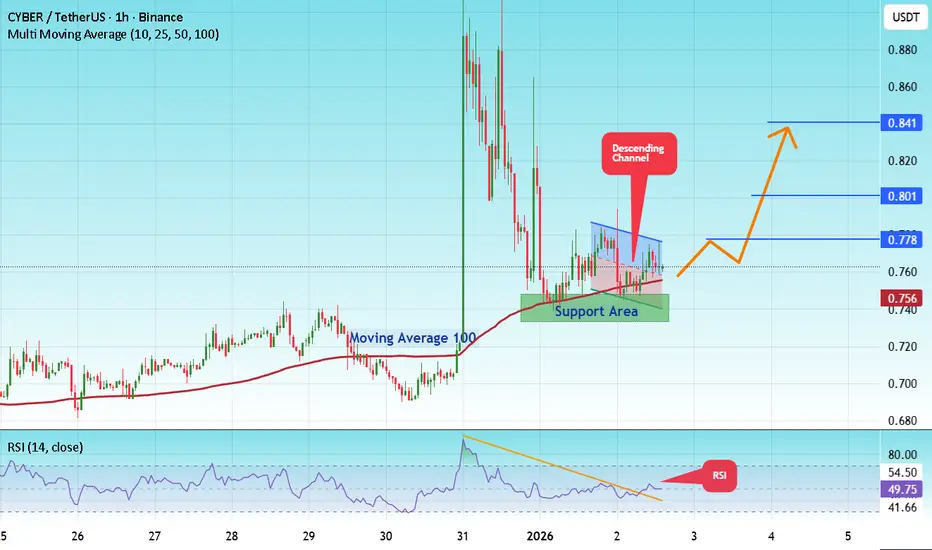
#CYBER/USDT Forming Bullish Continuation ?#CYBER
The price is moving in a descending channel on the 1-hour timeframe. It has reached the lower boundary and is heading towards a breakout, with a retest of the upper boundary expected.
We are seeing a bearish trend in the Relative Strength Index (RSI), which has reached near the lower boundary, and an upward bounce is expected.
There is a key support zone in green at 0.740, and the price has bounced from this level several times. Another bounce is expected.
We are seeing a trend towards stabilizing above the 100-period moving average, which we are approaching, supporting the upward trend.
Entry Price: 0.760
First Target: 0.778
Second Target: 0.800
Third Target: 0.840
Remember a simple principle: Money Management.
Place your stop-loss order below the green support zone.
For any questions, please leave a comment.
Thank you.