Compare with DASH/USDT
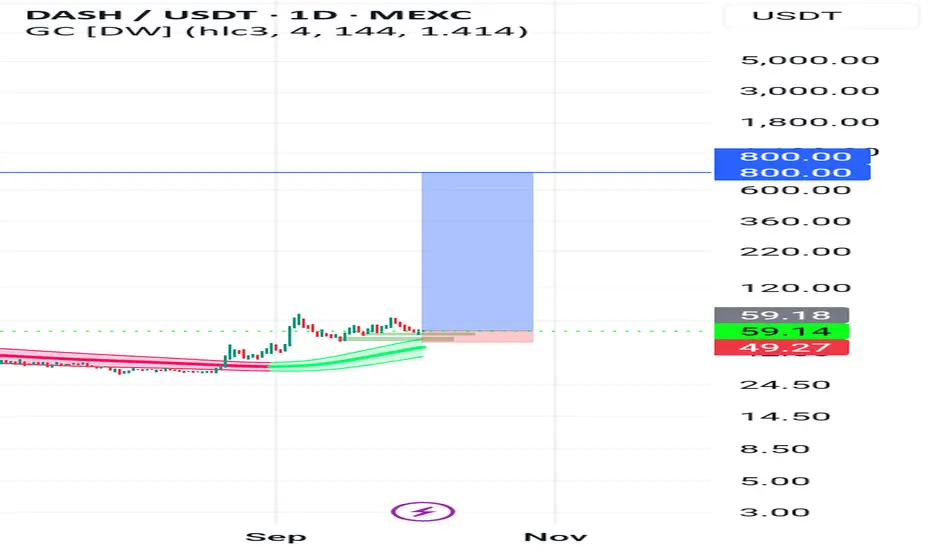
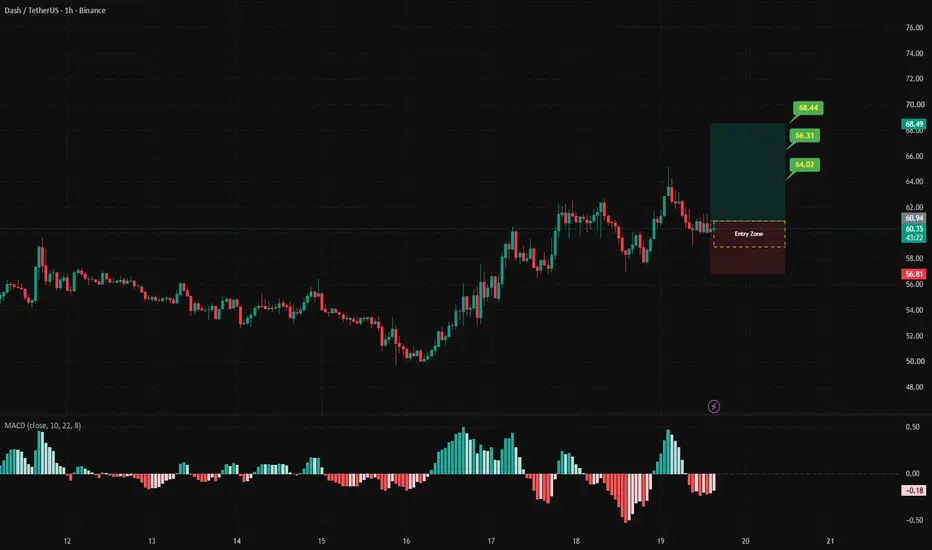
dashusdt longINSTRUCTIONS TO READ AND TO FOLLOW:
Entry point: yellow
Stop loss: red
Take profit: green or blue
👉Leverage x 5-10-20 for crypto
👉Leverage x 20-50-100 for commodities, stocks, indices, and forex
👉Margin 1-5% max:
This limits your maximum loss to 5% and guarantees that you retain 95% of your portfo
the final resistance (DASH) —the best is yet to comeThe same resistance zone that is being challenged today has been active since 2023. DASHUSDT is facing the final barrier, one more level needs to be conquered and the chart opens $193 as the next target. This one is followed by $300. It seems 2027 offers the possibility of a new all-time high on Da
DASHUSDT – Bullish Breakout Setup | 1H Chart AnalysT#DASH
The price is moving within a descending channel on the 1-hour timeframe; it has reached the lower boundary and appears poised for a rebound. A retest of this boundary is expected, supporting an upward move.
The Relative Strength Index (RSI) indicates a bearish trend, but an upward breakout i
#DASHUSDT – Bullish Breakout Setup | 1H Chart Analys#DASH
The price is moving within a bearish channel on the 1-hour timeframe; it has reached the lower boundary and appears poised for a rebound. A retest of this boundary is expected, supporting some upward movement.
The Relative Strength Index (RSI) indicates a bearish trend, but an upward breakou
DASHUSDT: Weekly Re-Accumulation and Daily Nested Wave 3 Setup⚛️
DASH is one of the stronger higher-timeframe continuation structures on my watchlist.
The weekly chart is holding the W imbalance and the 200 EMA cloud after a major reversal off the lows. That pullback did not destroy the recovery. It created a higher-timeframe re-accumulation zone, and price
#DASHUSDT – Bullish Breakout Setup | 1H Chart Analys#DASH
The price is moving within a bearish channel on the 1-hour timeframe; it has reached the lower boundary and appears poised for a rebound. A retest of this boundary is expected, supporting an upward move.
The Relative Strength Index (RSI) indicates a bearish trend, but an upward breakout is l
DASH ForecastBINANCE:DASHUSDT
The logic behind this trade is that, on the higher timeframe, we still have bullish momentum. On the lower timeframe, we’ve seen an upward move followed by a moderate correction.
However, the momentum of the latest leg has weakened significantly, which suggests that the correctio
See all ideas
Summarizing what the indicators are suggesting.
Oscillators
Neutral
Oscillators
Neutral
Summary
Neutral
Summary
Neutral
Summary
Neutral
Moving Averages
Neutral
Moving Averages
Neutral
Displays a symbol's price movements over previous years to identify recurring trends.
Frequently asked questions
The current price of DASH / USDT (DASH) is 59.69 USDT — it has fallen −0.29% in the past 24 hours. Try placing this info into the context by checking out what coins are also gaining and losing at the moment and seeing DASH price chart.
DASH / USDT price has fallen by −17.71% over the last week, its month performance shows a 24.71% increase, and as for the last year, DASH / USDT has increased by 74.28%. See more dynamics on DASH price chart.
Keep track of coins' changes with our Crypto Coins Heatmap.
DASH / USDT (DASH) reached its highest price on May 7, 2021 — it amounted to 477.02 USDT. Find more insights on the DASH price chart.
See the list of crypto gainers and choose what best fits your strategy.
DASH / USDT (DASH) reached the lowest price of 17.40 USDT on Jun 22, 2025. View more DASH / USDT dynamics on the price chart.
See the list of crypto losers to find unexpected opportunities.
The safest choice when buying DASH is to go to a well-known crypto exchange. Some of the popular names are Binance, Coinbase, Kraken. But you'll have to find a reliable broker and create an account first. You can trade DASH right from TradingView charts — just choose a broker and connect to your account.
Crypto markets are famous for their volatility, so one should study all the available stats before adding crypto assets to their portfolio. Very often it's technical analysis that comes in handy. We prepared technical ratings for DASH / USDT (DASH): today its technical analysis shows the neutral signal, and according to the 1 week rating DASH shows the buy signal. And you'd better dig deeper and study 1 month rating too — it's strong buy. Find inspiration in DASH / USDT trading ideas and keep track of what's moving crypto markets with our crypto news feed.
DASH / USDT (DASH) is just as reliable as any other crypto asset — this corner of the world market is highly volatile. Today, for instance, DASH / USDT is estimated as 1.16% volatile. The only thing it means is that you must prepare and examine all available information before making a decision.
You can discuss DASH / USDT (DASH) with other users in our public chats, Minds or in the comments to Ideas.