In-depth trading ideas
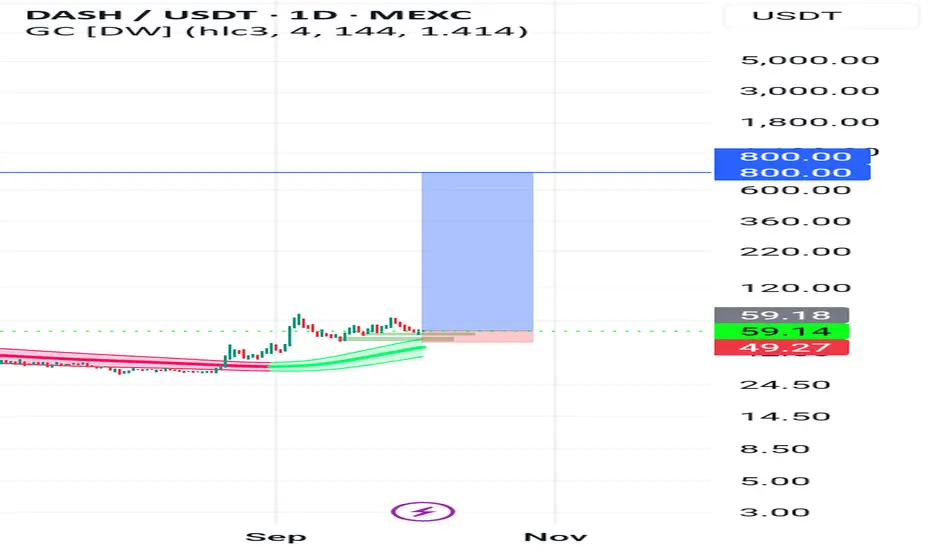
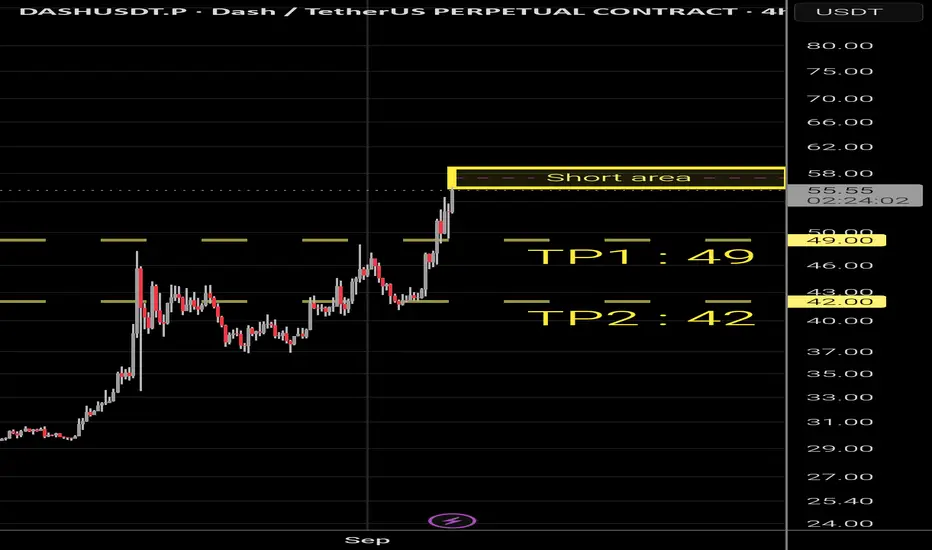
dashusdt longINSTRUCTIONS TO READ AND TO FOLLOW:
Entry point: yellow
Stop loss: red
Take profit: green or blue
👉Leverage x 5-10-20 for crypto
👉Leverage x 20-50-100 for commodities, stocks, indices, and forex
👉Margin 1-5% max:
This limits your maximum loss to 5% and guarantees that you retain 95% of your portfolio in the event of a stop-loss.
🔥🔥🔥🔥🔥🔥🔥🔥🔥🔥🔥🔥🔥🔥
ALWAYS PRACTICE RISK AND MONEY MANAGEMENT:
🔥🔥🔥🔥🔥🔥🔥🔥🔥🔥🔥🔥🔥🔥
👉Invest a maximum of 5% on any trade or across all your trades.
Invest only what you can aff
the final resistance (DASH) —the best is yet to comeThe same resistance zone that is being challenged today has been active since 2023. DASHUSDT is facing the final barrier, one more level needs to be conquered and the chart opens $193 as the next target. This one is followed by $300. It seems 2027 offers the possibility of a new all-time high on Dash.
The $300 target is a high probability level. The previous bullish wave reached $150, this happened back in November 2025. $193 is not a major level compared to $150. Still, a bit far and resista
DASHUSDT – Bullish Breakout Setup | 1H Chart AnalysT#DASH
The price is moving within a descending channel on the 1-hour timeframe; it has reached the lower boundary and appears poised for a rebound. A retest of this boundary is expected, supporting an upward move.
The Relative Strength Index (RSI) indicates a bearish trend, but an upward breakout is likely due to oversold conditions on the 1-hour chart.
An orange trend line supports the potential upward rebound.
There is initial support at 54.65, acting as a primary support zone.
A key suppo
#DASHUSDT – Bullish Breakout Setup | 1H Chart Analys#DASH
The price is moving within a bearish channel on the 1-hour timeframe; it has reached the lower boundary and appears poised for a rebound. A retest of this boundary is expected, supporting some upward movement.
The Relative Strength Index (RSI) indicates a bearish trend, but an upward breakout is likely due to oversold conditions on the 1-hour timeframe.
There is initial support at 46.00, acting as a primary support zone.
A key support zone (marked in green) exists at 39.00; the price h
DASHUSDT: Weekly Re-Accumulation and Daily Nested Wave 3 Setup⚛️
DASH is one of the stronger higher-timeframe continuation structures on my watchlist.
The weekly chart is holding the W imbalance and the 200 EMA cloud after a major reversal off the lows. That pullback did not destroy the recovery. It created a higher-timeframe re-accumulation zone, and price is now back above the key weekly EMA structure.
Relative strength is also doing its job. DASH is outperforming both BTC and ETH across the short, medium, and longer-term windows. This is not just
#DASHUSDT – Bullish Breakout Setup | 1H Chart Analys#DASH
The price is moving within a bearish channel on the 1-hour timeframe; it has reached the lower boundary and appears poised for a rebound. A retest of this boundary is expected, supporting an upward move.
The Relative Strength Index (RSI) indicates a bearish trend, but an upward breakout is likely due to oversold conditions on the 1-hour chart.
There is initial support at 45.00.
A key support zone (marked in green) exists at 38.50; the price has rebounded from this area multiple times,
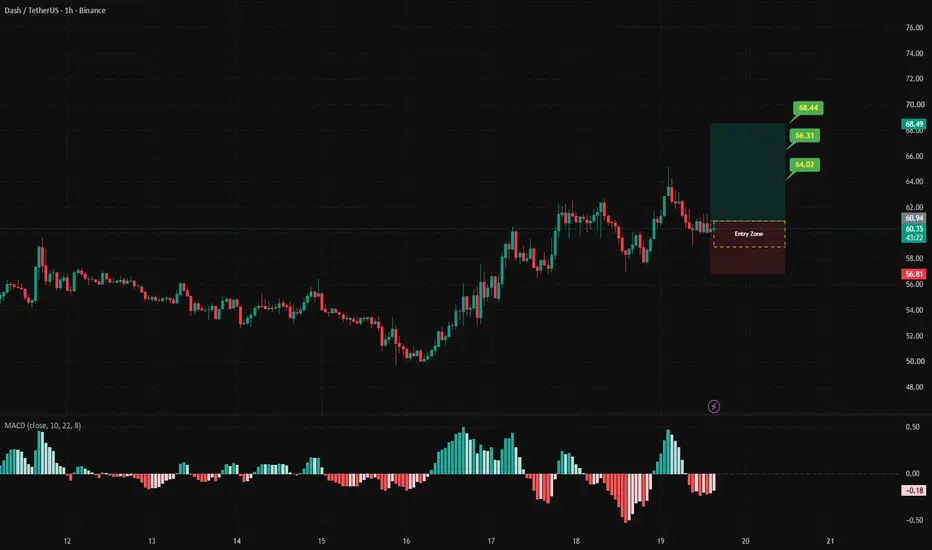
DASH ForecastBINANCE:DASHUSDT
The logic behind this trade is that, on the higher timeframe, we still have bullish momentum. On the lower timeframe, we’ve seen an upward move followed by a moderate correction.
However, the momentum of the latest leg has weakened significantly, which suggests that the correction may be coming to an end and that another bullish move could be starting.
This is a limit trade, so there is no trigger. The entry is based purely on price reaching the predefined trading zone.
⚠️
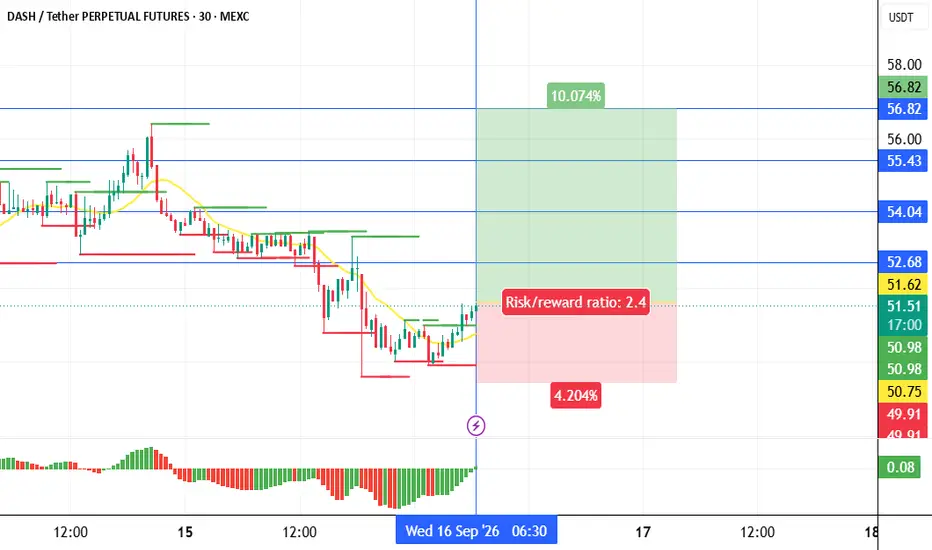
dashusdt longInstructions:
Entry point: yellow
Stop loss: red
Take profit: green or blue
👉Leverage x 5-10-20 for crypto
👉Leverage x 20-50-100 for commodities, stocks, indices, and forex
👉Margin 1-5% max.
Always practice risk and money management.
Invest a maximum of 5% on any trade or across all your trades.
Invest only what you can afford to lose, as no one is in control of the market.
👉Our analyses are primarily based on:
breakouts: two trend lines (ascending and descending) and a line indicating a hor
#DASHUSDT may continue its trend after correction#DASH
The price is moving within a bearish channel on the 1-hour timeframe; it has reached the lower boundary and is poised to break through it. A retest of this boundary is expected.
The Relative Strength Index (RSI) indicates a bearish trend, which is likely to continue given the overbought conditions.
There is a key resistance zone (marked in green) at 70.00; the price has bounced off this level multiple times, making it a strong support level.
A consolidation trend is observed above the
DASH/USDT | Fib Retest + Hidden Bullish Divergence Market Structure Analysis:
After a massive rally toward the $78.63 highs, DASH is pulling back into a healthy correction zone. The current price action is forming a higher low, while RSI prints a lower low—a textbook sign of bullish continuation.
Execution Strategy:
Trigger: Place a Buy Stop order above immediate micro-resistance (~$57.16) to confirm buyers are stepping back in.
DASH/USDT H1: Seller pressure at exhausted levels🎯 TP1: $56.3225 (+2.25%) │ TP2: $54.1989 (+5.94%)
🛑 SL: $62.2296 (-8.00%) │ R/R: 1 : 0.74
⚠️ Stop is wider than TP2 target (R/R < 1) — the closer target is hit more often, but adjust position size according to stop loss.
FUNDAMENTAL BACKGROUND
DASH is trading without its own catalysts, following the privacy coin sector and the broader crypto market. Today at 12:30 GMT, US Producer Price Index (PPI) data is expected, with a forecasted monthly increase of 0.4% vs. the previous 0.0%. Tomorrow, the
Dash pullback finished or just getting started? Expecting lower.Shown on the chart is Dash in an impressive impulse to the upside. I can count 5 up and done in the teal wave 3, followed by a slight retracement that looks similar to the pull back in other alts that are performing well. .382 Fib time of wave 2 has been reached but only dipping to a .236 fib retrace of its wave 3, I'd expect price action to bring us lower to around the .382 -.50 fib zone before moving up impulsively to finish the higher degree red wave 3.
Privacy Coins Lead Weekend MarketNASDAQ:DASH price prediction for September 2026 turned bullish as it held above the key $60 level, extending a move that has gained over 85% since mid-August. Futures open interest increased about 20%, signaling leveraged speculation. This is bullish for DASH because the breakout is confirmed by exceptionally high volume and growing derivatives interest, indicating strong buyer conviction. However, the rally is extended, with the price more than 55% above its 20-day EMA, suggesting a potential
DASH Is Compressing — And Compression Precedes ExpansionIn markets as in nature, compression is rarely the end of a movement; it is merely the quiet gathering of energy before expansion.
When traders look at older payment networks like Dash, they often miss the underlying mechanics.
CRYPTOCAP:DASH Dash doesn't rely on hype-driven DeFi TVL metrics; its core strength lies in its dual-tier network.
With a substantial portion of the circulating supply locked inside Masternodes (acting as a natural supply sink), sell-side pressure dries up much fa
DASH has entered a bullish cycle (1D)It appears that DASH has formed and completed a triangle pattern. Following the completion of this triangle, we expect DASH to move upward.
DASH is one of the privacy coins that is still bullish.
The green zone is the key area that must hold.
The targets are marked on the chart.
A daily candle close below the invalidation level will invalidate this analysis.
If you have a coin or altcoin you want analyzed, first hit the like button and then comment its name so I can review it for you.
Do y
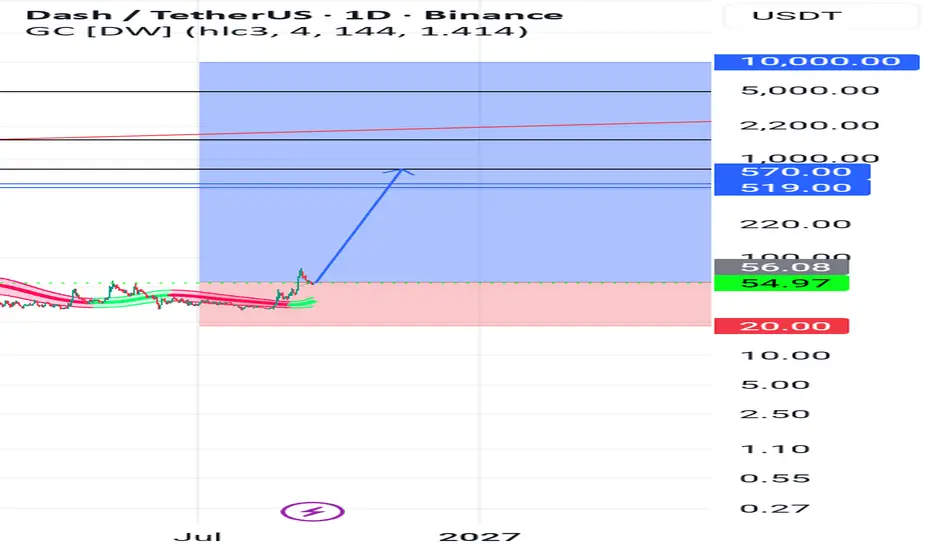
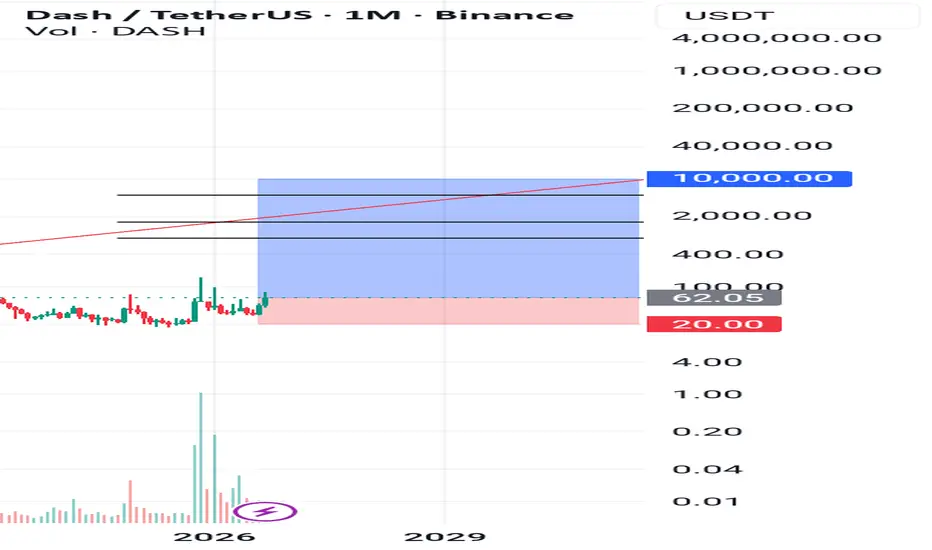
Dash $1,220 New All-Time High Yields 3,000% Profits Potential The previous all-time high reached $477 and Dash is now ready for new records. The last low happened June 2025, more than a year ago. What really stands out on this chart is the incredibly high amount of volume after last year's bottom.
See how once the bottom range is gone, it is gone forever. DASHUSDT will never trade below $25 ever again. The bullish market cycle you are seeing develop now is one that will last for many years into the future and this opens up more than 1,800% profits potenti
DashAlways use 2x–3x leverage. We build positions in stages, both long and short.
Max 4% of your account as margin per position. Split that 4% into 3–6 entries.
Example: $100 account → max $4 margin per position. Split it as $0.5, then $1, then $1.5. So $0.5 × 3x = $1.5 position size.
Don't get greedy.
Only add when your ROI is above -100%. Better: wait a few days between add-ons. Sleep on it — you might end up adding from higher.
Keep half your account in cash as a reserve. Balanced.
In a short mar
DASH/USDT | H1 | TESTING THE UPPER BOUNDARY OF THE RANGE ON A P🎯 TP1: $55.9988 (+3.01%) │ TP2: $57.6375 (+6.03%)
🛑 SL : $51.3804 (-5.48%) │ R/R: 1 : 1.1
⚠️ SL is placed beyond the nearest candle wicks to reduce the risk of accidental stop-outs
FUNDAMENTAL BACKGROUND
DASH received a fresh project catalyst — the DashCon 2026 conference launched in Amsterdam and discussions about the beta launch of shielded transactions on Android have increased interest in the coin as a payment asset with enhanced privacy. With no negative news regarding the project and a m