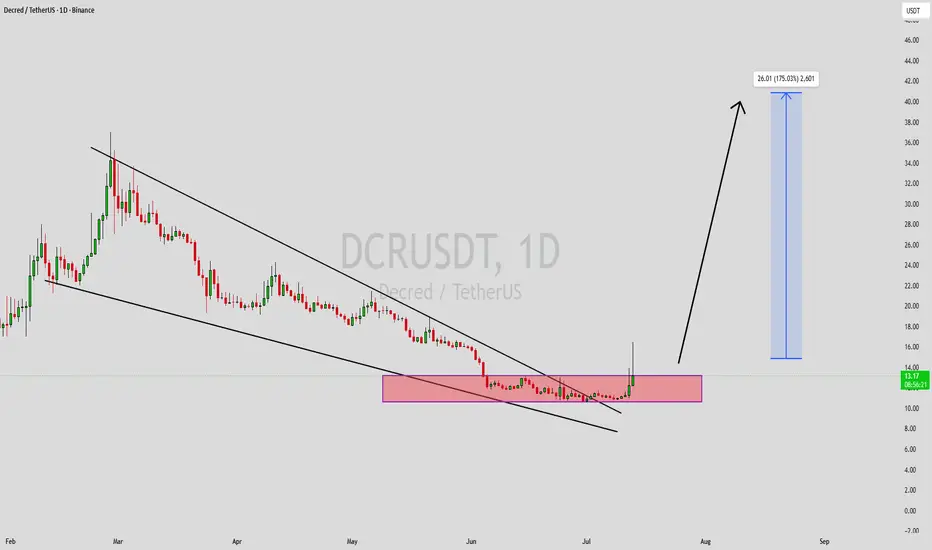
DCRUSDT Forming Bullish MomentumDCRUSDT is forming a clear bullish momentum pattern, a classic bullish wave signal that often indicates an upcoming breakout. The price has been consolidating within a narrowing range, suggesting that selling pressure is weakening while buyers are gradually regaining control. With consistent trading volume confirming accumulation at lower levels, the current setup hints at a potential bullish breakout in the near future. If the breakout is confirmed, the projected move could lead to an impressive gain of around 140% to 150%.
This bullish momentum pattern is commonly seen at the end of downtrends or corrective phases, signaling a potential shift in market sentiment from bearish to bullish. Traders closely watching DCRUSDT are noticing strengthening momentum as the price approaches a key breakout zone. Healthy trading volume further reinforces this setup, indicating that market participants are positioning early in anticipation of a sustained upward move.
Growing investor interest in DCRUSDT reflects increasing confidence in the project's long-term potential and its current technical structure. If buyers successfully push the price above resistance with sustained volume, it could mark the beginning of a fresh bullish leg. The ongoing consolidation phase suggests steady accumulation, creating favorable conditions for a strong continuation rally once the breakout is confirmed.
Traders may find this an attractive medium-term opportunity, especially as the bullish momentum pattern nears completion and buying pressure continues to build. A confirmed breakout could attract additional market participation and accelerate the move toward the projected upside target.
✅ Show your support by hitting the like button.
✅ Leaving a comment below! (What is You opinion about this Coin)
Your feedback and engagement keep me inspired to share more insightful market analysis with you!
In-depth trading ideas
DCRUSDT 1D (risky coin)#DCR is moving inside a falling wedge on the daily chart. Since it is trading below all major SMAs, EMAs, and the Ichimoku cloud, the structure is still not stable enough. Therefore, if you plan to enter this coin, wait for a confirmed breakout above the wedge resistance accompanied by strong volume. In that case, the targets shown on the chart could become achievable:
🎯 $20.75
🎯 $23.49
🎯 $25.71
🎯 $27.93
🎯 $31.08
🎯 $35.10
Mid-term targets:
🎯 $40.21
🎯 $42.87
🎯 $46.71
🎯 $53.88
In case of a breakdown below the wedge, price could revisit Support Zone 1 and even Support Zone 2. Do not take excessive risk on this coin.
⚠️ Always use a tight stop-loss and maintain proper risk management.
DCR Enters Major Support Zone — Possible Bounce SetupDCR has dropped sharply over the last couple of days and is now trading near a major support zone. If buyers defend this area, price could attempt a move higher toward the next resistance levels.
Trading Levels
Entry Zone: $18.8 – $19.2
Take Profit 1: $21.2
Take Profit 2: $23.2
Stop Loss: $18.1
Decred (DCR) on the move, fast and easy 333% · Start tradingDecred has been growing since October 2025. After a strong rise, an equally strong retrace showed up ending late December with a higher low.
After this higher low, DCRUSDT has been moving with a rising broadening channel. A very clear bullish preference.
The previous move reached $70. The target mapped on the chart, 333% profits potential at $104, is a very easy target because of the distance vs the last high. There is an even higher target on the chart, $160. This second one opens up 566%.
This is an easy chart, the structure leaves no room for doubt, Decred is bullish.
Yesterday another retrace reached its end. The low happened at $19.36. See the resistance/support based on Fibonacci proportions at $22.47. Today, the session is full green and recovers above this level.
This reveals the end of the retrace and also the start of the next advance. The structure clearly shows a rising trend; higher highs and higher lows, which assist us in concluding that a higher high is the next stop. First, at $49 and only then higher. The first stop should be fast, short-term.
Patience is key. Opportunities like this one will continue to show up; over and over, again and again. Endless opportunities.
First study and prepare. Then practice as much as you can. Start small. When you can win consistently with the small position, increase the size and you are on your way to reach your goals.
It takes time but it is worth the effort.
There is no hurry. We all learn following our own rhythms and ways. It can take me ten years to feel confident enough to trade consistently without quitting, to put on the effort and the time. For you, you might want to start right away, or you might be ready after 6 months to try, or after 3 years... We are all different and there is no one size fits all.
Whatever works for you, that's the method that you should follow.
Thanks a lot for your continued support.
Namaste.
Decred (DCR): potential bounce ahead? key levels and targets to Decred
Anyone watching this slow bleed on DCR and wondering when the bounce finally shows up? According to the market, smaller caps like Decred have been under pressure as liquidity rotates to majors after the latest crypto pullback and regulatory noise. Today’s drop just flushed price into a demand pocket that last time attracted real buyers, so eyes are on whether we get another reaction here.
On the 4H chart, price has slipped out of the recent range and is hugging support around 23, with RSI buried in oversold territory. I’m leaning toward a corrective move up rather than fresh lows: a classic mean‑reversion pop into the thick red supply band and HVN area around 26‑27, where previous volume stacked up. If buyers step in, I expect a grind higher into that zone before any bigger decision.
My base plan: look for confirmation longs on a reclaim of 24 with targets near 25.8, 26.7 and stretch 27.1 ✅. If 23 snaps clean and we start closing below that green support, I’d flip the bias and expect a slide toward the next liquidity pool lower instead of forcing longs. I might be wrong, but catching exhausted selloffs into clear demand is still one of my favorite plays.
Decred: poised for a pullback? key levels to watch closelyDecred – did you just wake this old cypherpunk up, or what? According to market chatter, hybrid PoW/PoS names are getting love again as liquidity rotates into “forgotten” alts, and Decred just ripped straight into a major 4H supply zone around 26–27. Big impulsive candle, volume uptick and price jumping above recent consolidation make this move hard to ignore.
On the 4H chart, price is parked right at that previous swing high block while RSI is stretched in overbought territory. I’m bullish overall, but this looks more like the end of a sprint than the start of one, so I’m leaning toward a pullback into support before the next leg up. Main demand sits around 23–24, with a nearer intraday shelf around 25–26 that could act as a shallow dip zone.
My base plan: I want to see either a clean retest and hold of 25–26 for a continuation toward 29–30, or a deeper flush into 23–24 where I’d look for fresh long entries ✅. If price loses 23 with strong selling, then the party’s over for a while and 21 and even 19 come back into play. I might be wrong, but chasing green candles into heavy resistance usually ends with you holding the bag, so I’m patient and waiting for the market to come to me.
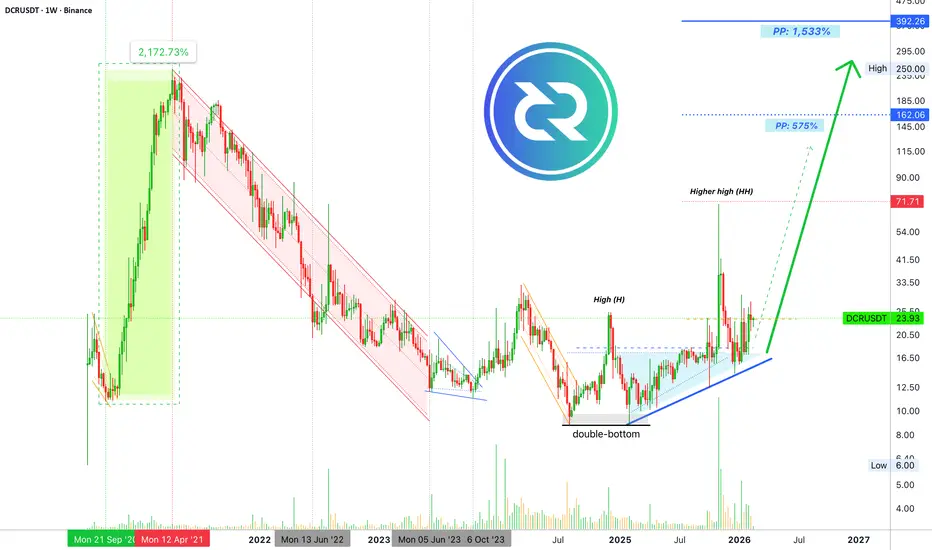
Decred, long-term higher highs and higher lows (PP: 1,533%)This is the one with higher highs and higher lows long-term. Notice how the other altcoins were very early when it comes to their uptrend. Actually, no uptrend at all, I showed mostly a lack of a downtrend and a clear bottom formation and transition period. This all leads to bullish action.
Here, DCRUSDT, the higher high is a long-term event. First comes December 2024 followed by November 2025. Almost an entire year to produce a higher high.
The usual, classic, signals are also present here. To gauge the strength of a bullish move, we need to consider the trading volume.
Is Decred's most recent higher high a true, real and valuable event when it comes to technical analysis and market signals? Yes. Why? Because the session that produced this signal came together with really high volume, the highest ever.
I know this might sound/read/feel kind of repetitive but please, bear with me, it should only last a few more days.
The long-term higher high leads to a retrace and this retrace ends as a higher low. Now the market is green again. When I say "market" within a certain chart, it means the pair in question and not the whole market.
This 'market' is bullish as it is growing after the classic retrace and higher low. And this is how we easily predict, based on market data—the information on the chart, that DCRUSDT (Decred) will continue to grow.
Since the market produced a double-bottom as part of the all-time low, we can expect not only a bullish wave but a complete, full-blown, bullish cycle. And this opens up huge potential for growth.
While an all-time high is not mandatory, this is what we are aiming for.
More details can be found on the chart.
Thank you for reading.
Namaste.
Decred is set to hit a target of $162 in a flash (PP: 560%)Later on, you cannot say that you weren't warned. I am reminding you now.
To say that this chart is extremely bullish would be a huge understatement. It would be a lie.
Which adjective goes beyond "extreme"? Hyper?
DCRUSDT (Decred) is hyper bullish right now... Everything points higher.
It has been rising since last year, February 2025. In November, it hit a target of $70 and after a retrace it started to produce higher lows. This gives us the chart we have today.
The current weekly session is full green and ready to perform another sudden fast huge bullish jump.
Since we have plenty of higher lows coupled with high volume and long-term growth, a higher high comes next. This opens up $162 as the next target, and this gives us more than 555% profits potential from current price on the next bullish jump.
Are you ready for a wild bullish wave?
I hope you are ready. You've been warned!
Namaste.
DCRUSDT 1D#DCR has bounced off the daily SMA200 with strong volume. Consider buying a small position only after a clean breakout above the descending resistance. If confirmed, the potential upside targets are:
🎯 $25.54
🎯 $29.04
🎯 $32.54
🎯 $37.52
🎯 $43.87
⚠️ Always apply tight stop-losses and maintain strict risk management.
DCRUSDT Forming Bullish MomentumDCRUSDT is forming a clear bullish momentum pattern, a classic bullish reversal signal that often indicates an upcoming breakout. The price has been consolidating within a narrowing range, suggesting that selling pressure is weakening while buyers are beginning to regain control. With consistent volume confirming accumulation at lower levels, the setup hints at a potential bullish breakout soon. The projected move could lead to an impressive gain of around 190% to 200% once the price breaks above the wedge resistance.
This bullish momentum pattern is typically seen at the end of downtrends or corrective phases, and it represents a potential shift in market sentiment from bearish to bullish. Traders closely watching DCRUSDT are noting the strengthening momentum as it nears a breakout zone. The good trading volume adds confidence to this pattern, showing that market participants are positioning early in anticipation of a reversal.
Investors’ growing interest in DCRUSDT reflects rising confidence in the project’s long-term fundamentals and current technical strength. If the breakout confirms with sustained volume, this could mark the start of a fresh bullish leg. Traders might find this a valuable setup for medium-term gains, especially as the pattern completes and buying momentum accelerates.
✅ Show your support by hitting the like button and
✅ Leaving a comment below! (What is your opinion about this Coin?)
Your feedback and engagement keep me inspired to share more insightful market analysis with you!
DCRUSDT Forming Falling WedgeDCRUSDT is forming a clear falling wedge pattern, a classic bullish reversal signal that often indicates an upcoming breakout. The price has been consolidating within a narrowing range after the recent decline, suggesting that selling pressure is steadily weakening while buyers are quietly stepping in to regain control. With consistent volume confirming accumulation at these lower levels, the setup is pointing toward a potential bullish breakout in the near term. If the price breaks decisively above the wedge resistance, the projected move could deliver an impressive gain of around 90% to 100% from the breakout point.
This falling wedge pattern is typically seen at the end of downtrends or during corrective phases, and it serves as a strong sign that market sentiment may be shifting from bearish to bullish. Traders closely watching DCRUSDT are observing a similar strengthening momentum as it approaches its own breakout zone. The healthy trading volume supporting the pattern adds real confidence, showing that market participants are getting positioned early in anticipation of a reversal.
The growing interest in DCRUSDT is fueled by increasing belief in the project’s long-term fundamentals combined with this attractive technical structure. A confirmed breakout backed by sustained volume could trigger the start of a fresh bullish leg. Traders might view this as a compelling setup for medium-term gains, especially once the wedge pattern fully resolves and buying pressure starts to accelerate.
✅ Show your support by hitting the like button and
✅ Leaving a comment below! (What is your opinion about this Coin)
Your feedback and engagement keep me inspired to share more insightful market analysis with you!
DCRUSDT Forming Falling WedgeDCRUSDT is forming a clear falling wedge pattern, a classic bullish reversal signal that often indicates an upcoming breakout. The price has been consolidating within a narrowing range, suggesting that selling pressure is weakening while buyers are beginning to regain control. With consistent volume confirming accumulation at lower levels, the setup hints at a potential bullish breakout soon. The projected move could lead to an impressive gain of around 190% to 200% once the price breaks above the wedge resistance.
This falling wedge pattern is typically seen at the end of downtrends or corrective phases, and it represents a potential shift in market sentiment from bearish to bullish. Traders closely watching DCRUSDT are noting the strengthening momentum as it nears a breakout zone. The good trading volume adds confidence to this pattern, showing that market participants are positioning early in anticipation of a reversal.
Investors’ growing interest in DCRUSDT reflects rising confidence in the project’s long-term fundamentals and current technical strength. If the breakout confirms with sustained volume, this could mark the start of a fresh bullish leg. Traders might find this a valuable setup for medium-term gains, especially as the wedge pattern completes and buying momentum accelerates.
✅ Show your support by hitting the like button and
✅ Leaving a comment below! (What is your opinion about this Coin?)
Your feedback and engagement keep me inspired to share more insightful market analysis with you!
DCR/USDT – Major Demand Zone: Accumulation or Breakdown?From a higher-timeframe perspective, DCR remains in a bearish / corrective structure after failing to sustain the previous distribution area following the impulsive rally. Price has now returned to a major historical demand zone (yellow block at 19 – 15.7), which previously acted as a strong base before a significant bullish expansion.
This zone is a critical decision area:
Holding → potential accumulation & reversal
Breaking → continuation of the bearish trend
---
Key Levels
Major Demand / Support:
🟨 19.0 – 15.7 (Yellow Zone)
Key Resistance Levels:
22.5
25.5
36.1
43.8
Previous Low: 13.3
Previous High: 70.0
---
Pattern & Structure Analysis
🔹 1. Descending Market Structure
Price continues to print lower highs and lower lows, confirming a broader bearish trend. However, the current price action shows compression and slowing momentum as it enters the demand zone.
🔹 2. Demand Zone Re-test
The yellow zone represents:
A former consolidation base
The origin of a strong impulsive bullish move
A re-test of such zones often triggers either a strong bounce or a decisive breakdown.
🔹 3. Possible Base Building / Early Accumulation
If price holds this zone and starts forming higher lows with increasing volume, the structure may evolve into an accumulation phase (early Wyckoff-style).
---
Bullish Scenario 📈
Valid if price holds above 15.7 and forms a higher low
Bullish Confirmation:
Strong rejection from the demand zone
Daily close above 22.5
Increasing volume on breakout
Bullish Targets:
🎯 22.5 (minor resistance)
🎯 25.5 (range high)
🎯 36.1 (major resistance)
🎯 43.8 (upper supply zone)
➡️ Bias: Accumulation → Trend Reversal
➡️ Optimal Buy Zone: 19 – 16
➡️ Risk: False breakout if volume remains weak
---
Bearish Scenario 📉
Valid if a strong daily close occurs below 15.7
Bearish Confirmation:
Breakdown of the major demand zone
Failed retest (support flips into resistance)
Bearish Targets:
🎯 13.3 (previous low)
🎯 Lower levels if selling pressure accelerates
➡️ Bias: Bearish continuation
➡️ Warning: A breakdown from a higher-timeframe demand zone often leads to fast expansion moves.
---
Conclusion
DCR is currently trading at a high-probability decision zone.
📌 The 19 – 15.7 area will determine whether price transitions into accumulation or continues its bearish trend.
Patience is key — wait for clear price action and volume confirmation before committing to aggressive positions.
---
#DCRUSDT #Decred #CryptoAnalysis #TechnicalAnalysis
#DemandZone #Accumulation #BearishTrend
#Altcoins #PriceAction #MarketStructure
DCRUSDT — Long-Term Downtrend Pressure vs Major Demand ZoneDecred (DCR) on the Weekly timeframe is still trading within a long-term bearish structure, characterized by a clear sequence of lower highs and lower lows since the 2021 peak. However, price is currently sitting inside a major historical demand zone at 14.5 – 11.5, which has repeatedly acted as a strong accumulation base in the past.
This zone is a critical decision area that will determine whether DCR can form a macro reversal or continue its long-term decline.
---
Pattern Explanation
1. Descending Trendline (Primary Resistance)
The descending yellow trendline represents a long-term bearish resistance originating from the 2021 all-time high.
Multiple breakout attempts have failed, with price consistently getting rejected and continuing lower.
2. Base Accumulation / Long-Term Demand Zone
The yellow box at 14.5 – 11.5 marks a strong demand area that:
Previously acted as major resistance
Hosted extended consolidation phases
Has absorbed selling pressure multiple times
This behavior suggests possible long-term accumulation.
3. False Breakout & Strong Rejection
The sharp impulse toward the 39–44 zone was followed by aggressive rejection, indicating a liquidity grab rather than a sustainable bullish breakout.
---
Key Levels
Major Support (Demand Zone): 14.5 – 11.5
Immediate Resistance: 17.5 – 18.5
Mid Resistance: 24.7 – 28.4
Major Resistance: 39.4 – 44.0
Long-Term Bullish Extensions: 67.8 – 104 – 179
---
Bullish Scenario
Price holds firmly above the 14.5 – 11.5 demand zone
A weekly higher low is formed
A confirmed weekly close above the descending trendline
Additional bullish confirmation if:
Price reclaims the 18 – 20 area
Volume expands during the breakout
Bullish Targets (Step by Step):
18.5 → 24.7 → 28.4
Long-term extensions toward 39 – 44, and potentially 67+ if the broader market cycle supports it
---
Bearish Scenario
Price fails to hold the 14.5 – 11.5 zone
A weekly close below 11.5
This breakdown would likely trigger:
Bearish continuation
Potential acceleration toward the 7 – 6 (ATL zone)
A loss of this demand area would confirm that the long-term bearish trend remains dominant.
---
Conclusion
DCRUSDT is currently trading at a make-or-break zone on the macro timeframe.
The 14.5 – 11.5 demand zone is the key level defining the next major move.
Holding above it → macro reversal potential
Breaking below it → bearish continuation risk
Until price breaks and holds above the descending trendline, patience and confirmation remain essential on the weekly timeframe.
---
#DCRUSDT #Decred #CryptoAnalysis #WeeklyChart #MacroAnalysis #Downtrend #DemandZone #SupportResistance #AltcoinAnalysis #PriceAction #MarketStructure #CryptoTrading
DCRUSDT 12H#DCR is moving inside a falling wedge pattern on the 12H timeframe. The price is trading above the 12H SMA200, which is a strong sign. In case of a breakout above the wedge resistance, the potential targets are:
🎯 $24.27
🎯 $27.98
🎯 $30.99
🎯 $33.99
🎯 $38.26
🎯 $43.71
❌ Invalidation: a 12H candle closing below the wedge.
⚠️ Always remember to use a tight stop-loss and maintain proper risk management.
DCRUSDT Forming Bullish Momentum DCR/USDT is starting to show very encouraging bullish momentum, suggesting that Decred (DCR) could be gearing up for a meaningful move. On-chain, price has held up after recent consolidation, and trading volume is climbing — signs that accumulation may be occurring and that bullish participants are stepping back in. This shift could set the stage for a breakout if DCR can push past its near-term resistance levels with strength.
From a fundamental standpoint, Decred is a deeply ambitious project. It’s built on a hybrid consensus model that combines proof-of-work with proof-of-stake, giving both miners and stakers a meaningful role in governance. This governance by stake model is central to its value, as holders can vote on protocol changes and budget allocations, making the network highly decentralized and community-driven. The supply dynamics also work in its favor: Decred has a capped maximum supply of 21 million DCR, with roughly 17 million currently in circulation, which supports scarcity.
Strategically, the key will be to watch for a clean breakout above consolidation. If DCR breaks higher on strong volume and holds that level, it would confirm genuine bullish conviction. A pullback to retest this breakout could offer an ideal risk-reward entry. On the downside, placing a stop just below the recent support zone would provide a defined invalidation point. Given the fundamentals and structural setup, the upside potential is compelling if the momentum continues to build.
DCR | This Crypto Is About To Pop | LONGDecred is Money Evolved.
By combining battle tested Proof-of-Work with an innovative take on Proof-of-Stake that places coin holders in charge of shaping the future, Decred is able to adapt to challenges and innovate at a rapid pace. You acquire influence in Decred by putting “skin in the game”.
Decred’s security, privacy, scalability, and decentralized treasury empower stakeholders and provides them with the tools needed to enhance their financial sovereignty.