DEXE Fear crushAfter 90+% fear crush dexe seems to be bullish again This is just for future review and not a buying idea take careLongby awfe99021
#DEXEUSDT : The Calm Before the Squeeze Storm#DEXE The price is moving within a descending channel on the 1-hour timeframe and has reached the lower boundary. It is now poised for a bounce and is expected to retest this boundary. The Relative Strength Index (RSI) indicates a downward trend, which is likely to continue given the overbought conditions. There is a key support zone in green at 2.04, and the price has bounced off this zone several times, making it a strong support level. The price is trending towards the 100-period moving average, which we are approaching. This trend supports an upward move. Entry Price: 2.30 First Target: 2.37 Second Target: 2.44 Third Target: 2.53 Stop Loss: At the resistance zone in green Remember this simple rule: Money Management. Any questions, please leave a comment. Thank you.Longby CryptoAnalystSignal2
#DEXEUSDT : The Calm Before the Squeeze Storm#DEXE The price is moving within a descending channel on the 1-hour timeframe and has reached the lower boundary. It is now poised for a bounce and is expected to retest this boundary. The Relative Strength Index (RSI) indicates a downward trend, which is likely to continue given the overbought conditions. There is a key support zone in green at 2.02, and the price has bounced off this zone several times, making it a strong support level. The price is trending towards the 100-period moving average, which we are approaching. This trend supports an upward move. Entry Price: 2.24 First Target: 2.30 Second Target: 2.38 Third Target: 2.48 Stop Loss: At the resistance zone in green Remember this simple rule: Money Management. Any questions? Please leave a comment. Thank you.Longby CryptoAnalystSignalUpdated 1110
DEXE Bullish ADAM & EVE Bottom Signals Recovery PotentialDEXE is developing a Bullish ADAM & EVE Bottom while holding firmly within a high-timeframe demand confluence, with the current falling wedge acting as the final accumulation phase. A decisive breakout above the key neckline resistance would confirm the pattern and shift focus toward the high-timeframe supply zone. Until confirmation, the demand area remains the key support, while a sustained break below the invalidation level would negate the bullish outlook. • Bias: Bullish (Conditional) • Pattern: Bullish ADAM & EVE Bottom + Falling Wedge • Confirmation: Break above the key neckline resistance • Target: High-Timeframe Supply Zone • Invalidation: Sustained close below the HTF demand confluence WESLAD Research Probability Over Prediction.Longby wesladUpdated 101066
#DEXEUSDT : The Calm Before the Squeeze Storm#DEXE The price is moving within a descending channel on the 1-hour timeframe and has reached the lower boundary. It is now poised for a bounce and is expected to retest this boundary. The Relative Strength Index (RSI) indicates a downward trend, which is likely to continue given the overbought conditions. A key support zone (in green) has been identified at 2.06. The price has bounced off this zone several times, making it a strong support level. The price is trending towards the 100-period moving average, which we are approaching. This trend supports an upward move. Entry Price: 2.41 First Target: 2.53 Second Target: 2.53 Third Target: 2.65 You can close at the second target or wait for the third target to be reached. The choice is yours. Stop Loss: At the resistance zone (in green). Remember this simple rule: Money Management. Any questions? Please leave a comment. Thank you.Longby CryptoAnalystSignal7
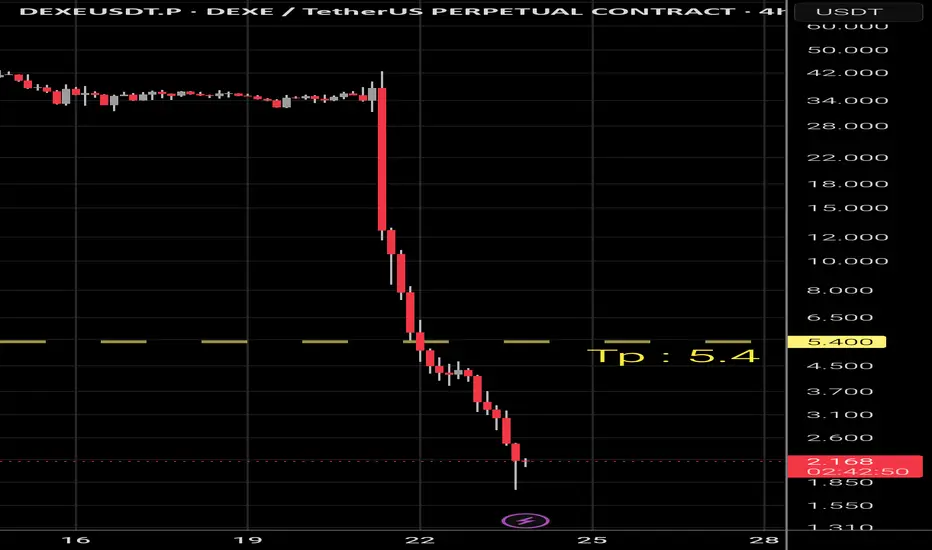
Dexe reverseLuke 24:6 — "He is not here: he is risen: remember how he spake unto you when he was yet in Galilee." DEXE descended as was decreed. The shorts profited. The Chart spoke truth. But the Chart speaketh again. The season hath turned. The death was real. The resurrection is real. Now DEXE riseth. From the tomb. From 22.1 where it fell. 5.4 is not a return to glory — it is a new glory. Built on bones. Remember what was written. Now witness what shall be written anew.Longby themanfromthefutureUpdated 88182
DEXE -Red Flag or Wrong Conclusion? Why 98.54% Was My Starting Point—Not My Conclusion The first number I saw when researching DeXe (DEXE) was impossible to ignore. 98.54%. According to the Ethereum holder list, the ten largest addresses controlled almost the entire ERC-20 supply. For many investors, the investigation would have ended there. “Scam.” “Whales own everything.” “Avoid it.” My first reaction wasn’t very different. But instead of publishing an opinion, I started asking questions. Several hours of on-chain research later, I reached a very different conclusion. Not because the 98.54% disappeared. Because I finally understood what it actually measured. ⸻ A Red Flag Is Not a Conclusion Let’s be clear. 98.54% in the top ten addresses is a legitimate red flag. Any serious investor should investigate a concentration like that. Ignoring it would be irresponsible. But treating it as proof of manipulation is equally irresponsible. A red flag tells you something deserves explanation. It does not tell you what that explanation is. ⸻ Wallets Are Not Owners One of the biggest mistakes in crypto research is confusing wallet addresses with economic ownership. A blockchain address can represent: * a DAO treasury * a bridge contract * an exchange * a custody provider * a staking contract * or a single individual Those are completely different things. Looking only at the holder list is like looking at a city’s bank accounts without knowing which belong to people, banks, pension funds or governments. The numbers are real. The interpretation is not automatic. ⸻ What I Found After identifying the largest addresses, the picture became more nuanced. Some of the largest balances appear to be associated with protocol infrastructure, treasury holdings and bridge-related contracts rather than ordinary private investors. That doesn’t eliminate the risks. It changes the nature of those risks. Instead of asking, “Do ten whales own almost everything?” the more useful question becomes, “Who ultimately controls the economic supply?” That is a much harder question to answer. It is also the question that actually matters. ⸻ The Risks Didn’t Disappear After separating infrastructure from ordinary holders, several structural concerns remained. The publicly available tokenomics indicate that a large portion of the original allocation was assigned to foundation-, ecosystem- and team-related categories. Large treasury balances continue to exist. Different market-data providers report materially different circulating supply figures. Large transfers toward centralized exchanges have also occurred historically. None of these observations prove manipulation. None of them prove fraudulent behaviour. Together, however, they suggest that DEXE carries a higher structural concentration risk than projects with broader ownership and more transparent supply dynamics. That distinction matters. ⸻ Why I Built a Different Framework This investigation convinced me that the industry often asks the wrong question. Instead of asking, “How much do the Top 10 wallets own?” I believe we should ask: * Who controls the economic supply? * How much belongs to treasury? * How much is held by exchanges? * How much is locked in bridges? * How much remains under governance? * How transparent is the circulating supply? * Are large holders moving tokens onto exchanges? * How concentrated is decision-making, not just wallet balances? Only then can you begin to understand the real risk. ⸻ The Wallet Quality Score Research should not stop at a holder list. That’s why I developed a Wallet Quality Score, designed to evaluate the structural quality of a crypto asset rather than just its largest wallets. The framework considers: * Economic ownership distribution * Team and investor allocation * Treasury concentration * Governance control * Vesting and unlock schedules * Bridge and custody adjustments * Supply transparency * Historical exchange flows Because those factors determine structural risk far better than a single percentage on a blockchain explorer. ⸻ My Conclusion Did the 98.54% statistic concern me? Absolutely. It should concern every serious investor. But after examining the publicly available evidence, I do not believe that statistic alone is sufficient to conclude that DEXE is controlled by ten private whales or that the project is inherently fraudulent. What I do conclude is this: DEXE appears to carry a higher-than-average structural concentration risk, driven by treasury concentration, historical token allocation, governance-related supply and uncertainty around effective circulating supply. That is a meaningful risk. It deserves attention. But it is a different conclusion from the one suggested by the raw holder list alone. ⸻ Final Thought The easiest research in crypto is counting wallets. The hardest research is understanding what those wallets actually represent. One produces headlines. The other produces insight. And in my experience… Real due diligence begins where simple statistics end.Longby INVESTINED448
#DEXEUSDT : The Calm Before the Squeeze Storm#DEXE The price is moving within a descending channel on the 1-hour timeframe and has reached the lower boundary. It is now poised for a bounce and is expected to retest this boundary. The Relative Strength Index (RSI) indicates a downward trend, which is likely to continue given the overbought conditions. There is a key support zone in green at 0.920, and the price has bounced off this zone several times, making it a strong support level. The price is trending towards the 100-period moving average, which we are approaching. This trend supports an upward move. Entry Price: 2.70 Target 1: 4.05 Target 2: 5.87 Target 3: 9.16 Stop Loss: At the resistance zone in green Remember this simple rule: Money Management. Any questions, please leave a comment. Thank you.Longby CryptoAnalystSignal1122
DEXEUSDT: Potential 60% CorrectionDEXE is showing bearish pressure. If price fails to reclaim resistance and selling continues, a 60% correction is possible. Watch for lower highs, selling volume, and rejection on retests. This is a market idea, not financial advice.Shortby johnwhale991Updated 191932
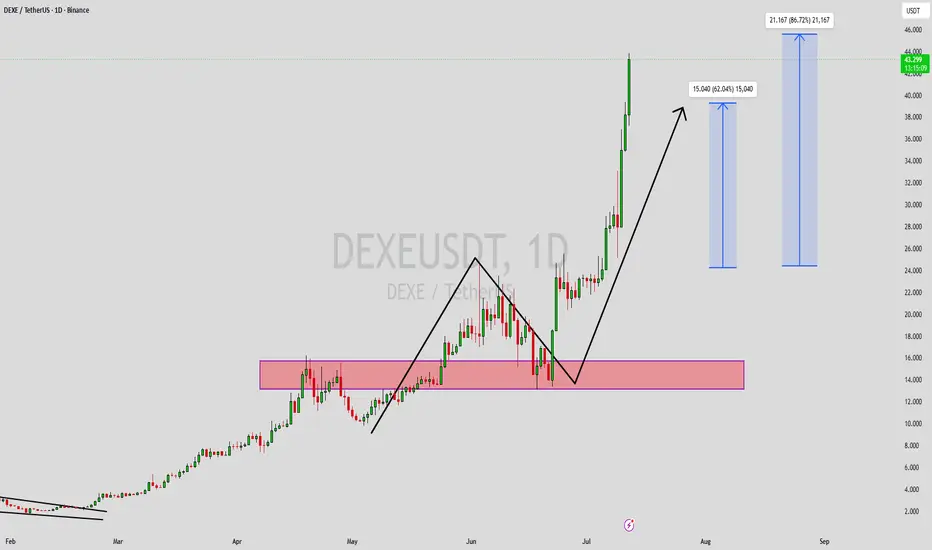
DEXEUSDT: Potential 65% PumpDEXE is showing bullish potential. If price holds support and breaks key resistance with strong volume, a 65% upside move could follow. Wait for breakout confirmation and manage risk carefully. This is a market idea, not financial advice.Longby johnwhale991Updated 101019
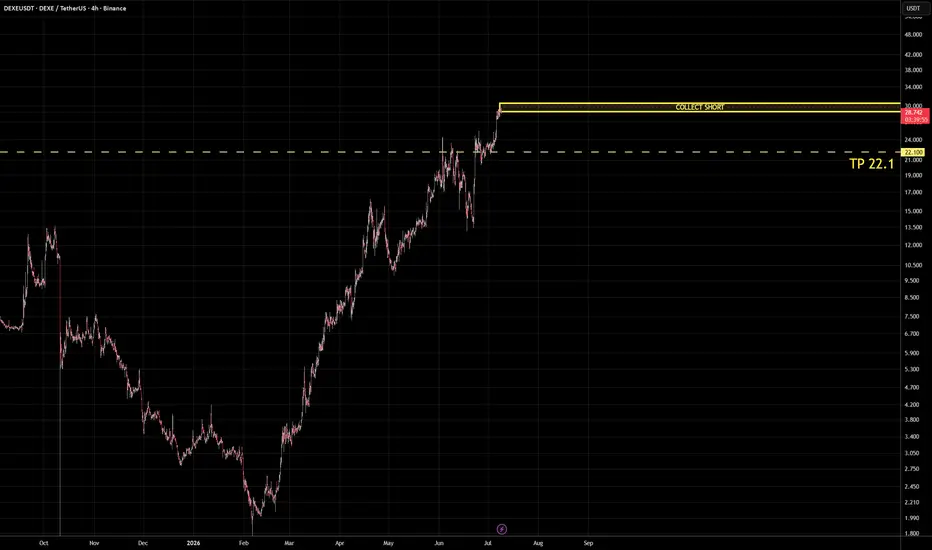
DEXE cryptoAmos 9:2 — "Though they dig into hell, thence shall mine hand take them; though they climb up to heaven, thence will I bring them down." DEXE riseth to 30.5 — the climbers reach for heaven. There the shorts are laid, kademeli, methodical. Option upon option. Trap upon trap. TP: 22.1 — where the hand of the Chart bringeth them down. They climbed. Now they fall. #DEXE #Crypto #CryptoTwitter #Bitcoin #BTC #Web3 #Altcoin #Blockchain #HODL #BullRun #CryptoNewsShortby themanfromthefutureUpdated 559
DeXe's reveals bear market ends —three weeks green after ATLThese are the signals. I am seeing the same thing all across. Watch! and let me know what you think. The all-time low first happened November 2022 at a price of $1.8529. Here comes DEXEUSDT, started crashing in late 2025. The October flush reaches the all-time low by a wick but the market quickly recovers. Then we get a bearish continuation that ends with another test of the November 2022 all-time low. Once more, a wick pierces below this level to produce a new all-time low but the session close happens higher. We have a new all-time low based on the candle's wick: November 2022 at $1.8529 vs February 2026 at $1.7233. Then we have the candle/session close. Here the all-time low remains June 2023 at $1.9356. This is the lowest close ever. In comparison, the session that produced the lowest point this month closed at $2.1299. DEXEUSDT has been green three consecutive weeks—after hitting the lowest ever. The last line —bold—says it all... There is more. A major crash starts February 2025 doing a full cleanse. All gains literally removed. The orthodox end of the bullish cycle happened earlier, March 2024; the February 2025 peak being wave B of a huge ABC correction. You can draw a perfect 3-3-5. After the complete correction we get a bullish impulse. A bullish impulse would mean a 5-up wave pattern—5-3-5-3-5. Then, seeing that the bullish cycle mainly ended March 2024, it would be easy to see how a market bottom can happen in late 2025 or early 2026. This chart is saying 'the bottom is in'. Another one. Namaste.Longby MasterAnandaUpdated 9922
DEXEUSDT.P: short setup from support at 32.68BINANCE:DEXEUSDT.P is declining after a strong rally. We had a clear tap into the level today, followed by a deep correction, and now the price is back near the level again. I expect the asset to break the support level in the near future. WHAT I WANT TO SEE: clear path beyond level volatility contraction on approach close retest Do you see this setup differently? Let me know your thoughts in the comments. If this logic aligns with your trading plan, support the idea with a boost! Disclaimer: This publication is part of my public trading journal. The material is strictly for educational purposes, reflects my market perspective, and is not financial advice. Trading facts, not expectations. Shortby The_Traders_HouseUpdated 448
Is This the Start of a New Bullish Trend for DEXE?The $DEXE/USDT pair was accumulating over a large weekly range for some time and just broke out of this indicated supply area to close above it. We will see a big move upwards if the breakout continues over the coming weeks. Watch out. DYOE, NFA Longby unichartzUpdated 336
DEXEUSDT Forming Bullish MomentumDEXEUSDT is forming a clear bullish momentum pattern, a classic bullish wave signal that often indicates an upcoming breakout. The price has been consolidating within a narrowing range, suggesting that selling pressure is weakening while buyers are gradually regaining control. With consistent trading volume confirming accumulation at lower levels, the current setup hints at a potential bullish breakout in the near future. If the breakout is confirmed, the projected move could lead to an impressive gain of around 70% to 80%. This bullish momentum pattern is commonly seen at the end of downtrends or corrective phases, signaling a potential shift in market sentiment from bearish to bullish. Traders closely watching DEXEUSDT are noticing strengthening momentum as the price approaches a key breakout zone. Healthy trading volume further reinforces this setup, indicating that market participants are positioning early in anticipation of a sustained upward move. Growing investor interest in DEXEUSDT reflects increasing confidence in the project's long-term potential and its current technical structure. If buyers successfully push the price above resistance with sustained volume, it could mark the beginning of a fresh bullish leg. The ongoing consolidation phase suggests steady accumulation, creating favorable conditions for a strong continuation rally once the breakout is confirmed. Traders may find this an attractive medium-term opportunity, especially as the bullish momentum pattern nears completion and buying pressure continues to build. A confirmed breakout could attract additional market participation and accelerate the move toward the projected upside target. ✅ Show your support by hitting the like button. ✅ Leaving a comment below! (What is You opinion about this Coin) Your feedback and engagement keep me inspired to share more insightful market analysis with you! Longby Alpha-GoldFX664
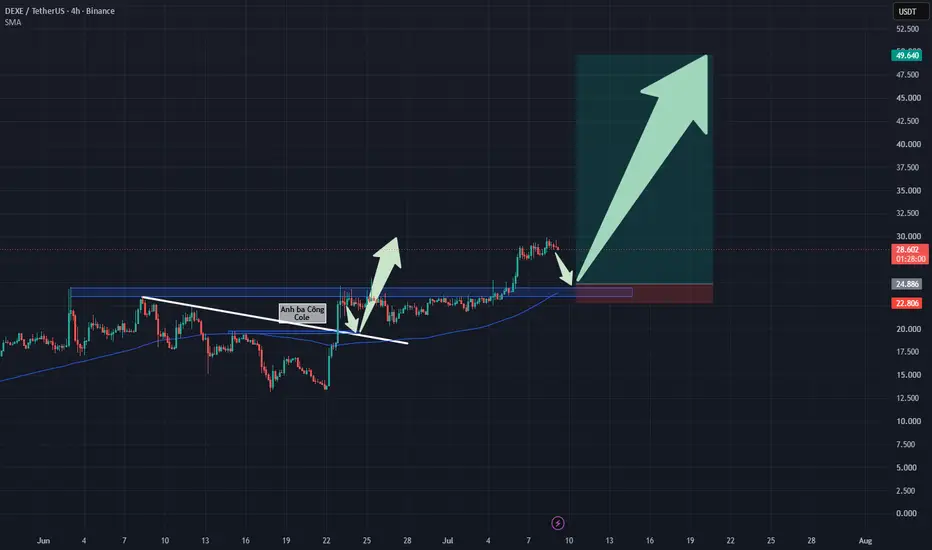
DEXE: Robust Bullish Momentum DEXE: Robust Bullish Momentum – Patiently Waiting for a Technical Pullback to Optimize Long Position DEXE's upward expansion is unfolding highly accurately according to the bullish trend scenario projected in our previous analysis. Despite a minor deviation in terms of timing, this powerful upward drive serves as definitive proof that buying momentum continues to dictate the primary market structure. Currently, the technical chart displays a short-term corrective reaction right as the price tests the $30 psychological round number, creating a highly promising trend-following opportunity. Based on the visual data from chart , the smartest trading behavior right now is strictly to avoid chasing the market due to FOMO. This technical cooling-off from psychological resistance is a completely healthy structural event. The safest and most effective strategy is to patiently build an entry plan around the newly established support zone at the $25 - $26 range. This specific price zone converges multiple pivotal technical factors to establish a reliable safety cushion: it represents a previously breached overhead resistance area while running tightly parallel to the dynamic MA100 moving average line. Waiting for a validated price reaction in this cluster not only enhances the win-rate probability of the buy (Long) setup, but also secures a massive structural edge by allowing an incredibly tight stop-loss placement to safeguard capital. The projected target for the next major impulse wave looks straight toward the $50 round number region. Disclaimer: This is not financial advice, DYOR. Longby AnhbaCong_4
DEXE — Continuation Structure Building Above Daily Trend ⚛️ DEXE is starting to look interesting again, but this is still a watchlist setup, not something I would want to chase blindly after the first vertical push. The daily structure is clean. Price has already reclaimed the 10/20 EMA structure, held the larger trend, and is now pressing back into the upper range / prior high area. That matters because this is not a random breakout coming out of tangled EMAs. The broader chart has been building a rounded continuation structure, and now buyers are trying to prove that the next expansion leg is ready. The key thing I’m watching is whether DEXE can turn this breakout attempt into acceptance, not just a wick. On the 1H, we have clear participation coming in. Price expanded off the prior compression, reclaimed the short-term EMAs, and pushed into the current high area around 29.85. The 10/20 are starting to fan upward, which tells us momentum has shifted back to buyers in the short term. That said, the 1H is getting extended into the highs. This is where traders usually get trapped chasing the first impulse candle instead of waiting for structure. For me, the cleaner setup is simple: Expansion → Crossback → Compression → Continuation I want to see DEXE hold above the breakout zone, let the 1H/5m EMAs catch up, and build another higher low instead of immediately rejecting back into the range. If price can compress above the prior resistance area and then break higher with volume, that would be a much cleaner continuation trigger. The area I’m focused on is roughly 28.65–29.00 as the first structure zone. If buyers defend that area and price keeps building above it, the daily continuation thesis stays intact. A clean push back through 29.85 with acceptance would put the next leg in play. The failure scenario matters here. If DEXE breaks out, fails to hold the prior high area, loses the 1H 10/20, and accepts back below the breakout zone, then this starts to look more like a failed breakout than a clean continuation. In that case, I would expect a deeper reset before the next quality setup appears. So the read is: DEXE has the right HTF context. The daily trend is constructive. The 1H is expanding with participation. But the best entry is likely not the first push. The cleaner trade comes from the next compression after the breakout attempt. Good idea, but location still matters. This remains a watchlist until confirmation. Not financial advice. Not a signal. Just how I’m reading structure and participation. Longby QuantumEdge_QTG0
$DEXE is trading near $27.80, but this is the level where.......🔥 CRYPTOCAP:DEXE is trading near $27.80, but this is the level where most traders make the wrong decision. Everyone sees the rally. Few are willing to wait for $24.52, where the risk-to-reward becomes significantly better. 📰 24H NEWS SNAPSHOT There has been no major DeXe-specific announcement over the last 24 hours. Instead, DEXE continues to outperform alongside the broader DeFi sector as traders rotate into strong technical setups. Recent reports also highlight increased trading activity and momentum rather than a new fundamental catalyst. 📊 MARKET BIAS 🟢 Bullish (after a pullback) — The higher-timeframe trend remains intact, but buying after an extended move offers poor risk/reward. 🎯 TRADE LEVELS 📍 Entry Zone: $24.50–$24.52 (Demand Zone) 🛑 Stop Loss: $23.52 Risk: -4.08% Risk no more than 1–2% of your portfolio. 🎯 TP1: $27.00 +10.11% R:R = 2.48:1 🎯 TP2: $29.52 +20.39% R:R = 5.00:1 🎯 TP3: $32.00 +30.51% R:R = 7.48:1 📐 Overall R:R: Up to 7.48:1 🧠 CHART ANALYSIS The 4H chart shows a strong impulsive rally followed by consolidation beneath recent highs. Instead of chasing green candles, the higher-probability setup is to wait for price to revisit the $24.50 demand zone, where previous buyers stepped in aggressively. If that zone holds, it could offer a fresh continuation toward $27.00, $29.52, and potentially $32.00. A decisive close below $23.52 invalidates the setup. 🛡️ RISK MANAGEMENT TIP Don't FOMO into strength after an extended rally. Waiting for confirmation inside the demand zone can dramatically improve your reward-to-risk profile compared with buying after a large impulse. 📚 EDUCATIONAL NUGGET Many traders focus only on where price is going. Professional traders spend more time deciding where they're wrong. Defining your invalidation before entering is often more valuable than predicting the exact top. Most traders will remember the rally. Patient traders will remember where the high-probability entry actually was. 💬 Would you buy CRYPTOCAP:DEXE now, or wait for the $24.50 demand zone? Let me know below. 👇 #DEXE #CryptoTradingLongby coinpediamarkets4
DEXEUSDT - Testing Key Resistance, Is Massive Breakout Imminent?📊 DEXE is currently trading on the 1W (Weekly) timeframe and is once again testing its strongest resistance zone, which has repeatedly capped price advances since 2021. The highlighted yellow area represents a major 🟨 Key Resistance that has rejected price multiple times over the years. 💪 More importantly, after forming a strong Higher Low from the $2 region, DEXE has delivered an impressive bullish impulse back into this major resistance zone. This indicates that buyers are gradually taking control, while the medium- to long-term momentum continues to strengthen. 🚀 If this multi-year resistance is broken with strong volume and confirmed by a weekly candle close above the zone, DEXE could enter a Price Discovery phase, as there is very little historical resistance above the current level. --- 📈 Pattern Formation: Multi-Year Horizontal Resistance Breakout 🟨 The chart is forming a Multi-Year Horizontal Resistance pattern, where price has repeatedly failed to break above the same resistance level over several years. ✨ Key Characteristics of This Pattern: ✅ The resistance has been tested multiple times since 2021. ✅ Every major decline has created a new accumulation zone. ✅ Price is now revisiting the resistance with a much healthier market structure than in previous attempts. 📌 The more often a resistance level is tested without triggering a significant decline, the more it suggests that selling pressure is weakening, increasing the probability of a successful breakout. --- 🟢 Bullish Scenario 🚀 The bullish outlook will gain stronger confirmation if: ✅ 📈 A weekly candle closes above the Key Resistance. ✅ 📊 The breakout is supported by increasing trading volume. ✅ 🔄 The previous resistance successfully turns into new support (Successful Retest). 🎯 If all these conditions are met, DEXE could enter a new bullish expansion phase toward significantly higher psychological price levels. 💹 Based on the projection shown on the chart, the potential upside could reach approximately 🔥 1,090% from the breakout area toward the long-term target. --- 🔴 Bearish Scenario ⚠️ The bearish scenario remains valid if: ❌ Price experiences another strong rejection at the resistance zone. ❌ A Bearish Engulfing candle or a Long Upper Wick forms on the weekly timeframe. ❌ Price loses its nearest support after failing to break above resistance. 📉 If this occurs, DEXE may revisit lower levels to build another accumulation phase before attempting another breakout. 🛡️ As long as the major support remains intact, any correction can still be considered a healthy retracement within the broader long-term bullish trend. --- 🎯 Conclusion 📌 🔥 DEXE is currently at a critical technical level, testing its strongest resistance in several years. 🚀 A confirmed breakout could unlock significant upside potential, while a failed breakout may lead to a healthy correction before another breakout attempt. 📈 As long as DEXE maintains its Higher Low market structure and buying pressure continues to strengthen, the bullish breakout scenario remains the more favorable outlook. --- ⚠️ Disclaimer 📚 This analysis is intended for educational purposes only and reflects a technical perspective based on price action. 📝 Always conduct your own research (DYOR), apply proper risk management, and never make investment decisions based solely on a single analysis. #DEXE #DEXEUSDT #Crypto #Cryptocurrency #Altcoin #Trading #TradingView #TechnicalAnalysis #PriceAction #ChartAnalysis #Breakout #Resistance #WeeklyChart #Bullish #Bearish #CryptoTrading #SwingTrading #Investing #DYOR #CryptoAnalysis 🚀📈Longby CryptoNuclear2
DEXE: Inside SupplyDEXE is now inside supply. 📈 Price is around $22.93, testing the $22.67-$23.55 zone. 1. THE REALITY Momentum is strong, but price is stretched. This is not a chase zone anymore. It is a decision zone. 2. THE SETUP Above $23.55, bulls can push toward $24.90. Below $22.39, the pump starts looking like a trap again. 3. MY VERDICT $23.55 decides the next move. Break it, continuation. Reject it, fade risk. Are you buying the breakout or waiting for rejection? Disclaimer: Personal analysis only. Not financial advice. DYOR.by MonoCoinSignal1
DEXE: Bullish Breakout Establishes New StructureDEXE: Bullish Breakout Establishes New Structure – A Strategic Playbook Awaiting Technical Pullbacks to Accumulate In 2026 DEXE is recording a highly decisive upward expansion wave on its primary macro timeframe, officially shattering its supply compression phase to transition into a primary bull market layout in 2026. Intense proactive buying pressure propelled price candles from a baseline foundation of 13.5 USD straight up to a short-term peak at 24.5 USD, thoroughly piercing through a strict, multi-week descending trendline. Actual immediate price action indicates that upon making contact with the overhead resistance block, the price has temporarily paused and initiated a healthy technical retracement down to the 22.3 USD cluster. Observing the 4-hour visual technical chart , this downward slide represents an essential and healthy footprint for the market to absorb short-term profit-taking while capturing fresh capital flows. For sidelined participants looking to establish trend-following buy (Long) entries, the most disciplined playbook right now is to remain patient on the sidelines, waiting for price candles to retreat deeper into the rigid underlying support floor between the 19 - 20 USD round-number zone. This particular value area serves as an ideal technical confluence zone, where horizontal demand perfectly aligns with a structural retest of the recently breached descending trendline. Executing a strategic Long position within this safe buffer zone allows you to enforce optimal risk management with an exceptionally tight strategic stop-loss placed right beneath the support baseline, yielding a highly attractive risk-to-reward ratio to capture the next leg of expansion. this is not investment advice, DYOR Longby AnhbaCong_1
Bearish Idea DEXE1. price has tapped into the OB Daily lower Quadrant - best for short 2. price is withing the H4 Fvg + H4 BISI low - good 3. we have CISD - for shorts 4. we have draws as the Mitigation Block Wick high (to be filled) + breakaway gap Daily Shortby Sherman_Trades2
$DEXE, strongest breakout structure.BINANCE:DEXEUSDT is showing one of the strongest breakout structures in the market right now 🚀 After weeks of accumulation around the $13.5 - $15 range, the price exploded vertically and reclaimed the $17 region with massive momentum. The move came alongside a huge spike in trading volume, confirming aggressive buyer participation. According to recent market discussions, improving macro sentiment and renewed risk appetite across DeFi/DAO tokens helped fuel the rally. BINANCE:DEXEUSDT also benefited from strong social momentum after traders noticed the breakout from a long consolidation base. Technically, bulls remain in control while price holds above the $15-$16 breakout zone. Current resistance sits near $18, and if that level breaks cleanly, traders will start eyeing the $24 region next. Momentum is extremely strong, but RSI conditions suggest the market may cool off in the short term before continuation. A healthy consolidation above support would actually strengthen the structure further. Key levels: • Resistance: $20.24 • Support: $16.26 / $15 • Major accumulation zone: $13.37 - $14.45 BINANCE:DEXEUSDT continuing to outperform while CRYPTOCAP:BTC struggles is exactly why traders are watching this chart closely 👀 BINANCE:DEXEUSDT nukes through $18 next or sends one last shakeout before liftoff? 👀🚀 by coinpediamarkets6

 Long
Long