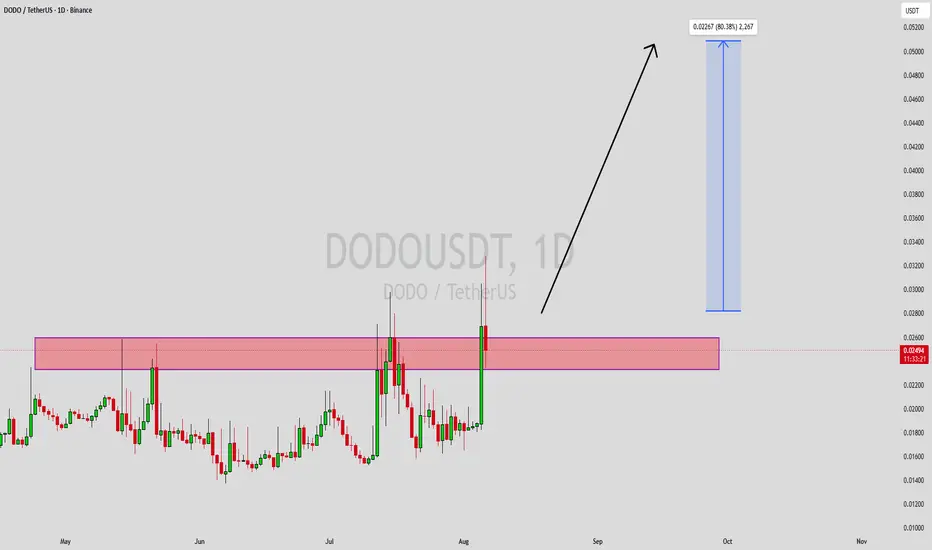
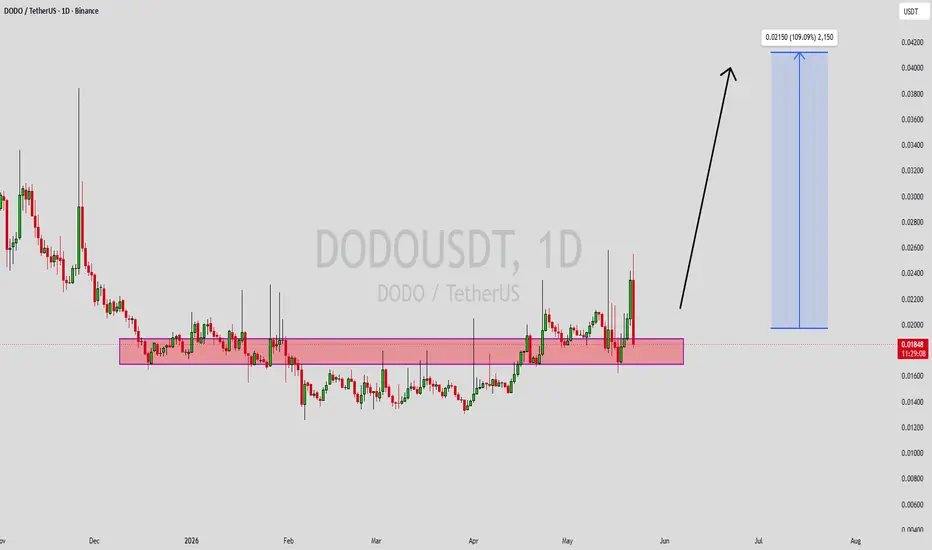
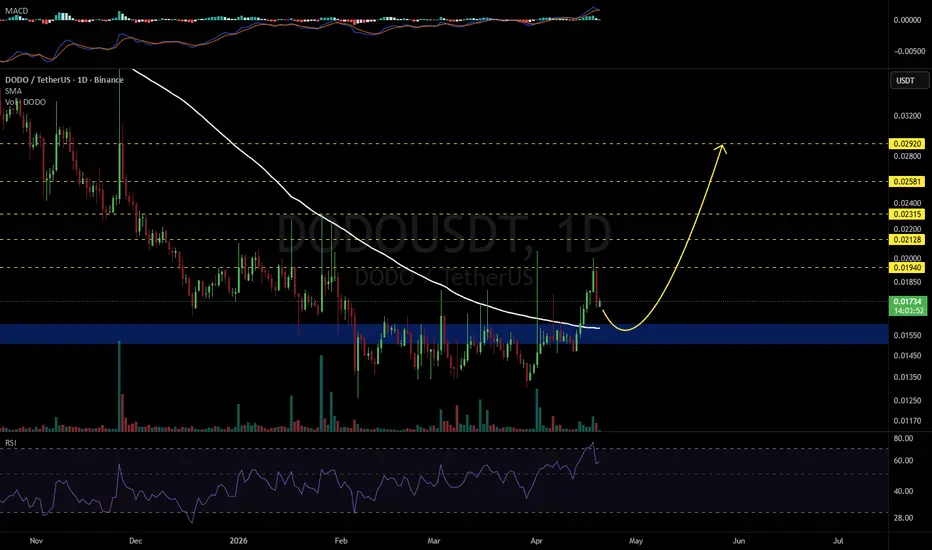
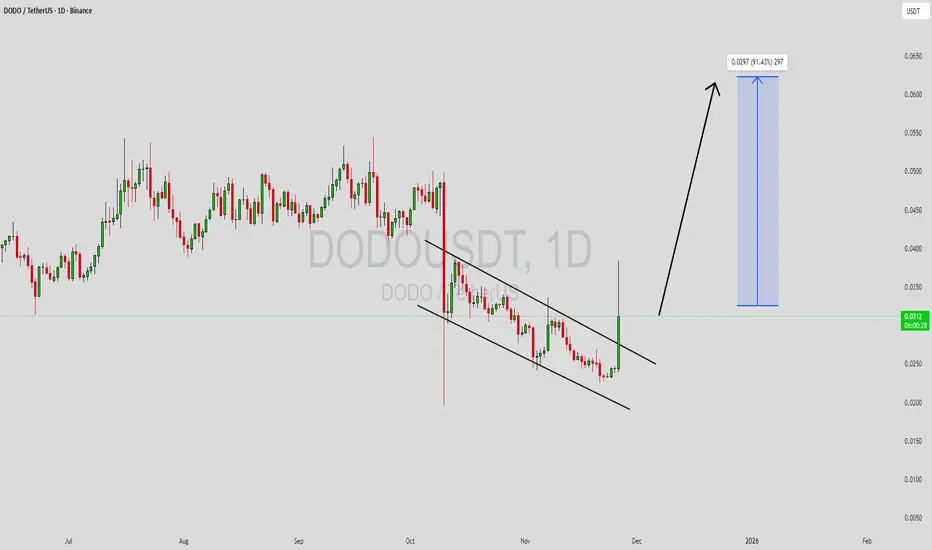
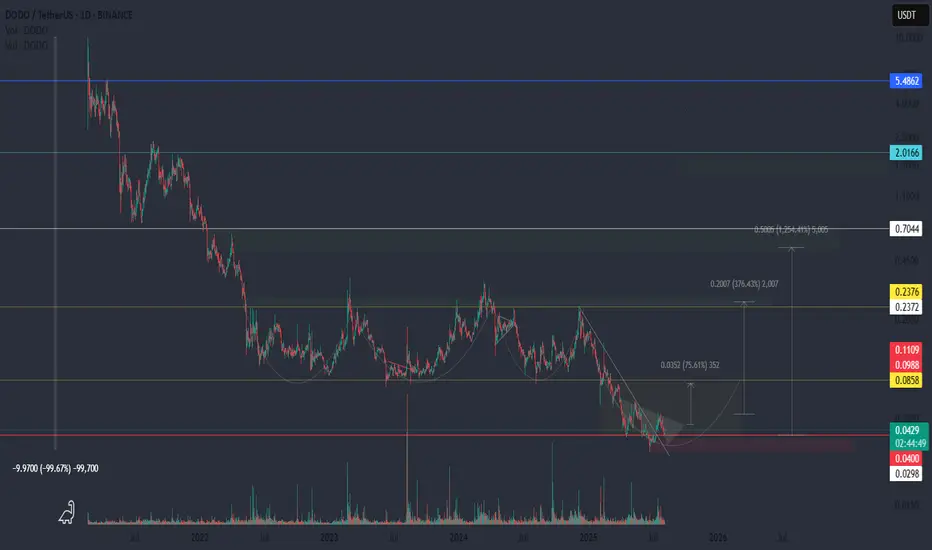
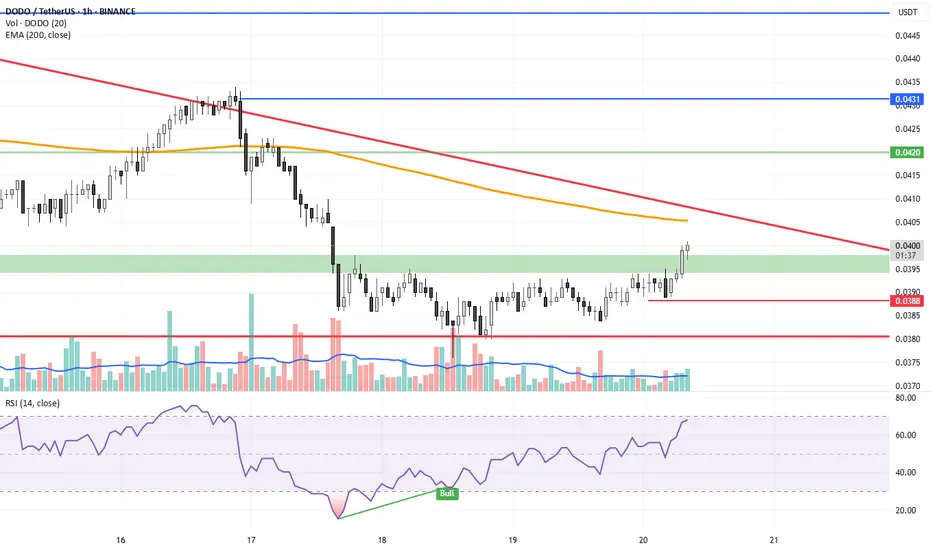
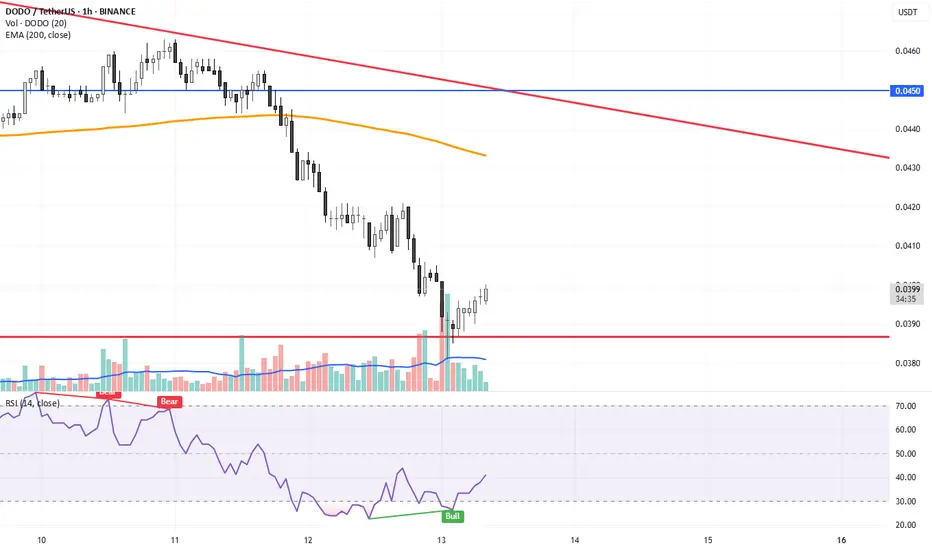
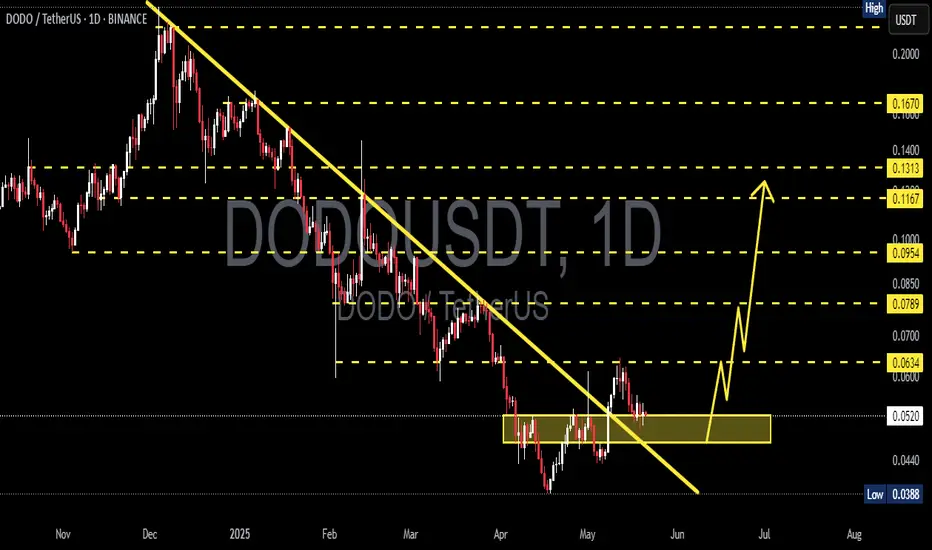
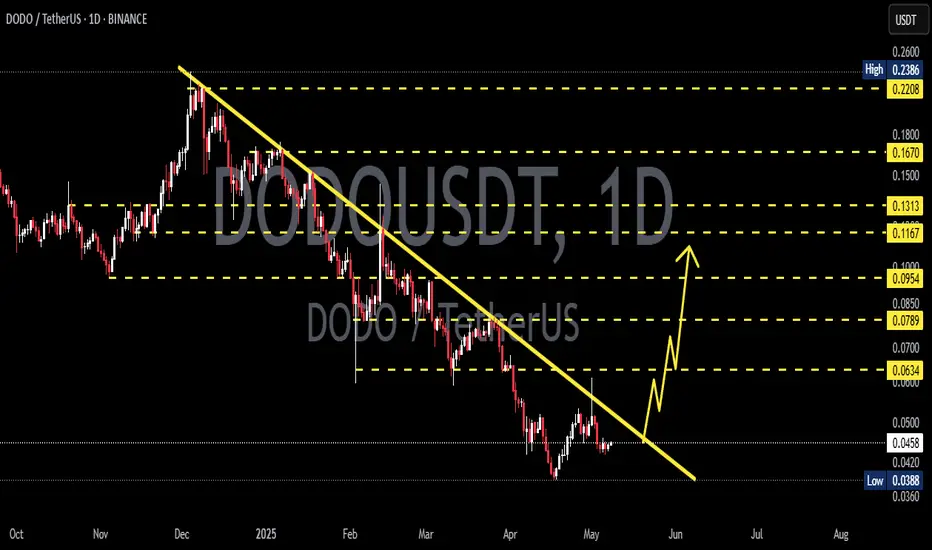
DODO CAN SUPRISE THE MOST WITH A BREAKOUT..Depending on trend data and Zone X DODO can enter into a new breakout.
We will follow the trend on the lower time frame and see how far the trend can go.
There is expecting for new increase trend on short term trend 20%+ is a possiblity, longer term data should prove, but unexpected suprise can happen since the increase of volume.
DODO / Tether
No trades
No trades
In-depth trading ideas
DODO — Breakout or Breakdown?DODO/USDT has been trading within a prolonged downtrend, characterized by persistent selling pressure and a sequence of lower highs. However, the price action is beginning to show signs of consolidation near the lower end of its historical range.
📉 Descending Resistance: The yellow descending trendline represents the dominant bearish structure. Sellers have repeatedly limited upside movements, keeping the broader trend under pressure.
📈 Ascending Support: The rising yellow support line connect
DODO Finance, Go LONG! (PP: 660% - 925%)8 months with a rising bottom, higher lows. 8 months ago the downtrend ended. DODOUSDT is producing bullish consolidation. This type of move leads to a strong advance, one of those sudden jumps that can lead to three digits green to start followed by a prolonged uptrend. It is a very long build-up process, almost an entire year and the bullish break is not present yet, it is early for this project.
The market always offers a second chance and endless opportunities. Some projects are trading hig
DODOUSDT Forming Bullish MometumDODOUSDT is forming a clear bullish momentum pattern, a classic bullish wave signal that often indicates an upcoming breakout. The price has been consolidating within a narrowing range, suggesting that selling pressure is weakening while buyers are beginning to regain control. With consistent volume confirming accumulation at lower levels, the setup hints at a potential bullish breakout soon. The projected move could lead to an impressive gain of around 60% to 70% once the price breaks above the
DODOXUSDT Forming Bullish MomentumDODOXUSDT is forming a clear bullish momentum pattern, a classic bullish wave signal that often indicates an upcoming breakout. The price has been consolidating within a narrowing range, suggesting that selling pressure is weakening while buyers are beginning to regain control. With consistent volume confirming accumulation at lower levels, the setup hints at a potential bullish breakout soon. The projected move could lead to an impressive gain of around 50% to 60% once the price breaks above th
DODO Trades at bottom range—perfect entry zone & bull marketDODOUSDT is trading close to its all-time low with high bullish potential. This is a perfect entry zone in anticipation of a very nice bullish wave.
According to technical analysis, when the market hits bottom, the all-time low, and is followed by a strong reaction with really high volume, a price jump, it signals the low is in. The low being in confirms a change of trend. The sideways action and price fluctuations at the current range is the accumulation phase. This is a build-up process befor
DODOUSDT Forming Bullish MomentumDODOUSDT is forming a clear bullish momentum pattern, a classic bullish wave signal that often indicates an upcoming breakout. The price has been consolidating within a narrowing range, suggesting that selling pressure is weakening while buyers are beginning to regain control. With consistent volume confirming accumulation at lower levels, the setup hints at a potential bullish breakout soon. The projected move could lead to an impressive gain of around 90% to 100% once the price breaks above th
DODO: Bear market continuation or retrace followed by growth?Almost always —because I cannot say always to be honest— when there is a bullish breakout the market produces a retrace and ends up testing the same resistance that was broken as support.
Here we have this situation with the DODO chart. Months and months of action at bottom prices and we get nothing at all. Very little bullish action and it gets corrected. Zero bearish action...
And we look at this chart and it is doing its own thing but it adds to our macro picture, the view of the entire mar
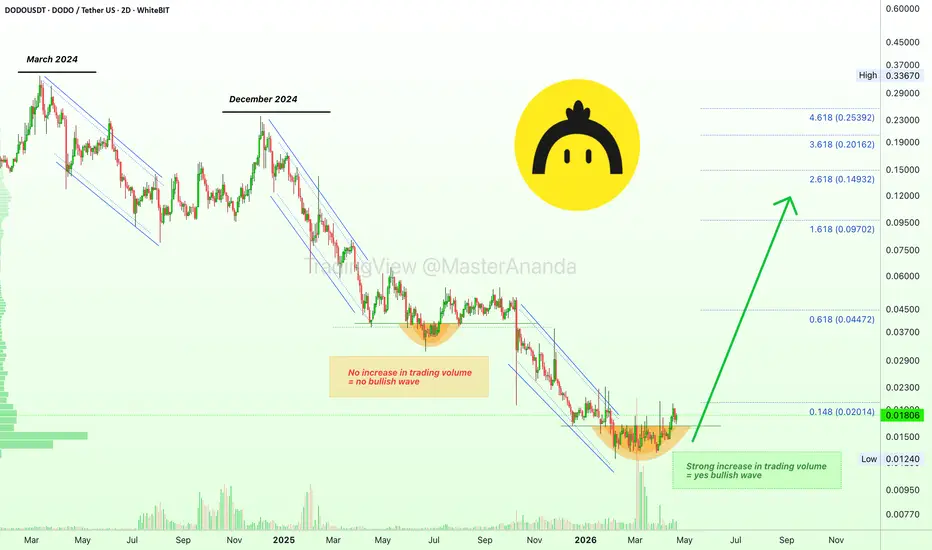
DODO · Bottom & VolumeThe decline starts March 2024 and intensifies December 2024.
There was a period in June 2025 similar to what we see now, a bottom pattern but no bullish action. What's the difference between June 2025 and Feb-March 2026?
As the low happened last year there was no volume. No buyers appeared thus no bullish wave.
There is a new bottom pattern now on DODOUSDT, much bigger compared to last year. It lasts much longer and is coupled with really high volume. This predicts a bullish wave comes next.
Dodousdt decline continuesDODOUSDT has continued its downtrend, breaking below the key rectangular consolidation zone. With this breakdown confirmed, price is now heading toward the projected bearish box target.
The plan is to monitor this lower zone for potential accumulation, anticipating a recovery move back toward the upper boundary of the previous consolidation box, which aligns with the mid-term target around the $0.33 region.
Patience and confirmation will be essential before entering. This zone could offer a valu
DODOUSDT Forming Falling WedgeDODOUSDT is forming a clear falling wedge pattern, a classic bullish reversal signal that often indicates an upcoming breakout. The price has been consolidating within a narrowing range, suggesting that selling pressure is weakening while buyers are beginning to regain control. With consistent volume confirming accumulation at lower levels, the setup hints at a potential bullish breakout soon. The projected move could lead to an impressive gain of around 80% to 90% once the price breaks above th
DODO Local trend. 19 04 2025Logarithm. Time frame 3 days. No need for less. Capitulation zone or complete scam. From the breakthrough of support of the long-term horizontal channel -68%. For key local resistance zones in cases of breakthrough of resistance of the descending wedge, percentages for clarity are shown (similarly, as in the previous idea of this coin, reaching the specified % and reversal and super decline).
Secondary trend and this zone in it, for understanding the zone and risks of work.
DODO Secondary
DODO Local trend. 19 04 2025Logarithm. Time frame 3 days. No need for less. Capitulation zone or complete scam. From the breakthrough of support of the long-term horizontal channel -68%. For key local resistance zones in cases of breakthrough of resistance of the descending wedge, percentages for clarity are shown (similarly, as in the previous idea of this coin, reaching the specified % and reversal and super decline).
Secondary trend and this zone in it, for understanding the zone and risks of work.
DODO Secondary
DODO/USDT (15m) ANALYSIS. Chart Analysis:
DODO/USDT (15m)
📌 Key Levels
POI (OB + FVG Zone): Around 0.0465 – 0.0470
SSL (Sell-side Liquidity): Below recent lows, sweeping liquidity before reversal.
Current Price: ~0.0480
🧩 Structure Insight
Price recently made a strong bullish leg after breaking structure (BOS).
Now retracing toward the OB+FVG confluence zone which is the main Point of Interest (POI).
Before resuming upward, liquidity sweep at SSL is possible.
📈 Trading Plan (Free Idea)
Entry Zone (Buy): 0.0
High-Risk Crypto Bet – DODO AnalysisDODO is a decentralized finance (#DeFi) protocol that has seen a brutal 99% drawdown from its peak — making it one of the most devalued tokens in the market.
📉 Structure:
The chart shows a “channel within a channel” structure — a signal of prolonged capitulation. DODO is currently in a range where most have written it off. But history shows that such zones often precede major reversals.
🌀 Formation:
A potential inverse head and shoulders pattern is developing — a classic reversal setup. The mi
DODOX - Resistance is holding it back - Huge Potential- DODOX has successfully broken out from the resistance trendline
- Now its being pushed back back the weak local resistances
- I see a huge upward potential here.
Entry Price: 0.048271 ( Or you can wait for it breakout from the local resistance of 0.063051)
Stop Loss: 0.029078
TP1: 0.062621
TP2: 0.079766
TP3: 0.103243
TP4: 0.151853
TP5: 0.222332
Max Leverage 5x.
Don't forget to keep stoploss
Cheers!
GreenCrypto
DODO/USDT Approaching Major Breakout? End of a Long Downtrend?📊 In-Depth Analysis of DODO/USDT (1D Chart)
The DODO/USDT pair remains in a medium-to-long-term downtrend since late 2024. However, the current price action shows early signs of a potential reversal.
📐 Pattern and Structure
Downtrend Resistance Line: The descending yellow trendline from the December 2024 peak continues to act as major resistance. Price is now testing this line.
Key Support Zone: The region around $0.0314 – $0.0384 is a strong support area, proven by multiple bounce attempts.