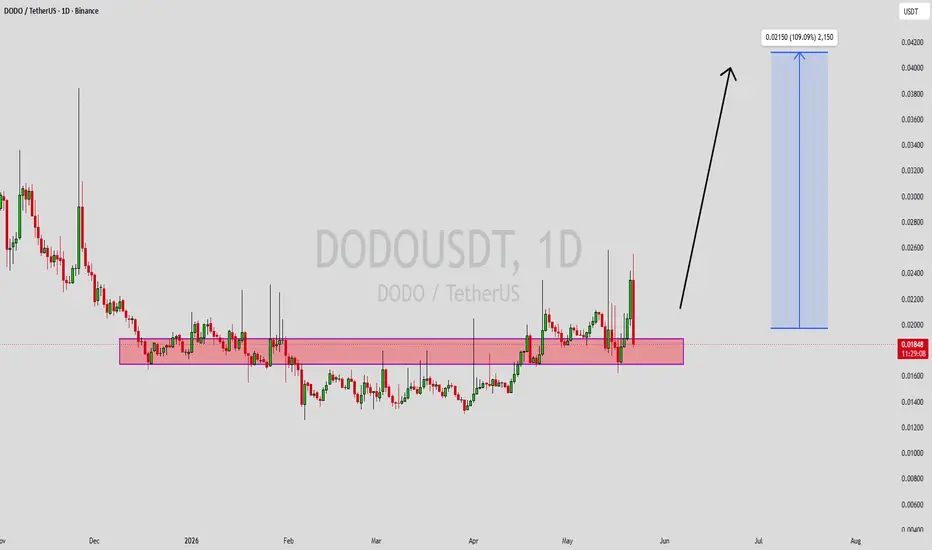
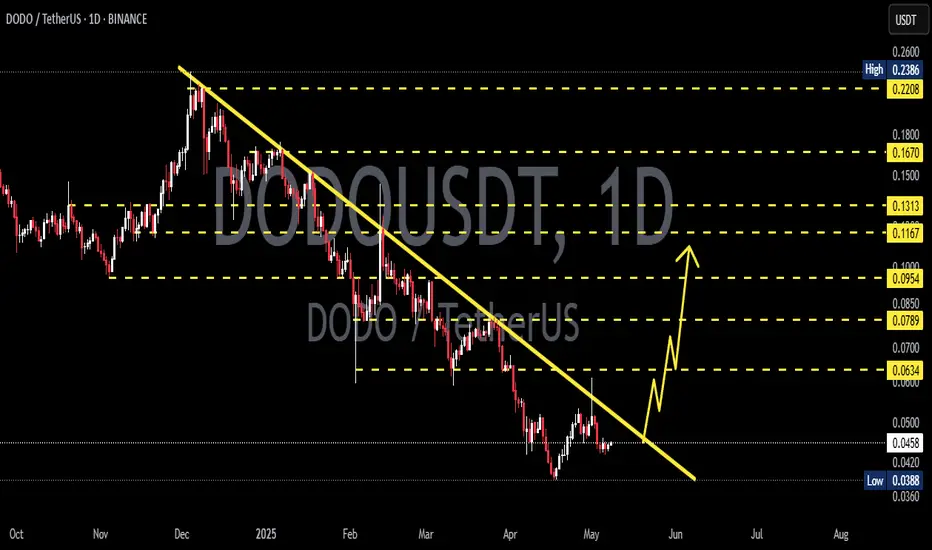
DODOXUSDT Forming Bullish MomentumDODOXUSDT is forming a clear bullish momentum pattern, a classic bullish wave signal that often indicates an upcoming breakout. The price has been consolidating within a narrowing range, suggesting that selling pressure is weakening while buyers are beginning to regain control. With consistent volume confirming accumulation at lower levels, the setup hints at a potential bullish breakout soon. The projected move could lead to an impressive gain of around 50% to 60% once the price breaks above the pattern resistance.
This bullish momentum pattern is typically seen at the end of downtrends or corrective phases, and it represents a potential shift in market sentiment from bearish to bullish. Traders closely watching DODOXUSDT are noting the strengthening momentum as it approaches a key breakout zone. The healthy trading volume adds confidence to this setup, showing that market participants are positioning early in anticipation of a potential reversal.
Investors' growing interest in DODOXUSDT reflects increasing confidence in the project's long-term potential and its current technical structure. If the breakout is confirmed with sustained buying volume, it could signal the beginning of a fresh bullish leg. Traders may find this an attractive opportunity for medium-term gains as the pattern completes and bullish momentum continues to build.
✅ Show your support by hitting the like button.
✅ Leave a comment below! (What is your opinion about this coin?)
Your feedback and engagement keep me inspired to share more insightful market analysis with you!
In-depth trading ideas
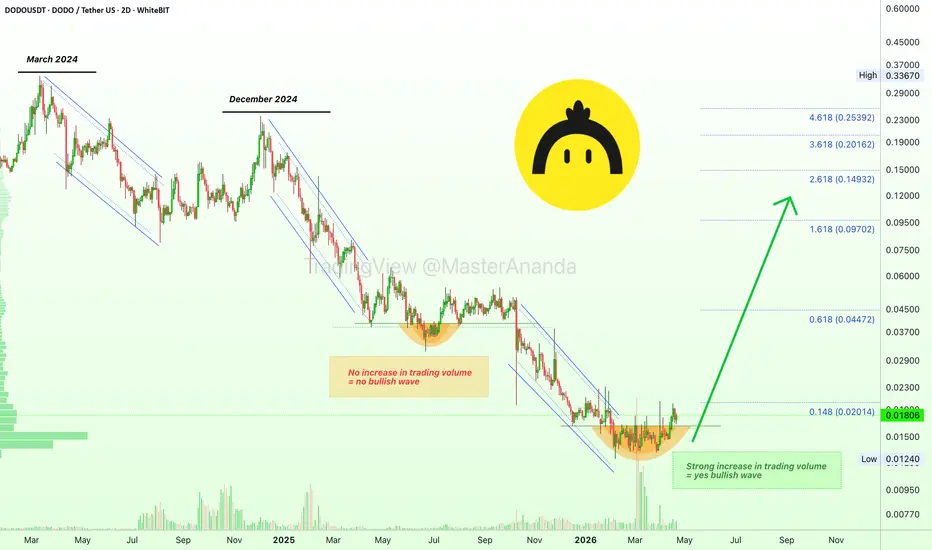
DODO Trades at bottom range—perfect entry zone & bull marketDODOUSDT is trading close to its all-time low with high bullish potential. This is a perfect entry zone in anticipation of a very nice bullish wave.
According to technical analysis, when the market hits bottom, the all-time low, and is followed by a strong reaction with really high volume, a price jump, it signals the low is in. The low being in confirms a change of trend. The sideways action and price fluctuations at the current range is the accumulation phase. This is a build-up process before a massive bullish cycle. Short-term, the higher low recently vs February gives additional strength to the bullish case. A very strong combination of signals that support rising prices.
The RSI hit bottom April 2025, more than a year ago producing a very strong bullish divergence. The MACD traded recently within the bullish zone and is starting to reverse for the new wave of growth. The STOCH is moving within oversold territory pointing higher, a bullish signal.
All these combined gives us one clear picture—DODOUSDT bull market, years of growth, and it all starts now. Remember, a bear market starts from a major high (see March 2024 left side of this chart). A bull market starts from a major low (this is February 2026 and now the higher low). We are going up.
Namaste.
DODOUSDT Forming Bullish MomentumDODOUSDT is forming a clear bullish momentum pattern, a classic bullish wave signal that often indicates an upcoming breakout. The price has been consolidating within a narrowing range, suggesting that selling pressure is weakening while buyers are beginning to regain control. With consistent volume confirming accumulation at lower levels, the setup hints at a potential bullish breakout soon. The projected move could lead to an impressive gain of around 90% to 100% once the price breaks above the wedge resistance.
This bullish momentum pattern is typically seen at the end of downtrends or corrective phases, and it represents a potential shift in market sentiment from bearish to bullish. Traders closely watching DODOUSDT are noting the strengthening momentum as it nears a breakout zone. The strong trading volume adds confidence to this setup, showing that market participants may already be positioning early in anticipation of a reversal.
Investors’ growing interest in DODOUSDT reflects increasing confidence in the project’s long-term fundamentals and current technical strength. If the breakout confirms with sustained buying volume, this could mark the beginning of a fresh bullish rally. Traders may find this a valuable setup for medium-term gains, especially as the pattern nears completion and bullish momentum continues to accelerate.
✅ Show your support by hitting the like button
✅ Leaving a comment below! (What is your opinion about this coin?)
Your feedback and engagement keep me inspired to share more insightful market analysis with you!
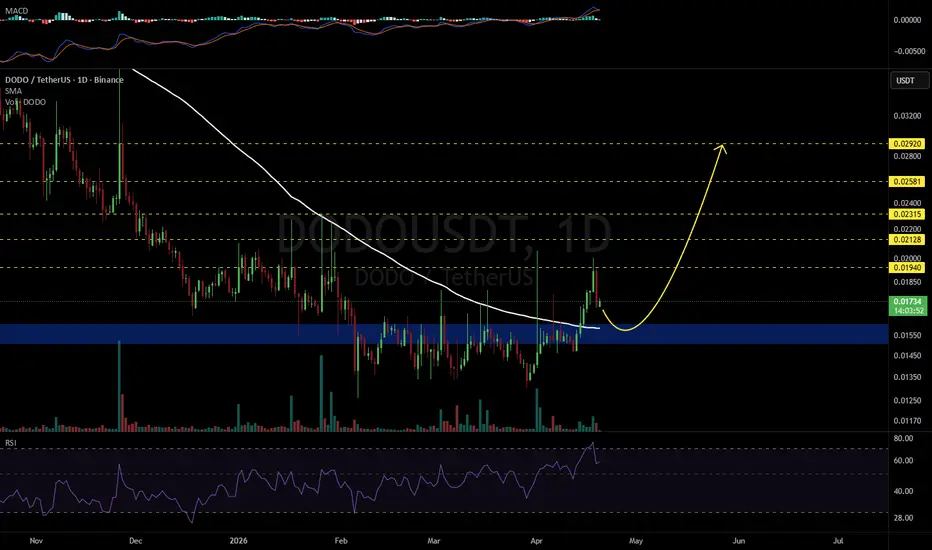
DODO: Bear market continuation or retrace followed by growth?Almost always —because I cannot say always to be honest— when there is a bullish breakout the market produces a retrace and ends up testing the same resistance that was broken as support.
Here we have this situation with the DODO chart. Months and months of action at bottom prices and we get nothing at all. Very little bullish action and it gets corrected. Zero bearish action...
And we look at this chart and it is doing its own thing but it adds to our macro picture, the view of the entire market. A lack of major growth but also a complete lack of a bearish trend or new lows. The recovery phase continues to unfold.
The initial bullish breakout on DODOUSDT resulted in 100% total growth, from bottom (6-Feb) to top (mid-May) and now we have a retrace and support is being tested.
Considering the entire chart, a bear market is present since March 2024. Do we go with the theory that right now we are witnessing a bearish continuation? Do we take the high volume and bullish breakout after a long-term all-time low as the end of the bear market?
If I were looking at this chart in isolation this would be a very difficult question. Even if I make the answer easy, I can as easily be wrong. But, when I look at some of the other projects, Toncoin, VVV, Bitcoin and such, I know the market is set to grow. What one does, the rest follows.
We take the bottom reversal signal as real and after the retrace is over, we expect additional growth.
Thanks a lot for your continued support.
Namaste.
DODO · Bottom & VolumeThe decline starts March 2024 and intensifies December 2024.
There was a period in June 2025 similar to what we see now, a bottom pattern but no bullish action. What's the difference between June 2025 and Feb-March 2026?
As the low happened last year there was no volume. No buyers appeared thus no bullish wave.
There is a new bottom pattern now on DODOUSDT, much bigger compared to last year. It lasts much longer and is coupled with really high volume. This predicts a bullish wave comes next.
The lack of trading volume can be interpreted in different ways. In some cases it might mean that it is simply too early. In other instances it might be a bearish signal, it depends on the context, the project in question and even the exchange.
One exchange might show zero volume at the bottom while another one might show plenty. Just one exchange is enough to support an upcoming bullish wave on a project that hit bottom. If whales are loading up, there is a reason. Most whales are in the know.
Still, some signals might not always work so we look for supporting signals. Never a single signal in isolation to make a decision to trade. It is better to have lots of signals in our favor. When it comes to Crypto, the best signal is to look at the entire market.
Namaste.
Dodousdt decline continuesDODOUSDT has continued its downtrend, breaking below the key rectangular consolidation zone. With this breakdown confirmed, price is now heading toward the projected bearish box target.
The plan is to monitor this lower zone for potential accumulation, anticipating a recovery move back toward the upper boundary of the previous consolidation box, which aligns with the mid-term target around the $0.33 region.
Patience and confirmation will be essential before entering. This zone could offer a valuable long-term opportunity if market structure begins to shift.
DODOUSDT Forming Falling WedgeDODOUSDT is forming a clear falling wedge pattern, a classic bullish reversal signal that often indicates an upcoming breakout. The price has been consolidating within a narrowing range, suggesting that selling pressure is weakening while buyers are beginning to regain control. With consistent volume confirming accumulation at lower levels, the setup hints at a potential bullish breakout soon. The projected move could lead to an impressive gain of around 80% to 90% once the price breaks above the wedge resistance.
This falling wedge pattern is typically seen at the end of downtrends or corrective phases, and it represents a potential shift in market sentiment from bearish to bullish. Traders closely watching DODOUSDT are noting the strengthening momentum as it nears a breakout zone. The good trading volume adds confidence to this pattern, showing that market participants are positioning early in anticipation of a reversal.
Investors’ growing interest in DODOUSDT reflects rising confidence in the project’s long-term fundamentals and current technical strength. If the breakout confirms with sustained volume, this could mark the start of a fresh bullish leg. Traders might find this a valuable setup for medium-term gains, especially as the wedge pattern completes and buying momentum accelerates.
✅ Show your support by hitting the like button and
✅ Leaving a comment below! (What is your opinion about this Coin?)
Your feedback and engagement keep me inspired to share more insightful market analysis with you!
DODO Local trend. 19 04 2025Logarithm. Time frame 3 days. No need for less. Capitulation zone or complete scam. From the breakthrough of support of the long-term horizontal channel -68%. For key local resistance zones in cases of breakthrough of resistance of the descending wedge, percentages for clarity are shown (similarly, as in the previous idea of this coin, reaching the specified % and reversal and super decline).
Secondary trend and this zone in it, for understanding the zone and risks of work.
DODO Secondary trend. 19 04 2025
Long-term as for me, it will be a scam, like all the rest.
Locally you can work with a wedge (breakthrough) and the first targets to the mirror resistance level. Sometimes pumps are “stick” into the depth of the previous channel, but not above its previous resistance level. Probably, these should be your last local-medium-term targets.
The maximum where I can pump crypto wrapper in the future for the big cryptocurrency hype, if it doesn’t crash earlier, is to the median zone, no higher than 0.666. But, as for me, it is more rational to work with local, maximally down-to-earth goals , observing risk and money management.
DODO Local trend. 19 04 2025Logarithm. Time frame 3 days. No need for less. Capitulation zone or complete scam. From the breakthrough of support of the long-term horizontal channel -68%. For key local resistance zones in cases of breakthrough of resistance of the descending wedge, percentages for clarity are shown (similarly, as in the previous idea of this coin, reaching the specified % and reversal and super decline).
Secondary trend and this zone in it, for understanding the zone and risks of work.
DODO Secondary trend. 19 04 2025
Long-term as for me it will be a scam, like all the rest.
Locally you can work with a wedge (breakthrough) and the first targets to the mirror resistance level. Sometimes pumps are "stick" into the depth of the previous channel, but not above its previous resistance level. Probably, these should be your last local-medium-term targets.
The maximum where I can pump crypto wrapper in the future for the big cryptocurrency hype, if it doesn’t crash earlier, is to the median zone, no higher than 0.666. But, as for me, it is more rational to work with local, maximally down-to-earth goals , observing risk and money management.
DODO/USDT (15m) ANALYSIS. Chart Analysis:
DODO/USDT (15m)
📌 Key Levels
POI (OB + FVG Zone): Around 0.0465 – 0.0470
SSL (Sell-side Liquidity): Below recent lows, sweeping liquidity before reversal.
Current Price: ~0.0480
🧩 Structure Insight
Price recently made a strong bullish leg after breaking structure (BOS).
Now retracing toward the OB+FVG confluence zone which is the main Point of Interest (POI).
Before resuming upward, liquidity sweep at SSL is possible.
📈 Trading Plan (Free Idea)
Entry Zone (Buy): 0.0465 – 0.0470 (in POI with OB + FVG)
Confirmation: Wait for bullish price action (e.g., bullish engulfing, rejection wicks).
Target: 0.0490 – 0.0500 (previous swing highs).
Stop Loss: Below 0.0460 to stay safe.
⚠️ Notes
This setup relies on bullish confirmation inside POI.
If price fails to hold POI, expect deeper retracement.
🚀 Summary:
“DODO/USDT (15m) – Watching the OB+FVG zone at 0.0465–0.0470. Need bullish confirmation inside POI for a potential move toward 0.0490+. SSL sweep expected before reversal. Setup valid only with strong bullish rejection.”
High-Risk Crypto Bet – DODO AnalysisDODO is a decentralized finance (#DeFi) protocol that has seen a brutal 99% drawdown from its peak — making it one of the most devalued tokens in the market.
📉 Structure:
The chart shows a “channel within a channel” structure — a signal of prolonged capitulation. DODO is currently in a range where most have written it off. But history shows that such zones often precede major reversals.
🌀 Formation:
A potential inverse head and shoulders pattern is developing — a classic reversal setup. The minimal target from this structure is around $0.08.
📈 Early Signal:
Price has already bounced +75% from the bottom — a possible sign of early accumulation.
☕ Bigger Picture:
This zone might be forming the right side of a long-term cup pattern — hinting at a potential macro reversal if the market supports.
DODOX - Resistance is holding it back - Huge Potential- DODOX has successfully broken out from the resistance trendline
- Now its being pushed back back the weak local resistances
- I see a huge upward potential here.
Entry Price: 0.048271 ( Or you can wait for it breakout from the local resistance of 0.063051)
Stop Loss: 0.029078
TP1: 0.062621
TP2: 0.079766
TP3: 0.103243
TP4: 0.151853
TP5: 0.222332
Max Leverage 5x.
Don't forget to keep stoploss
Cheers!
GreenCrypto
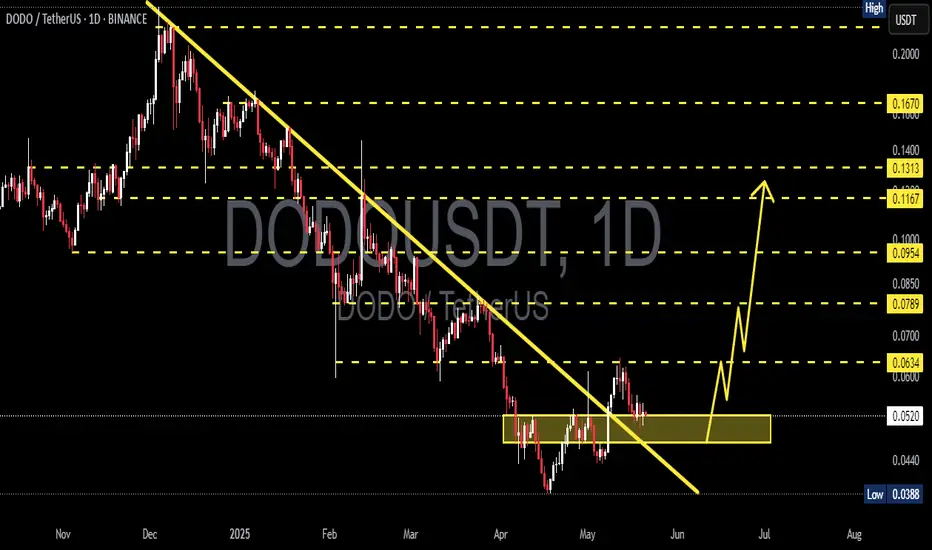
DODO/USDT Approaching Major Breakout? End of a Long Downtrend?📊 In-Depth Analysis of DODO/USDT (1D Chart)
The DODO/USDT pair remains in a medium-to-long-term downtrend since late 2024. However, the current price action shows early signs of a potential reversal.
📐 Pattern and Structure
Downtrend Resistance Line: The descending yellow trendline from the December 2024 peak continues to act as major resistance. Price is now testing this line.
Key Support Zone: The region around $0.0314 – $0.0384 is a strong support area, proven by multiple bounce attempts.
Layered Resistance Zones:
$0.0454
$0.0512
$0.0606
$0.0787
$0.1169
Major high at $0.2219
🟢 Bullish Scenario
If price breaks above the descending trendline, it could signal:
1. A potential short-term trend reversal.
2. First upside targets lie around $0.0454 and $0.0512.
3. With strong volume, further upside to $0.0606 and $0.0787 is possible.
Bullish Confirmation: A breakout candle above the trendline with strong volume and a successful retest.
🔴 Bearish Scenario
If the price gets rejected at the trendline:
1. Price could revisit the critical $0.0314 support.
2. A breakdown below $0.0314 would likely trigger a new lower low, extending the downtrend.
3. Minimal support exists below this level, increasing downside risk.
📌 Pattern Summary
The structure shows a classic descending trendline dominating the market.
The price is consolidating and forming a potential accumulation base.
A confirmed breakout would likely shift the overall momentum.
🧠 Strategy & Risk Management
Aggressive Entry: Buy on breakout + successful retest of trendline.
Conservative Entry: Wait for confirmation above $0.0512 for safer reversal confirmation.
Stop-loss: Below $0.0314, the critical support zone.
#DODOUSDT #CryptoBreakout #TechnicalAnalysis #AltcoinReversal #TrendlineBreak #CryptoChart #CryptoSignals #DODOAnalysis #BullishBreakout
DODO, Bitcoin, The Altcoins Market & Luxury BrandsI have a feeling that DODO will make a strong move soon. This is just a feeling, and somehow whenever I have this feeling the pair in question doesn't move but instead stalls... Well, it moves, they tend to move they just don't do so immediately. If one waits patiently results are awesome. Think long-term; focus on the long-term.
Forget the feeling, what is this chart saying?
True bottom.
This is good. You see those pairs we see moving, right?
As soon as they move we are tempted to buy but the movement stops, and we just want the action and we want to see our money grow but somehow chasing pairs doesn't work.
Now, look at this one!
I told you the market has so much to offer, endless opportunities.
» DODOUSDT is trading at the market bottom and yet to move. These are the ones that are good, before the breakout takes place. Buy and hold, the market takes care of the rest.
Very easy right? We buy and we wait.
If it doesn't move, that's ok.
We can diversify because some invariably will take weeks of consolidation before breaking out strong, others move after a few days while others will move after months.
A big market, lots of projects, huge variations.
You can pick the ones you like, the ones that are strong, the ones with huge growth potential, some of the less known and so on.
Diversify between category, between size, between risk, between exchanges, on and on and on.
Or you can put everything in one coin just make sure it is a project that is stable, it has been around long-term and has huge potential for growth and is still trading at the bottom. I know people don't recommend this but this also works.
Are you aware that most of the people that became rich with the stock market bought just one or two stocks? In the Internet boom and those days.
The same can be true for Crypto, if you are uncertain or don't have time, don't like to trade, you can buy just 3-5 of the top pairs and let it grow long-term. It works.
You can buy Bitcoin and hold, that is another way to make money if you have big money and don't like to enter risky trades.
Nobody is going to delist Bitcoin that's for sure. And Bitcoin has been very strong lately with the correction becoming smaller all the time. Growth potential will be huge but if your money is low, you need the smaller Altcoins.
» Bitcoin for the whales. The Altcoins for us.
The Altcoins we use to grow.
Bitcoin is for when you already have lots of money and want more.
Bitcoin is the hardest one because it is the biggest one. It has the most attention. The chart tends to be tricked so it is hard to read. Others, it is just too easy.
» DODOUSDT is trading at bottom prices and looks like will soon start to move up. This is easy. You can do this. You have my support.
Thanks a lot for your continued support.
If you enjoy the content, keep on enjoying because I will give you more.
I will give you so much that you will not be able to go through it all.
Namaste.
DODOUSDT | Massive Volume Spike – This Could Be HUGE!🔥 Massive Volume Spike – This Could Be HUGE! 🔥
“We’re talking about a massive 1265% daily volume increase – something big is brewing! The market is waking up, and let me tell you, the setup is looking beautiful.”
Key Levels to Watch:
Blue Box = Strong Demand Zone – This is where smart money steps in. If price holds, we could see a big reaction.
Confirmation is Key – I’m watching for CDV strength, lower time frame breakouts, and volume profile support before making a move.
Momentum Could Explode – If buyers step in, this could turn into a monster rally.
Final Thoughts:
“I’m watching this closely. Volume is through the roof, the demand zone is clear, and the market is setting up for something massive. If confirmation comes in – we ride the wave!”
🚀 Get ready, this could be one for the books! 🔥
Let me tell you, this is something special. These insights, these setups—they’re not just good; they’re game-changers. I've spent years refining my approach, and the results speak for themselves. People are always asking, "How do you spot these opportunities?" It’s simple: experience, clarity, and a focus on high-probability moves.
Want to know how I use heatmaps, cumulative volume delta, and volume footprint techniques to find demand zones with precision? I’m happy to share—just send me a message. No cost, no catch. I believe in helping people make smarter decisions.
Here are some of my recent analyses. Each one highlights key opportunities:
🚀 RENDERUSDT: Strategic Support Zones at the Blue Boxes +%45 Reaction
🎯 PUNDIXUSDT: Huge Opportunity | 250% Volume Spike - %60 Reaction Sniper Entry
🌐 CryptoMarkets TOTAL2: Support Zone
🚀 GMTUSDT: %35 FAST REJECTION FROM THE RED BOX
🎯 ZENUSDT.P: Patience & Profitability | %230 Reaction from the Sniper Entry
🎯 DEXEUSDT %180 Reaction with %9 Stop
🐶 DOGEUSDT.P: Next Move
🎨 RENDERUSDT.P: Opportunity of the Month
💎 ETHUSDT.P: Where to Retrace
🟢 BNBUSDT.P: Potential Surge
📊 BTC Dominance: Reaction Zone
🌊 WAVESUSDT.P: Demand Zone Potential
🟣 UNIUSDT.P: Long-Term Trade
🔵 XRPUSDT.P: Entry Zones
🔗 LINKUSDT.P: Follow The River
📈 BTCUSDT.P: Two Key Demand Zones
🟩 POLUSDT: Bullish Momentum
🌟 PENDLEUSDT.P: Where Opportunity Meets Precision
🔥 BTCUSDT.P: Liquidation of Highly Leveraged Longs
🌊 SOLUSDT.P: SOL's Dip - Your Opportunity
🐸 1000PEPEUSDT.P: Prime Bounce Zone Unlocked
🚀 ETHUSDT.P: Set to Explode - Don't Miss This Game Changer
🤖 IQUSDT: Smart Plan
⚡️ PONDUSDT: A Trade Not Taken Is Better Than a Losing One
💼 STMXUSDT: 2 Buying Areas
🐢 TURBOUSDT: Buy Zones and Buyer Presence
🌍 ICPUSDT.P: Massive Upside Potential | Check the Trade Update For Seeing Results
🟠 IDEXUSDT: Spot Buy Area | %26 Profit if You Trade with MSB
📌 USUALUSDT: Buyers Are Active + %70 Profit in Total
🌟 FORTHUSDT: Sniper Entry +%26 Reaction
🐳 QKCUSDT: Sniper Entry +%57 Reaction
📊 BTC.D: Retest of Key Area Highly Likely
This list? It’s just a small piece of what I’ve been working on. There’s so much more. Go check my profile, see the results for yourself. My goal is simple: provide value and help you win. If you’ve got questions, I’ve got answers. Let’s get to work!