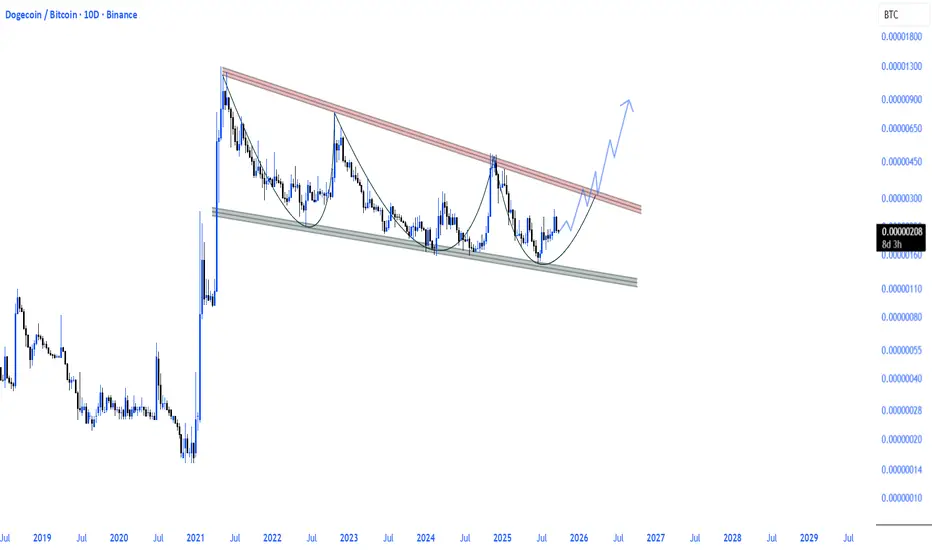
DOGE TIME ?DOGE/BTC - CRYPTOCAP:DOGE TIME?
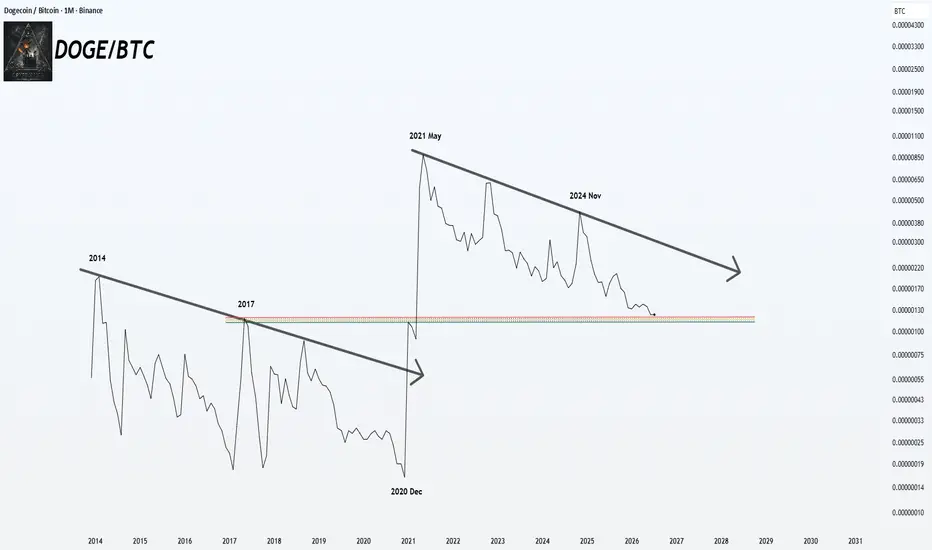
Doge/Bitcoin has been one of the most discussed charts in crypto for years.
Many are asking “Is DOGE TIME coming again?”
especially after the painful compression we have seen since the 2021 peak.
Looking at the monthly structure since 2014, a few things stand
Compare with DOGE/BTC
DOGE/BTC - Ready to BounceBased on the current market structure developing on the DOGE/BTC pair, it appears DOGE is likely to begin gaining strength against Bitcoin. Here are the key structural factors supporting that possibility.
The Double Bottom
The pair has just formed a double bottom around the 0.00000125 level. Firs
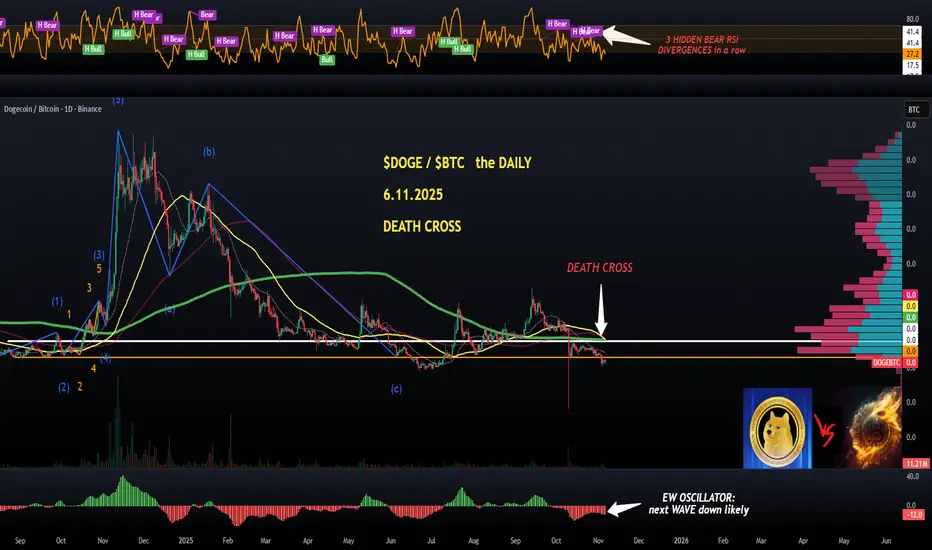
$DOGE/$BTC (DAILY): DEATH CROSS, bear market coinCRYPTOCAP:DOGE sucks in relation to CRYPTOCAP:BTC and that's not even a surprise due to the dominant RISK-OFF approach.
Useless projects, and practically all memecoins are in for a ride.
DEATH CROSS (50 MA crossing below 200 MA) seals the deal here, as far as I'm concerned.
Some traders still
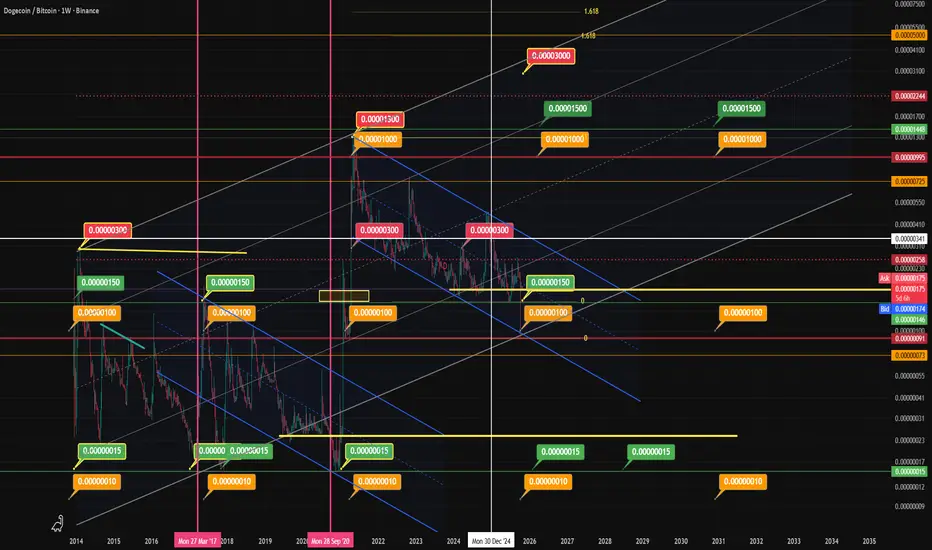
DOGE/BTC Pattern Analysis1. The repeating base units:
You’ve marked consistent numerical milestones — 0.00000010, 0.00000100, 0.00000150, 0.00000300, 0.00001000, 0.00001500, and 0.00003000.
These levels form a logarithmic doubling–tripling sequence, implying fractal rhythm in DOGE/BTC cycles.
Each breakout historically resp
$DOGE \ $BTC CRYPTOCAP:DOGE ➚ CRYPTOCAP:BTC
Dogecoin is moving towards the upper band of the bullish falling wedge formation it has been trading within for some time, and if a breakout occurs, it will create the potential for a significant run against BTC.
Expectations are high, but approval is at a break
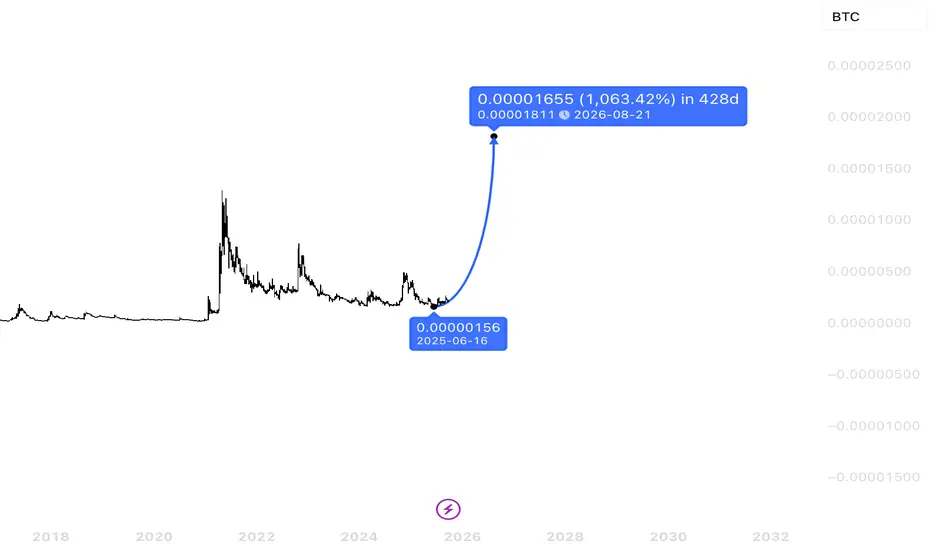
doge szn comingHistorical data suggests the next DOGE/BTC cycle may be approaching.
Current structure resembles prior accumulation phases before explosive moves.
Projection shows potential for a 1,000%+ move into mid-2026 if patterns repeat.
Cycle timing aligns with broader market expansions seen in past Doge s
See all ideas
Summarizing what the indicators are suggesting.
Oscillators
Neutral
SellBuy
Strong sellStrong buy
Strong sellSellNeutralBuyStrong buy
Oscillators
Neutral
SellBuy
Strong sellStrong buy
Strong sellSellNeutralBuyStrong buy
Summary
Neutral
SellBuy
Strong sellStrong buy
Strong sellSellNeutralBuyStrong buy
Summary
Neutral
SellBuy
Strong sellStrong buy
Strong sellSellNeutralBuyStrong buy
Summary
Neutral
SellBuy
Strong sellStrong buy
Strong sellSellNeutralBuyStrong buy
Moving Averages
Neutral
SellBuy
Strong sellStrong buy
Strong sellSellNeutralBuyStrong buy
Moving Averages
Neutral
SellBuy
Strong sellStrong buy
Strong sellSellNeutralBuyStrong buy
Displays a symbol's price movements over previous years to identify recurring trends.