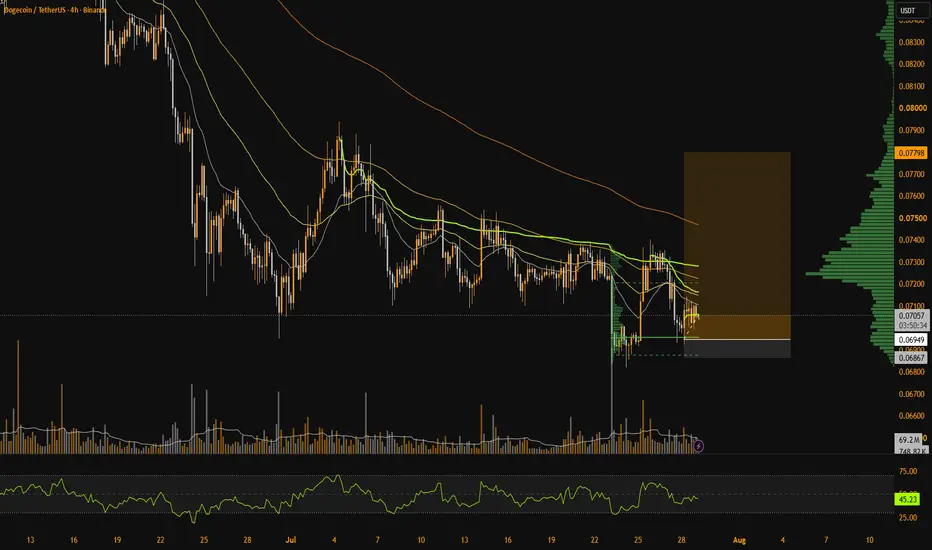
Dogecoin Liquidity SetupDogecoin is currently trading above key daily support at $0.07 while holding above internal weekly resistance near $0.073.
These two levels have effectively created a local trading range, with price consolidating over the past several sessions. This period of sideways movement has allowed liquidity to build beneath the range, while the major swing low remains untouched, suggesting that the market may still be seeking additional liquidity before making its next significant move.
From a technical perspective, a temporary move below the current range would not necessarily be bearish. Instead, it could form a liquidity sweep that extends toward the protected swing low, triggering sell-side liquidity before quickly reversing higher. This type of price action is commonly known as a Swing Failure Pattern (SFP), where the market briefly breaks support to trap sellers before reclaiming the level and shifting momentum back to the upside.
The broader structure continues to favour this scenario as long as the higher-timeframe swing low remains intact. With liquidity also resting above the current range, the market has an incentive to rotate higher once downside liquidity has been collected.
A confirmed SFP would provide a strong technical signal that buyers have regained control, increasing the probability of a rally toward overhead liquidity and higher resistance levels while maintaining the broader bullish market structure.
In-depth trading ideas
The Calm Before DOGE's Next ExpansionDOGEUSDT — Institutional Watchlist | Range Acceptance Required, No Signal Yet
This is not a direct signal. It is a structure-based watchlist for tracking whether DOGE can build acceptance inside a clean demand zone before any long setup is considered.
Macro Catalyst Layer
Primary regime: DOGE is still trading as a high-beta meme asset that reacts more to liquidity conditions, crypto risk appetite, and positioning than to standalone fundamentals.
Catalyst classification: Policy-uncertain / liquidity-sensitive / risk-on dependent.
USD channel: A softer dollar environment generally supports meme beta; a stronger dollar or tighter financial conditions usually compresses DOGE upside faster than BTC.
Real-yield channel: Falling real yields improve speculative appetite across crypto. Rising real yields typically reduce the attractiveness of low-conviction, high-beta assets first.
Risk-sentiment channel: DOGE benefits most when market sentiment is constructive and liquidity is chasing beta. In risk-off conditions, DOGE usually underperforms even when BTC remains relatively stable.
Liquidity channel: DOGE needs expanding crypto liquidity, not only narrative attention. Volume expansion and open-interest growth matter more than headlines.
Sentiment & Cross-Asset Context
Market tone: Neutral-to-positive, but still fragile. DOGE remains dependent on speculative participation rather than structural demand.
Recent participation signal: The latest tape showed a meaningful increase in trading activity, which supports the idea that DOGE is still being actively rotated by retail and momentum traders.
Cross-asset read: If BTC and Nasdaq hold bid, DOGE can extend. If broader risk appetite weakens, DOGE usually loses the bid first.
Positioning read: Positive funding and rising leverage would make this a squeeze-prone market. Cooling leverage would make pullbacks healthier.
Liquidity & Order-Flow Context
Current structure: Price is working inside a horizontal range / box, with the upper boundary already being tested.
Key interpretation: This is not a chase environment. The chart needs acceptance inside the zone before any buy-side continuation has value.
Liquidity logic: The most important question is whether price can take the local highs, hold above them, and convert the zone into support.
Execution style: Look for sweep + reclaim, not impulsive entry into resistance.
Technical Structure
Higher timeframe bias: Neutral until the range resolves.
Lower timeframe bias: Bullish only if the box is reclaimed and defended.
Pattern type: Horizontal consolidation / compression inside a wider trend context.
Confirmation requirement: A clean break, acceptance, and retest of the range high.
Invalidation: Failure back inside the box followed by acceptance below the midpoint or lower boundary.
Scenario 1 — Continuation / Long Setup
Trigger: Price forms a clean accumulation structure inside the zone, then breaks and holds above the top of the box.
Confirmation: Reclaim of the breakout level with continued bid response and no immediate rejection.
Preferred behavior: Retest of the reclaimed level should hold as support.
Target logic: First target is the prior swing high above the range; second target is the next obvious liquidity pocket above it.
Invalidation: A failed breakout that closes back inside the range and loses the reclaim level.
Scenario 2 — Reversal / Failure of the Range
Trigger: Price rejects the upper boundary, loses intrarange support, and starts accepting lower.
Confirmation: Lower-high formation followed by a decisive break of the box floor.
Structural failure: The market stops defending the consolidation and turns the entire range into distribution.
Target logic: Once the lower boundary fails, the next draw becomes the next liquidity pool below the range.
Invalidation: Strong reclaim back into the range with acceptance above the failed breakdown level.
Conclusion
Primary driver: Liquidity and speculative risk appetite.
Secondary driver: Crypto beta rotation and leverage dynamics.
Market regime: Range compression with directional expansion potential.
Tactical stance: Wait for acceptance. No breakout chase. Only consider the long side after structure confirms inside the zone.
For watchlist purposes only. Not financial advice. The setup becomes actionable only after acceptance, retest, and structural confirmation.
If you want the zone expressed exactly in your preferred notation, keep it as 0.0695–0.0714; that is the logically consistent read for DOGE at the current price regime. If you intentionally meant 0.695–0.714, leave it unchanged as a stylistic reference.
DOGEUSDT: Bullish Push to 0.08745?BINANCE:DOGEUSDT is eyeing a bullish continuation on the 4-hour chart , with price rebounding from support after recent consolidation, converging with a potential entry zone that could ignite strong upside momentum if buyers defend amid volatility. This setup suggests a powerful rally opportunity, targeting higher resistance levels with close to 1:6 risk-reward overall .🔥
Entry between 0.06929–0.06858 (entry from current price with proper risk management is recommended). Targets at 0.0800 (first), 0.08745 (second). Set a stop loss at a daily close below 0.06625 , yielding a risk-reward ratio of close to 1:6 overall. Monitor for confirmation via a bullish candle close above entry with rising volume, leveraging the pair's momentum near support.🌟
📝 Trade Setup
🎯 Entry (Long):
0.06929 – 0.06858
(Entry from current price is acceptable with proper position sizing and disciplined risk management.)
🎯 Targets:
• TP1: 0.0800
• TP2: 0.08745
❌ Stop Loss:
• Daily candle close below 0.06625
📈 Risk-to-Reward:
Close to 1:6 overall
💡 Will buyers defend the 0.0692–0.0694 support zone and push DOGEUSDT toward 0.08745, or will sellers break support and invalidate the bullish setup? 👇
DOGE is at the end of its bearish trend! (4H)From the point where we placed the red arrow on the chart, it appears that the final part of the correction has formed a contracting triangle, which is approaching completion.
High-volume meme coins appear to be on the verge of starting a bullish move. Dogecoin always receives special attention as well.
We are looking for a buy/long position in the green zone. If the price reaches the green zone, we will enter the position.
The targets are marked on the chart.
A daily candle close below the invalidation level will invalidate this analysis.
If you have a coin or altcoin you want analyzed, first hit the like button and then comment its name so I can review it for you.
Do you also think DOGE COIN is bullish?
DOGE will pumped by pump.fun community after long consolidation?From here it could go more sidelines before a breakout, no signs of volume increase and reversal yet... could it pump in august? Yes, but it also could take few more months. If you're long DOGE could be very boring unless pump.fun community decide to give a little spark of joy to their supreme old Master of MEME.
$DOGEUSDT.P🚀 DOGEUSDT.P is showing signs of increasing bullish momentum. If buyers maintain control, we could see strong buying pressure and a potential breakout in the coming sessions.
📊 Keep DOGEUSDT.P on your watchlist, wait for confirmation before entering a trade, and always use proper risk management. Trade smart and stay disciplined.
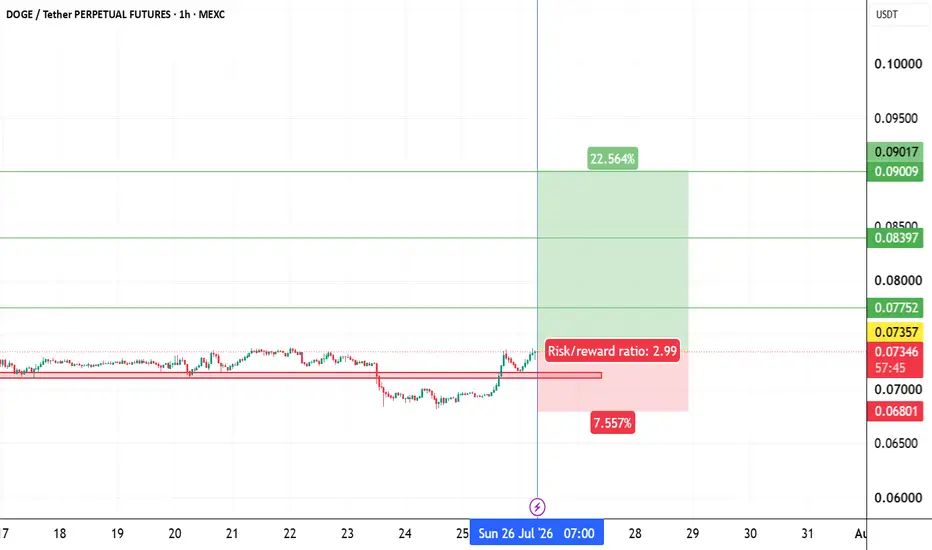
dogeusdt long Roddy01-SIGNALSPROVIDERInstructions:
Entry point: yellow
Stop loss: red
Take profit: green
👉Leverage x 5-10-20 for crypto
👉Leverage x 20-50-100 for commodities, stocks, indices, and forex
👉Margin 1-5% max.
Always practice risk and money management.
Invest a maximum of 5% on any trade or across all your trades.
Invest only what you can afford to lose, as no one is in control of the market.
👉Our analyses are primarily based on:
breakouts: two trend lines (ascending and descending) and a line indicating a horizontal breakout.
chart patterns: shoulders and head, triangle parttern, elliott impulse, etc etc.
We don't always have the time to track them at all times or to represent them visibly, given the numerous signals, the number of channels to manage, and especially because of the often rapid pace of market movements.
indicators: We associate at least two indicators with this technique.
👉Depending on the circumstances, we use specific indicators, often setting 3 or more take profit levels.
👉Indeed, there are good days in trading and also bad days. No one can promise to win every trade, and like all traders worldwide, we also experience stop-loss orders. However, we win more than we lose and remain positive.
👉You can close the position before or after the take profit orders indicated by the green lines if you are personally satisfied; the same applies to stop loss orders.
👉We must stay positive, clear-headed, and humble.
we cannot provide all instructions or all trades here on this channel.
Good luck to us all, and may God guide us. Amen.
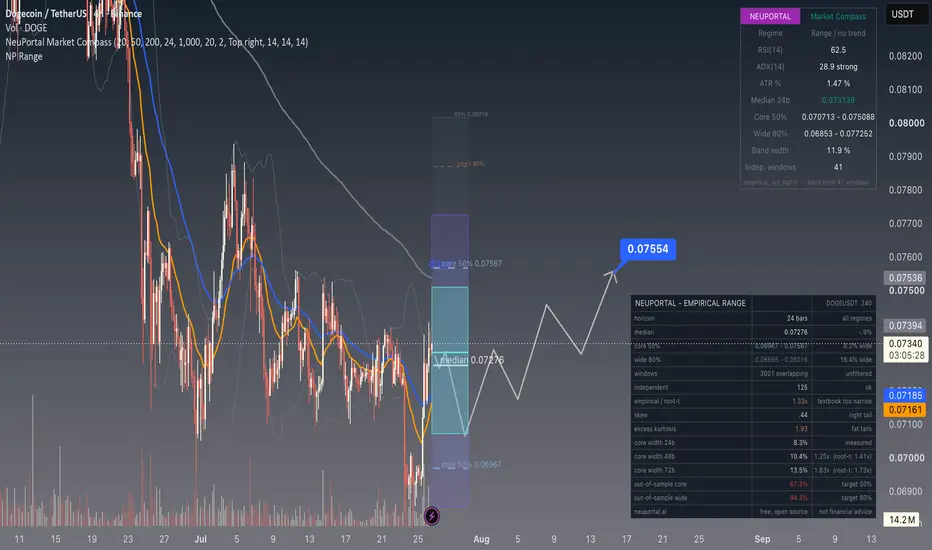
NeuPortal | DOGE - a round trip across the 50% zoneThe view: down first to the floor of the measured zone, then a stepped recovery back to its ceiling. The grey path drops to about 0.06967 - the bottom of the 50% core - and then climbs in stages, with pullbacks along the way, to 0.07554, which sits just under the core top at 0.07567.
Say plainly what that shape is: a full round trip across the core zone inside one horizon. Both edges get visited. That is a much bigger claim about the route than an endpoint sitting inside the band suggests, and it should be judged as such. The endpoint is unremarkable - it is where the band already was. The journey is the actual assertion, and it is the part most likely to be wrong.
MEASURED, 24-bar horizon:
Median 0.07276
Core 50% 0.06967 - 0.07567
Wide 80% 0.06657 - 0.08006
125 independent windows, not the 3,001 overlapping ones
WHAT SUPPORTS A RANGE READ: skew is +0.44 here, a RIGHT tail, which is unusual - most of what I measure leans left. And the band widens more slowly than diffusion predicts: 8.3% at 24 bars, 10.4% at 48 (1.25x where root-t expects 1.41x), 13.5% at 72 (1.63x against 1.73x). Slower-than-root-t scaling is what rangebound behaviour looks like in the numbers, and it argues for travel back toward the middle rather than a sustained break in either direction.
A CAVEAT I WILL NOT HIDE: the regime line reads range with no trend, while ADX prints 28.9, which is nominally strong. Those two disagree. I am siding with the range read because the width scaling supports it, but a strong ADX in a market I am calling rangebound is exactly the sort of tension that resolves against whoever ignored it.
WHERE THIS BAND IS WEAK - AND IT IS THE OPPOSITE PROBLEM FROM MOST: out-of-sample coverage runs 67.3% in the core against a 50% target, and 94.3% wide against 80%. This band is too WIDE, not too narrow. Over-coverage is a failure in the same way under-coverage is: a range that swallows almost everything can never be caught being wrong, and being uncatchable is not the same as being right. So price finishing inside these zones should impress nobody, including me.
Also worth stating: sigma times root-t on this instrument comes out at 0.75x the empirical width. The textbook band here is materially too narrow - the reverse of what it does on gold, where the same formula runs too wide.
Invalidation: acceptance below 0.06657, the 80% floor. That is where the range read stops being a read.
The forecast is the band. The drawn path is one illustration of a route through it, and a band is scored on coverage across many calls, not on one arrow.
Educational content - not financial advice, and not a betting tip.
$DOGE Eye Breakout as Bulls Return StronglyDogecoin Price Prediction: DOGE Bulls Test Key Trendline Resistance
Dogecoin is approaching one of the most important technical levels on its 4-hour chart. After several failed attempts, buyers are once again challenging the descending trendline that has capped every rally throughout July.
At the time of writing, DOGE is trading around $0.0733, consolidating just below trendline resistance. This compression suggests that volatility is building and a decisive move could be close.
Bullish Scenario
The primary trigger remains a confirmed 4H candle close above the descending trendline.
If buyers successfully reclaim this level, momentum could accelerate toward:
🎯 Resistance 1: $0.07575
🎯 Resistance 2: $0.07913
Recent liquidation data also favors the bulls, with short positions accounting for the majority of liquidations during the latest rally. This indicates bearish traders are beginning to lose control.
Bearish Scenario
Failure to break the trendline keeps the current downtrend intact.
If DOGE is rejected once again, price may revisit:
🔻 Support: $0.07098
A breakdown below this support could expose:
🎯 Next Support: $0.06879
Market Structure
The chart continues to print lower highs beneath a well-respected descending trendline while buyers defend higher lows. This compression typically precedes a strong directional move, making confirmation more important than prediction.
With Bitcoin and Ethereum also approaching critical technical levels, DOGE's next move will likely depend on broader market sentiment.
Key Levels
Current Price: ~$0.0733
Resistance: $0.07575
Major Resistance: $0.07913
Support: $0.07098
Major Support: $0.06879
Final Outlook
DOGE is entering a decision zone where neither bulls nor bears have full control. A confirmed breakout above the descending trendline would strengthen the bullish case toward $0.07575 and $0.07913.
However, another rejection could send the price back to $0.07098, with $0.06879 becoming the next downside objective if support fails.
Wait for confirmation, manage risk, and let the market reveal its direction before committing to a position.
This analysis is for educational purposes only and should not be considered financial advice.
#DOGEUSDT Only One Scenario Left: UP#DOGE
The price is moving within a descending channel on the 1-hour timeframe and has reached the lower boundary. It is now poised for a bounce and is expected to retest this boundary.
The Relative Strength Index (RSI) indicates a downward trend, which is likely to continue given the overbought conditions.
There is a key support zone in green at 0.06979. The price has bounced off this zone several times, making it a strong support level.
The price is trending towards the 100-period moving average, which we are approaching. This trend supports an upward move.
Entry Price: 0.07200
Target 1: 0.07300
Target 2: 0.07383
Target 3: 0.07480
Stop Loss: At the resistance zone in green
Remember this simple rule: Money management.
Any questions? Please leave a comment.
Thank you.
Is Another 16% Drop Coming for dogecoin?Hi,
For dogecoin, I expect at least another 16% decline in the short term. The price is approaching the top of its channel and a very important daily resistance level. My target is $0.062.
Need a little love!
We pour love into every post your support keeps us inspired! Don’t be shy, we’d love to hear from you on comments. Big thanks
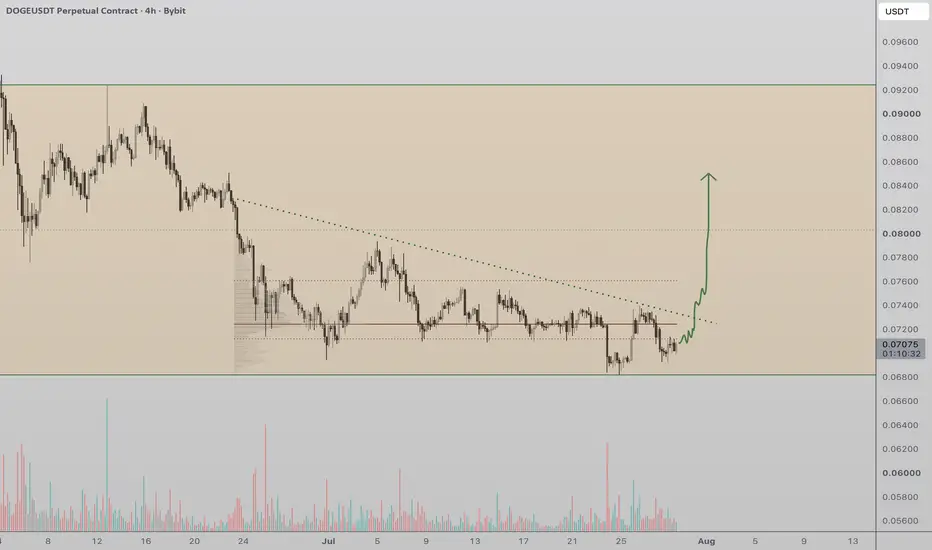
Dogecoin Bottoming StructureDogecoin is currently trading at a major area of support, with price action sitting around the Value Area Low (VAL) of its current trading range. This region has previously attracted buyers, and recent price behaviour suggests demand is beginning to return as the market stabilises. The positive reaction around this level indicates that sellers are losing momentum, increasing the probability that a local bottom is beginning to form.
Despite this encouraging price action, bulls still face an important challenge. The primary obstacle remains the dynamic resistance that has been capping every recovery attempt throughout the recent downtrend. As long as price remains below this descending resistance, upside momentum is likely to remain limited, with consolidation continuing inside the existing range.
A confirmed breakout above the dynamic resistance would represent an important technical shift. Such a move would indicate that buyers are regaining control and could trigger a rally towards the range high, where the next significant area of supply is located. Momentum traders would likely view this as confirmation that the current accumulation phase has transitioned into a new bullish expansion.
For now, the technical outlook remains constructive while Dogecoin holds above the range low support. Maintaining this key level keeps the developing bottom structure intact and favours the probability of a larger recovery once resistance is eventually broken.
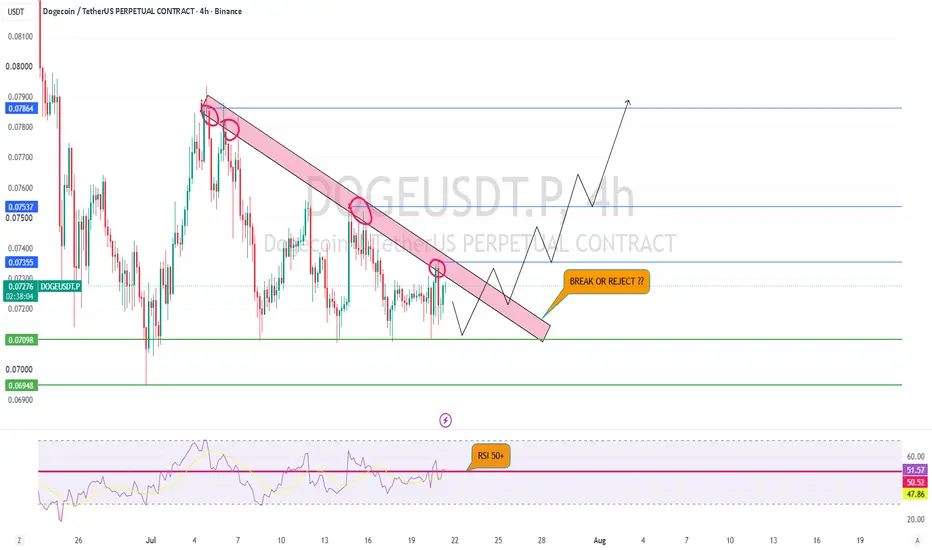
$DOGE Is Testing a Key Level... Breakout or Another Rejection?DOGE Is Testing a Key Level... Breakout or Another Rejection? 👀
DOGE has been respecting this descending trendline for quite some time, and now price is getting very close to a decision point. Personally, I'm not interested in chasing the move before confirmation. If buyers can push above the trendline, close a strong 4H candle above it, and hold that level on a retest, that would be the first sign that the trend might finally be changing. RSI is also trying to stay above the 50 level, which adds a bit more confidence, but on its own that's not enough for me.
If the breakout is confirmed, I'll be watching the next resistance levels as potential targets because momentum can build quickly once this trendline is broken. On the other hand, if price gets rejected here again and loses the 0.0709 support, this bullish setup is no longer valid and we could see another move lower before any real recovery starts. For now, patience is the best strategy. I'd rather wait for the market to confirm the direction than enter too early and get caught in a fake breakout.
#DOGEUSDT 4h / QM#DOGEUSDT 4h
Do you think DOGE is coiling up for a breakout?
A clean QM pattern is forming, and it has the potential to push the price higher.
There are two bullish scenarios:
1️⃣ Price rallies directly from the current level.
2️⃣ Price first sweeps liquidity by engulfing the yellow zone, then reverses higher toward the red supply zones.
The bearish scenario is that the QM pattern fails, the support level breaks, and price continues its decline.
In that case, the next downside targets would be the blue demand zones.
In my opinion, this setup is worth considering for a long position—but with controlled risk, since the higher-timeframe trend is still bearish.
Also, place your stop loss with some distance below the yellow zone, as many traders are likely placing their stops right around that area.
We'll be watching it closely and keep you updated.
CRYPTOCAP:DOGE
dogeusdt longInstructions:
Entry point: yellow
Stop loss: red
Take profit: green
👉Leverage x 5-10-20 for crypto
👉Leverage x 20-50-100 for commodities, stocks, indices, and forex
👉Margin 1-5% max.
Always practice risk and money management.
Invest a maximum of 5% on any trade or across all your trades.
Invest only what you can afford to lose, as no one is in control of the market.
👉Our analyses are primarily based on:
breakouts: two trend lines (ascending and descending) and a line indicating a horizontal breakout.
chart patterns: shoulders and head, triangle parttern, elliott impulse, etc etc.
We don't always have the time to track them at all times or to represent them visibly, given the numerous signals, the number of channels to manage, and especially because of the often rapid pace of market movements.
indicators: We associate at least two indicators with this technique.
👉Depending on the circumstances, we use specific indicators, often setting 3 or more take profit levels.
👉Indeed, there are good days in trading and also bad days. No one can promise to win every trade, and like all traders worldwide, we also experience stop-loss orders. However, we win more than we lose and remain positive.
👉You can close the position before or after the take profit orders indicated by the green lines if you are personally satisfied; the same applies to stop loss orders.
👉We must stay positive, clear-headed, and humble.
we cannot provide all instructions or all trades here on this channel.
Good luck to us all, and may God guide us. Amen.
DOGE Is Setting a Trap—Will You Be Ready Before It Explodes?Yello Paradisers! Are you prepared for a potential sharp move on #DOGE, or are you still underestimating what’s quietly building behind the scenes? At first glance, this structure might seem like a simple and healthy pullback. But when we strip away emotions and analyse the chart objectively, a completely different narrative emerges. This is not random price action this is a high-risk, high-opportunity zone where discipline matters far more than opinions.
💎#DOGE has broken above the descending resistance trend line of a falling-wedge pattern and successfully retested it. At the same time, a clear bullish RSI divergence has formed, adding further strength to the bullish probability.
💎As long as price continues to hold momentum with in the OB + FVG zone, the structure remains constructive. The first important resistance level to watch is 7920. A clean reaction around this level will be important probability, because it can show whether buyers are strong enough to continue controlling the move.
💎#DOGE has recently printed a classic selling climax, followed by a climactic action candle supported by ultra-high volume. This is a textbook indication of accumulation. Historically, this exact behaviour appears when smart money begins positioning ahead of a larger move. While subtle to the untrained eye, this probability carries significant weight for experienced traders.
💎#DOGE has also swept the liquidity below the selling climax and then broken above the upper trigger line with a strong momentum candle. This suggests that weak hands were pushed out before stronger buyers stepped in with conviction. If the prices sustain this momentum, the next upside path can open toward 8530, which is currently acting as a major structural resistance level.
💎If #DOGE fails to hold bullish momentum and a momentum candle closes below 6700, the current bullish probability becomes invalid. In that case, we could see further downside pressure.
That is why Paradisers, we are playing it safe right now. If you want to be consistently profitable, you need to be extremely patient and always wait only for the best, highest probability trading opportunities only on confirmations.
MyCryptoParadise
iFeel the success🌴
DOGE at macro floor: base recovery toward $0.08349The Macro Picture 🗺️
DOGE unwound from the $0.11861 macro ceiling all the way down and has flattened into a base just above the $0.06820 floor, now at $0.07263. The steep selling has given way to a sideways grind — exhaustion rather than continuation.
The Setup ⚙️
The Accumulation Zone 🟢
$0.06820–0.06952 is where the selling has dried up. Macro Support and the Local Low have both held on retest, and this is the demand shelf a recovery would build from.
The Decision Point 🔴
$0.07695 (Local High) is the structural gate. Before it, the $0.08349 measured-move target is the first objective — reclaiming it proves buyers are stepping back in.
The Roadmap 🛣️
Hold the $0.06820 floor → break $0.07695 → run toward $0.08349. Invalidation is a clean daily close below $0.06820 — that voids the accumulation thesis.
This is a textbook DCA Accumulation Zone setup: scale in across the $0.06820–0.06952 band and let the base do the work.
#DOGE #Dogecoin #crypto #trading #TA #3Commas #DCA
DOGEUSDT Daily 25th JulyDOGEUSDT | Daily | Consolidation at Major Support – Breakout or Breakdown?
Dogecoin remains in a long-term bearish trend, but recent price action suggests that selling pressure is gradually weakening as the market enters a consolidation phase above a key demand zone.
Price is currently trading around $0.069, where buyers have repeatedly defended the market. This range could become the foundation for a bullish reversal—but only if buyers reclaim higher resistance levels.
📊 Market Structure
The overall market structure remains bearish, with a sequence of lower highs and lower lows still intact. However, the recent sideways movement indicates a possible accumulation phase after the latest decline.
At this stage, DOGE is trading inside a narrow range, and the next significant move will likely be determined by a breakout from this consolidation.
🔑 Key Support Levels
$0.0690 – Current support and demand zone.
$0.0494 – Major Daily/H4 support.
$0.0415 – Strong long-term support.
🚧 Key Resistance Levels
$0.075–0.078 – First resistance area.
$0.1172 – Major supply zone and the most important resistance on the chart.
🟢 Bullish Scenario
If buyers manage to defend the $0.069 support and push price above $0.078, bullish momentum could accelerate toward the $0.1172 resistance.
A confirmed Daily close above $0.1172 would invalidate the current bearish structure and could signal the beginning of a medium-term bullish trend.
🔴 Bearish Scenario
Failure to hold $0.069 would likely trigger another wave of selling toward $0.0494.
A breakdown below $0.0494 would expose the final major support around $0.0415, where buyers may attempt to regain control.
💡 Conclusion
DOGE is currently trading at a critical technical level. The market is neutral in the short term, but the higher-timeframe trend remains bearish until key resistance levels are broken.
A breakout above the current consolidation range would provide the first confirmation of bullish strength, while a loss of support could extend the downtrend.
Overall Bias: Neutral → Bearish
Key Levels
Support: 0.0690 | 0.0494 | 0.0415
Resistance: 0.0780 | 0.1172
Trading Tip: Wait for a confirmed breakout or breakdown before considering new positions. Trading inside the current range carries a higher risk of false moves.
#DOGEUSDT Only One Scenario Left: UP#DOGE
The price is moving within a descending channel on the 1-hour timeframe and has reached the lower boundary. It is now poised for a bounce and is expected to retest this boundary.
The Relative Strength Index (RSI) indicates a downward trend, which is likely to continue given the overbought conditions.
There is a key support zone in green at 0.06984, and the price has bounced off this zone several times, making it a strong support level.
The price is trending towards the 100-period moving average, which we are approaching. This trend supports an upward move.
Entry Price: 0.07171
Target 1: 0.07206
Target 2: 0.07266
Target 3: 0.07336
Stop Loss: At the resistance zone in green
Remember this simple rule: Money management.
Any questions? Please leave a comment.
Thank you.