Polkadot: New all-time high? Long-term analysis —$9.6, $19 & $30September 2026, at bottom prices, produced the highest volume on a single weekly session since March 2024. March 2024 was a six months long bullish wave peak, yet the high volume session was very similar to the one recently. That is, the activity present at the recent market bottom is very strong and this indicates an upcoming change of trend. An uptrend can lasts for years.
Let's consider the DOTUSDT (Polakdot) chart long-term, the weekly timeframe. I just mentioned the volume signal and this
In-depth trading ideas
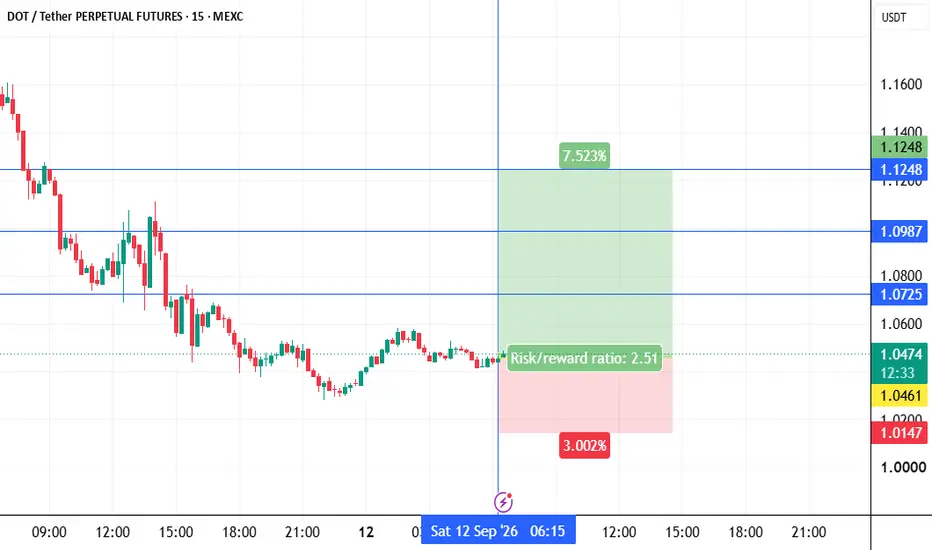
dotusdt longINSTRUCTIONS TO READ AND TO FOLLOW:
Entry point: yellow
Stop loss: red
Take profit: green or blue
👉Leverage x 5-10-20 for crypto
👉Leverage x 20-50-100 for commodities, stocks, indices, and forex
👉Margin 1-5% max:
This limits your maximum loss to 5% and guarantees that you retain 95% of your portfolio in the event of a stop-loss.
🔥🔥🔥🔥🔥🔥🔥🔥🔥🔥🔥🔥🔥🔥
ALWAYS PRACTICE RISK AND MONEY MANAGEMENT:
🔥🔥🔥🔥🔥🔥🔥🔥🔥🔥🔥🔥🔥🔥
👉Invest a maximum of 5% on any trade or across all your trades.
Invest only what you can aff
DOT: Rising Wedge Pattern-It's getting ready to fall DOT: Rising Wedge Pattern-It's getting ready to fall
DOT completed a bearish wedge pattern on the 4H chart. The price broke down of the pattern signaling a potential fall.
The previous 3 candles are all clear and bearish adding more value to the bearish scenario.
On the other hand, BTC is still in correction and may fall or who knows what form it might take at this point, since the move last week was aggressively bullish and it will take time before we see the next wave.
All this prolong
Reject 1.25 again and DOT slides to 0.95DOT is pushing back into the 1.25 resistance that has capped every attempt higher, and the setup favors sellers on the rejection.
🟠 Why This Level Matters:
This zone rejected price on the last test and pushed it straight back down. Price is now retesting the same level with no sign of strength behind the move. Until 1.25 breaks and holds, the ceiling stays intact.
🟠 Gameplan / Primary Scenario:
Sell the rejection at 1.25. If the next 48 hours show weakness near resistance, we ride the cont
DOTUSDT Analyses-58, September 30, 2026
Welcome to my page! I share daily technical analyses of crypto and other charts here.
BINANCE:DOTUSDT
🔍 Market Structure Analysis:
DOT has turned bullish on the 1H chart, with higher lows and higher highs supporting the current bullish structure.
🎯 Entry & Exit Signal:
Buy Entry: 1.237
Stop Loss: 1.221
Targets: 1.269 R/R:2 - 1.275 - 1.300
Key Support & Resistance:
Key Resistance: 1.275 / 1.300
Key Support Area: 1.225 / 1.150
⚠️Risk Management:
Maximum 1% risk per trade.
❤️Fo
$DOT | 4H | BUY SETUP |Everyone is calling BINANCE:DOTUSDT a "dead zombie chain."
But the charts and tokenomics tell a completely different story.
Here is why the crowd is panic-selling right before a high-probability asymmetric opportunity. 👇
📊 THE OBVIOUS NARRATIVE vs. THE DATA
The retail crowd sees CRYPTOCAP:DOT down 98% from its $55.00 ATH, currently trading at $1.039. They think the project is dead and momentum is gone.
But look at the 4H market structure:
This isn't a collapse. It is a textbook, low-vo
dotusdt longINSTRUCTIONS TO READ AND TO FOLLOW:
Entry point: yellow
Stop loss: red
Take profit: green or blue
👉Leverage x 5-10-20 for crypto
👉Leverage x 20-50-100 for commodities, stocks, indices, and forex
👉Margin 1-5% max:
This limits your maximum loss to 5% and guarantees that you retain 95% of your portfolio in the event of a stop-loss.
🔥🔥🔥🔥🔥🔥🔥🔥🔥🔥🔥🔥🔥🔥
ALWAYS PRACTICE RISK AND MONEY MANAGEMENT:
🔥🔥🔥🔥🔥🔥🔥🔥🔥🔥🔥🔥🔥🔥
👉Invest a maximum of 5% on any trade or across all your trades.
Invest only what you can aff
dotusdt longINSTRUCTIONS TO READ AND TO FOLLOW:
Entry point: yellow
Stop loss: red
Take profit: green or blue
👉Leverage x 5-10-20 for crypto
👉Leverage x 20-50-100 for commodities, stocks, indices, and forex
👉Margin 1-5% max:
This limits your maximum loss to 5% and guarantees that you retain 95% of your portfolio in the event of a stop-loss.
🔥🔥🔥🔥🔥🔥🔥🔥🔥🔥🔥🔥🔥🔥
ALWAYS PRACTICE RISK AND MONEY MANAGEMENT:
🔥🔥🔥🔥🔥🔥🔥🔥🔥🔥🔥🔥🔥🔥
👉Invest a maximum of 5% on any trade or across all your trades.
Invest only what you can aff
DOT: Can the rebound clear 1.18, or does it fail? | Sep 25, 2026Is this a recovery, or only a rebound into resistance? The next test matters more than the candles already printed.
SIGNAL UNDER REVIEW — conditional short scenario, not an immediate sell.
BINANCE:DOTUSDT, 4-hour candles. September 25, 2026, approximately 02:06 UTC (04:06 CEST): price near 1.158 USDT. The current candle is unfinished.
1. OBSERVATION
DOT recently traded above 1.20, dropped toward 1.10, and rebounded into the 1.17–1.18 area. That rebound remains below the recent peaks near 1.22.
DOTUSDT M15 LongH1 Context: Strong bullish trend from 0.9315 low, price ran all the way to the Fib 1.0 extension at 1.1727. Alligator lines fanning up throughout the move. RSI reached overbought and is now pulling back to 74/68, a healthy reset. Price is currently retracing into the Fib 0.786 level at 1.1211, which is a natural pullback zone within a bullish trend. H1 bias remains bullish.
M15 Story: After the impulse high, price pulled back sharply into the zone 1.1379-1.1514, touching the M15 Alligator lips
DOT/USDT Bullish ideaHello guys,
So my thougts are pure speculation until confirmation reached.
My thought process in trading follows this
Speculation then confirmation then trade setup then entry.
I like to watch the whole move down rather than the small timeframe setups and confirmations, because I'm looking for a big move.
I guess the chart speaks for itself, if the speculation becomes real and confirmation is reached I'll then update and show my trading setup.
Please let me know what you think.
DOT – Bearish Setup Below 1.0739, Eyes on 0.85 TargetDOT is coiling above key support after a sharp short squeeze, and a break lower opens the door for a clean short.
Why This Level Matters:
Price is pressing into the 1.0739 support after failing to hold the highs near 1.25. The recent squeeze into 1.1819 trapped late longs, and momentum has stalled directly on this level.
Gameplan / Primary Scenario:
Wait for a confirmed break and close below 1.0739. Once structure breaks, short the retest of the broken level and ride continuation lower tow
dotusdt Roddy01-SIGNALSPROVIDERInstructions:
Entry point: yellow
Stop loss: red
Take profit: green
👉Leverage x 5-10-20 for crypto
👉Leverage x 20-50-100 for commodities, stocks, indices, and forex
👉Margin 1-5% max.
Always practice risk and money management.
Invest a maximum of 5% on any trade or across all your trades.
Invest only what you can afford to lose, as no one is in control of the market.
👉Our analyses are primarily based on:
breakouts: two trend lines (ascending and descending) and a line indicating a horizontal
DOT Price Action: Key Support Under PressureDOT price action is currently undergoing a correction from higher-timeframe resistance, bringing price back toward a key support region. This area is technically significant due to the confluence of VWAP, the EMA ribbon, and the 0.618 Fibonacci retracement level.
If this support region holds and buyers begin to respond, the structure could allow for a rotation back toward the higher-timeframe resistance area. However, this would depend on price confirmation and sustained acceptance above the su
dot looking very good here DOT/USDT has shown a potentially important shift in structure. The market has broken above the key descending trendline and also reclaimed the important horizontal resistance area, followed by a successful retest of the breakout zone. This combination suggests that selling pressure may be weakening and buyers could be stepping back in. If the retest continues to hold and price builds momentum above this area, the probability of a recovery move increases, with the next major resistance zones beco
DOT | The Downtrend Broke — Two Pools Sit AboveBy analyzing the #DOT (Polkadot) chart on the 6H timeframe, we can see a market that spent months making lower lows and has now stopped doing so. The structure has flipped, the retracement that followed was defended, and price is pushing into a region with two clear pools of liquidity resting above it.
6H Timeframe
The context first, because it explains why the break matters.
From June onward, DOT was in a clean bearish sequence. Every recovery attempt ended in another BOS to the downside
DOT Wyckoff Accumulation Signals a Potential Bullish ReversalYello Paradisers! are DOT sellers about to get trapped just before a potentially powerful bullish expansion? We are currently seeing a high-probability setup developing on DOTUSDT based on a combination of Wyckoff accumulation, Dow Theory, price action, and RSI divergence.
💎#DOT recently formed a new lower low(According to Dow Theory), which technically keeps the broader bearish structure intact. However, something important happened at that latest low: while price created a lower low, the RSI
Polkadot climbs out of bottom rangeDOTUSDT (Polkadot) just now is starting to recover from a 7 months long sideways period at bottom prices. Just last week the highest buy-volume appeared since November 2024. This signal always, always, precedes a massive bullish wave.
Whenever really high volume shows up at bottom prices after a sideways period, this is the clear signal that a bullish market phase is about to start or already under way.
It is already happening. It is already under way.
Polkadot is early to move, yet to move;
EMA Shelf Rebalance Before Long ExpansionDOT/USDT has reached our area of interest. I expect further downside delivery into the EMA Shelf / 1.414–1.618 POI to rebalance the existing imbalance.
After a reaction and buyer confirmation from this area, I will be looking for a long setup followed by external expansion to the upside.
The entry area and main target are marked on the chart.
Scenario: POI → EMA Shelf → Rebalance → Long Setup → External Expansion.
DOT Approaches the Final Barrier — Breakout or Rejection?This chart shows a long-term downtrend that is still controlled by the Descending Trendline. The current price is around $0.93 and is approaching the intersection between the descending trendline and the horizontal resistance at $1.00, making this a very important area for determining the next major move.
---
📉 Pattern: Descending Trendline
🔻 The Descending Trendline is formed by connecting a series of Lower Highs (LH) since the September–October 2025 peak.
As long as price remains below thi
DOT/USDT (1h) Testing a Double Bottom BreakoutDOT/USDT is forming a double bottom pattern on the 1H chart, with two major lows developing around the $0.84–$0.85 area. Price has recovered strongly from the second bottom and is now approaching the slightly rising neckline resistance around $0.904–$0.908.
A confirmed breakout and hold above the neckline could validate the bullish reversal structure and trigger a move toward the $0.96 measured target area. A rejection from the neckline would keep the pattern unconfirmed and could lead to anoth