DYDX - Is 127X Potential Real?Hello, Skyrexians!
We’re back with another crypto market analysis. Today, we’re looking at DYDX, an altcoin we believe may be undervalued. dYdX is a decentralized exchange, and we think that could be an important fundamental advantage as the regulatory landscape evolves.
This is not a price prediction. It’s an idea to consider: if centralized exchanges become less attractive to retail traders, what might that mean for a leading DEX like BINANCE:DYDXUSDT ?
DYDX currently has a fully diluted
In-depth trading ideas
Can Bulls Break the Long-Term Downtrend?dYdX is developing an interesting recovery structure after holding the support zone around $0.08–$0.11. The immediate focus is $0.21 key resistance. A clean breakout and sustained acceptance above this level could open the path toward the $0.58–$0.75 supply zone and the long-term descending trendline.
For now, we are watching how price reacts around the immediate demand area and whether buyers can maintain the recovery.
⚠️ Bullish invalidation: $0.0662
Probability over prediction.
WESLAD Resea
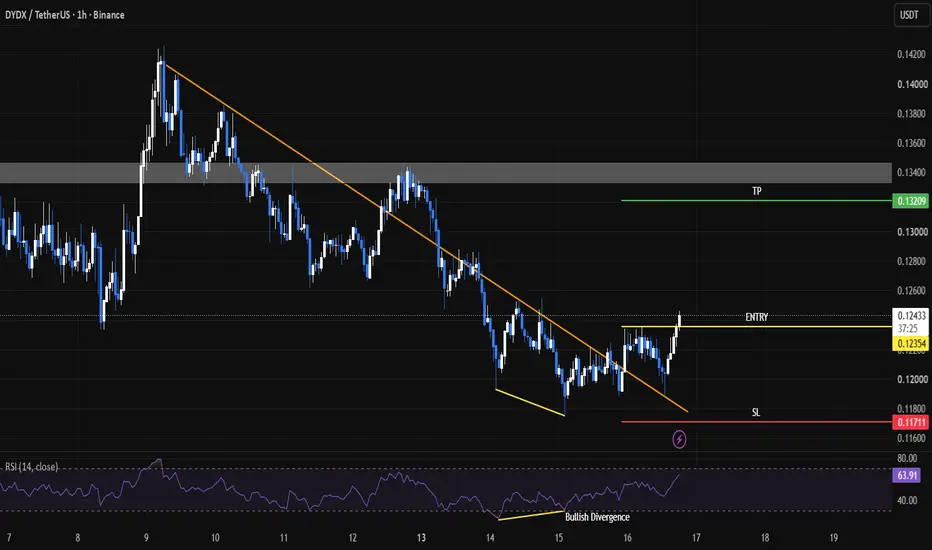
Dydxusdt longINSTRUCTIONS TO READ AND TO FOLLOW:
Entry point: yellow
Stop loss: red
Take profit: green or blue
👉Leverage x 5-10-20 for crypto
👉Leverage x 20-50-100 for commodities, stocks, indices, and forex
👉Margin 1-5% max:
This limits your maximum loss to 5% and guarantees that you retain 95% of your portfolio in the event of a stop-loss.
🔥🔥🔥🔥🔥🔥🔥🔥🔥🔥🔥🔥🔥🔥
ALWAYS PRACTICE RISK AND MONEY MANAGEMENT:
🔥🔥🔥🔥🔥🔥🔥🔥🔥🔥🔥🔥🔥🔥
👉Invest a maximum of 5% on any trade or across all your trades.
Invest only what you can aff
DYDXUSDT Forming Bullish PennantDYDXUSDT is forming a clear bullish pennant pattern, a classic bullish reversal signal that often indicates an upcoming breakout. The price has been consolidating within a narrowing range, suggesting that selling pressure is weakening while buyers are beginning to regain control. With consistent volume confirming accumulation at lower levels, the setup hints at a potential bullish breakout soon. The projected move could lead to an impressive gain of around 40% to 50% once the price breaks above
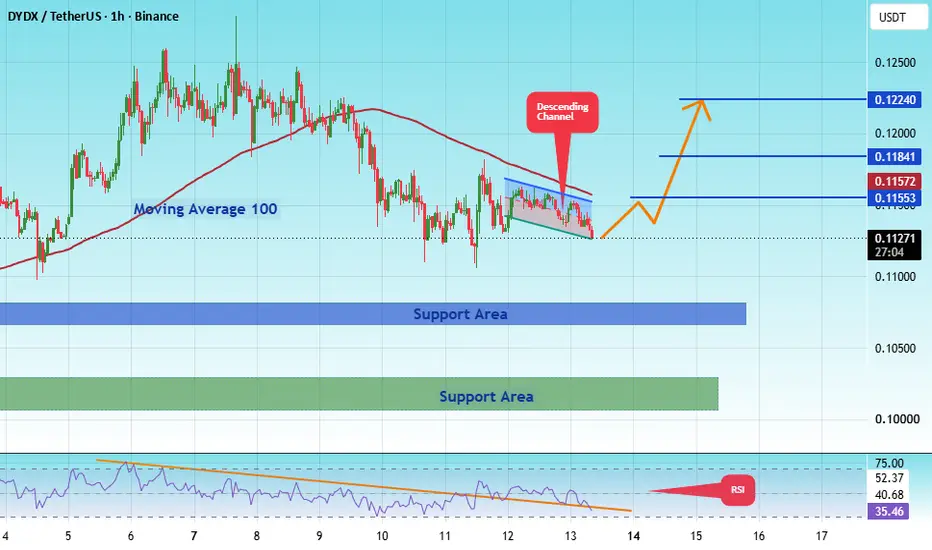
#DYDXUSDT Breakout from Falling Wedge |#DYDX
The price is moving within a descending channel on the 1-hour timeframe; it has reached the lower boundary and is poised for a rebound. A retest of this boundary is expected, supporting some upward movement.
The Relative Strength Index (RSI) indicates a bearish trend, but an upward breakout is likely due to oversold conditions on the 1-hour chart.
There is initial support at 0.1066 acting as a primary support zone.
A key support zone (marked in green) exists at 0.1000; the price has re
DYDX ForecastBINANCE:DYDXUSDT Trade Logic 📈
HTF structure is bullish. On the LTF, we have a healthy impulse and correction, with the final bearish leg losing momentum.
A strong positive HD adds further confirmation for a potential bullish move.
Entry: Limit order within the entry zone.
Trigger: None — limit entry.
Bullish bias with controlled risk. 🎯
I appreciate hearing your technical opinions and insights on this potential scenario.
⚠️ Risk Disclaimer
All analyses, market views, and scenarios presen
dydxusdt short Rodd01-SIGNALSPROVIDERInstructions:
Entry point: yellow
Stop loss: red
Take profit: green
👉Leverage x 5-10-20 for crypto
👉Leverage x 20-50-100 for commodities, stocks, indices, and forex
👉Margin 1-5% max.
Always practice risk and money management.
Invest a maximum of 5% on any trade or across all your trades.
Invest only what you can afford to lose, as no one is in control of the market.
👉Our analyses are primarily based on:
breakouts: two trend lines (ascending and descending) and a line indicating a horizontal
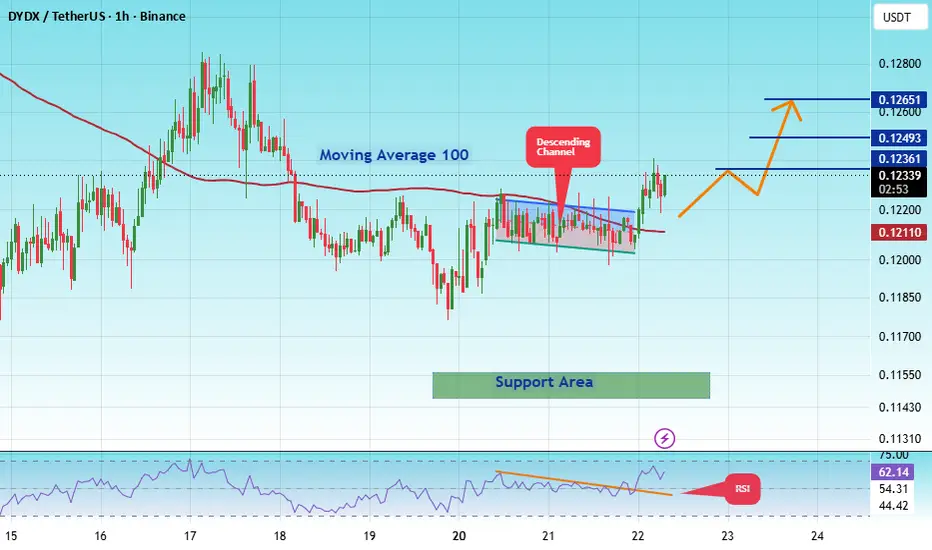
#DYDXUSDT Breakout from Falling Wedge |#DYDX
The price is moving within a descending channel on the 1-hour timeframe and has reached the lower boundary. It is now poised for a bounce and is expected to retest this boundary.
The Relative Strength Index (RSI) indicates a downward trend, which is likely to continue given the overbought conditions.
There is a key support zone in green at 0.09768, and the price has bounced off this zone several times, making it a strong support level.
The price is trending towards the 100-period movin
DYDX Trapped Under Resistance — Breakout or Breakdown?📊 Technical Analysis — DYDX/USDT
⏳ Time Frame: 2D
💱 Pair: DYDX/USDT
📍 Current Price: around $0.113
The DYDX chart is currently showing a consolidation structure that is becoming increasingly compressed beneath the Descending Trendline, while price continues to receive reactions from the $0.094–$0.080 demand/support zone.
This structure is particularly interesting because the longer price remains within a narrowing range, the greater the potential for a strong expansion/breakout once one side o
DYDX/USDT H1: Strong downward pressure on dydx🎯 TP1: $0.115890 (+1.45%) │ TP2: $0.114180 (+2.91%)
🛑 SL: $0.120863 (-2.77%) │ R/R: 1 : 1.05
⚠️ SL is placed beyond the moving averages cluster (EMA20/50) to prevent premature stop-outs due to price retracements.
FUNDAMENTAL BACKGROUND
DYDX is moving without its own catalysts, following the broader market. The rising Fear & Greed Index (78) supports speculative assets but increases the risk of sharp pullbacks. No significant macro releases for the asset are expected in the coming days—the marke
DYDX/USDT H1: Sellers dominate in the mid-range🎯 TP1: $0.121042 (+2.39%) │ TP2: $0.118084 (+4.77%)
🛑 SL: $0.129379 (-4.34%) │ R/R: 1 : 1.1
⚠️ SL is placed beyond the nearest candle tails to reduce the risk of accidental triggering
FUNDAMENTAL BACKGROUND
The crypto market is showing growth, but DYDX is lagging behind the overall trend due to a lack of project catalysts. The Fear & Greed Index is in the Greed zone (62), supporting altcoins, but DYDX's weakness relative to BTC indicates a lack of buyer interest. The macroeconomic backdrop is n
#DYDX/USDT Breakout from Falling Wedge |#DYDX
The price is moving within a descending channel on the 1-hour timeframe and has reached the lower boundary. It is now poised for a bounce and is expected to retest this boundary.
The Relative Strength Index (RSI) indicates a downward trend, which is likely to continue given the overbought conditions.
There is a key support zone in green at 0.1097, and the price has bounced off this zone several times, making it a strong support level.
The price is trending towards the 100-period moving
dydxusdt longInstructions:
Entry point: yellow
Stop loss: red
Take profit: green
👉Leverage x 5-10-20 for crypto
👉Leverage x 20-50-100 for commodities, stocks, indices, and forex
👉Margin 1-5% max.
Always practice risk and money management.
Invest a maximum of 5% on any trade or across all your trades.
Invest only what you can afford to lose, as no one is in control of the market.
👉Our analyses are primarily based on:
breakouts: two trend lines (ascending and descending) and a line indicating a horizontal
DYDX: Approaching Ascending Channel Lower SupportDYDX: Approaching Ascending Channel Lower Support – Strategic Long Setup Targeting $0.120 Ceiling
DYDX maintains a stable short-term bullish structure, coiling smoothly within an ascending parallel channel. The recent cooling-off pullback has drawn the price action back down toward the lower support boundary of this accumulation framework. According to textbook trading rules, retesting a channel support floor within an established uptrend presents an exceptional entry for trend-following Long
#DYDX/USDT Breakout from Falling Wedge |#DYDX
The price is moving within a descending channel on the 1-hour timeframe and has reached the lower boundary. It is now poised for a bounce and is expected to retest this boundary.
The Relative Strength Index (RSI) indicates a downward trend, which is likely to continue given the overbought conditions.
There is a key support zone in green at 0.09800, and the price has bounced off this zone several times, making it a strong support level.
The price is trending towards the 100-period movin
DYDXUSDT Forming Falling WedgeDYDXUSDT is forming a clear falling wedge pattern, a classic bullish wave signal that often indicates an upcoming breakout. The price has been consolidating within a narrowing range, suggesting that selling pressure is gradually weakening while buyers are beginning to regain control. With consistent trading volume confirming accumulation at lower levels, the current setup hints at a potential bullish breakout in the near future. The projected move could lead to an impressive gain of around 90% t
#DYDX/USDT Breakout from Falling Wedge |#DYDX
The price is moving within a descending channel on the 1-hour timeframe and has reached the lower boundary. It is now poised for a bounce and is expected to retest this boundary.
The Relative Strength Index (RSI) indicates a downward trend, which is likely to continue given the overbought conditions.
There is a key support zone in green at 0.11470, and the price has bounced off this zone several times, making it a strong support level.
The price is trending towards the 100-period movin
DYDX: local squeeze with $0.168 destinationThe Macro Picture 🗺️
DYDX has spent months rotating inside a broad range, and price has pulled back to $0.1217 — right onto the $0.1103 local-low shelf, with the $0.0790 macro floor deeper below. The tape is compressing near range support as it waits for the next impulse.
The Setup ⚙️
The Range Floor 🟢
$0.1103 (Local Low) is the immediate demand shelf; $0.0790 (Macro Support) is the deeper floor. Holding above $0.1103 keeps the base intact.
The Decision Point 🔴
$0.1983 (Local High) is the ga
DYDXUSDT Forming Ascending ChannelDYDXUSDT is forming a clear ascending channel pattern, a classic bullish wave signal that often indicates an upcoming breakout. The price has been consolidating within a well-defined upward channel, suggesting that selling pressure is gradually weakening while buyers continue to maintain control. With consistent trading volume confirming accumulation at lower levels, the current setup hints at a potential bullish breakout in the near future. If the breakout is confirmed, the projected move could
Bullish momentum + Break of structure on DYDXDYDXUSDT has broken its previous LH and a breakout of a strong trend line along with a bullish divergence on the 1hr timeframe indicates a bullish momentum building. Price may surge up 8% on spot position.
The Defi sector has been performing well overall and volumes are building. therefore a strong upside potential could be observed.
Going long on DYDXUSDT
DYDX USDT LONG SIGNAL#76. DYDX./USDT – Trade Setup (LONG)
📈 Position Type: LONG
🕒 Timeframe: 1H
📊 Market: Futures
💰 Entry Zone:
0.1187
0.1143
🛑 Stop-Loss:
0.1130
🎯 Take-Profit Targets:
• TP1: 0.1215
• TP2: 0.1244
• TP3: 0.1279
• TP4: 0.1318
⚙️ Leverage:
5 *10
▫️ After TP1, move SL to Entry + 0.2%.
▪️ Exit Plan:
• 40% at TP1
• 20% at TP2
• 20% at TP3
20% at. TP4
📌 Risk Management:
Risk only 1–2% of your capital per trade.
⚠️ Always check and confirm the setup on your chart before entering the tr
DYDX Market Structure
The first thing to notice is that after the heavy decline at the beginning of the chart, the price has entered an accumulation phase. It has been fluctuating between around 0.126 and 0.133 for several days, which usually means that the sellers have lost their initial strength.
The recent move to the 0.141 area was the first attempt by the buyers to break out of this box, but they have not yet managed to consolidate above it and are now pulling back.
I see this pullback as mor