DYDXUSDT Forming Falling WedgeDYDXUSDT is forming a clear falling wedge pattern, a classic bullish wave signal that often indicates an upcoming breakout. The price has been consolidating within a narrowing range, suggesting that selling pressure is gradually weakening while buyers are beginning to regain control. With consistent trading volume confirming accumulation at lower levels, the current setup hints at a potential bullish breakout in the near future. The projected move could lead to an impressive gain of around 90% to 100% once the price breaks above the key wedge resistance.
This falling wedge pattern is typically seen at the end of downtrends or corrective phases, representing a potential shift in market sentiment from bearish to bullish. Traders closely watching DYDXUSDT are noticing strengthening momentum as the price approaches a critical breakout zone. Strong trading volume adds confidence to this setup, showing that market participants are positioning early in anticipation of a sustained upward move.
Growing investor interest in DYDXUSDT reflects increasing confidence in the project's long-term fundamentals and its improving technical outlook. If the breakout is confirmed with sustained buying volume, it could mark the beginning of a fresh bullish leg. The ongoing consolidation phase suggests steady accumulation, creating favorable conditions for a strong continuation rally once the resistance level is cleared.
Traders may find this an attractive medium-term opportunity, especially as the falling wedge pattern nears completion and buying pressure continues to build. A confirmed breakout could attract additional market participation and accelerate the move toward the projected upside target.
✅ Show your support by hitting the like button.
✅ Leaving a comment below! (What is You opinion about this Coin)
Your feedback and engagement keep me inspired to share more insightful market analysis with you!
In-depth trading ideas
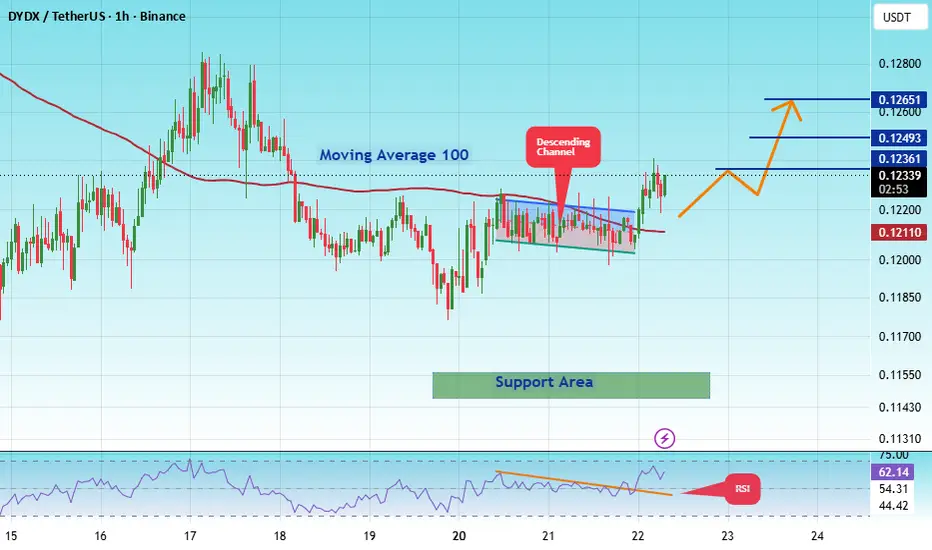
#DYDX/USDT Breakout from Falling Wedge |#DYDX
The price is moving within a descending channel on the 1-hour timeframe and has reached the lower boundary. It is now poised for a bounce and is expected to retest this boundary.
The Relative Strength Index (RSI) indicates a downward trend, which is likely to continue given the overbought conditions.
There is a key support zone in green at 0.11470, and the price has bounced off this zone several times, making it a strong support level.
The price is trending towards the 100-period moving average, which we are approaching. This trend supports an upward move.
Entry Price: 0.1200
Target 1: 0.1236
Target 2: 0.1249
Target 3: 0.1265
Stop Loss: At the resistance zone in green
Remember this simple rule: Money management.
Any questions? Please leave a comment.
Thank you.
DYDXUSDT Forming Ascending ChannelDYDXUSDT is forming a clear ascending channel pattern, a classic bullish wave signal that often indicates an upcoming breakout. The price has been consolidating within a well-defined upward channel, suggesting that selling pressure is gradually weakening while buyers continue to maintain control. With consistent trading volume confirming accumulation at lower levels, the current setup hints at a potential bullish breakout in the near future. If the breakout is confirmed, the projected move could lead to an impressive gain of around 90% to 100%.
This ascending channel pattern is commonly seen during sustained uptrends or strong recovery phases, signaling continued bullish momentum and the potential for another leg higher. Traders closely watching DYDXUSDT are noticing strengthening momentum as the price approaches a key breakout zone. Healthy trading volume further reinforces this setup, indicating that market participants are positioning early in anticipation of a strong continuation move.
Growing investor interest in DYDXUSDT reflects increasing confidence in the project's long-term potential and its current technical structure. If buyers successfully push the price above the channel resistance with sustained volume, it could mark the beginning of a fresh bullish leg. The ongoing consolidation within the channel suggests steady accumulation, creating favorable conditions for a powerful rally once the breakout is confirmed.
Traders may find this an attractive medium-term opportunity, especially as the ascending channel pattern continues to develop and buying pressure steadily increases. A confirmed breakout could attract additional market participation and accelerate the move toward the projected upside target.
✅ Show your support by hitting the like button.
✅ Leaving a comment below! (What is You opinion about this Coin)
Your feedback and engagement keep me inspired to share more insightful market analysis with you!
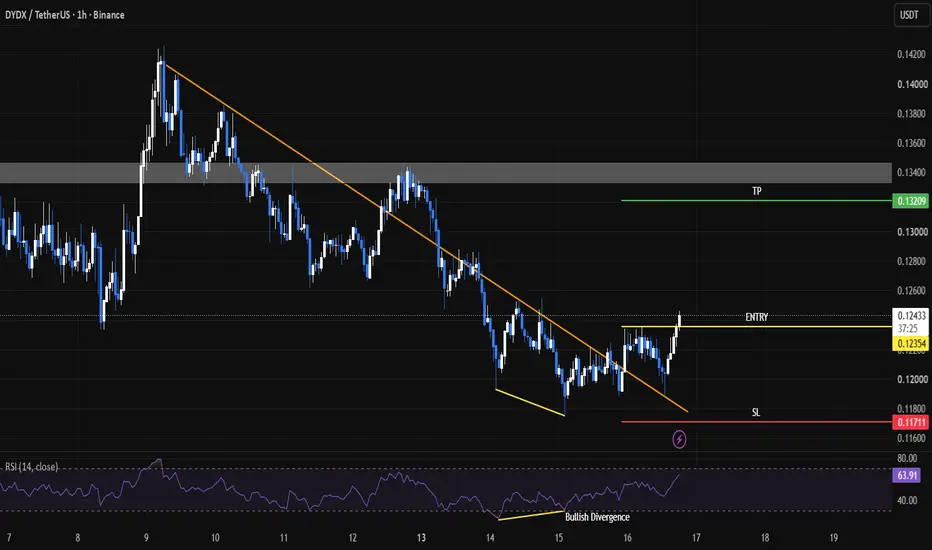
Bullish momentum + Break of structure on DYDXDYDXUSDT has broken its previous LH and a breakout of a strong trend line along with a bullish divergence on the 1hr timeframe indicates a bullish momentum building. Price may surge up 8% on spot position.
The Defi sector has been performing well overall and volumes are building. therefore a strong upside potential could be observed.
Going long on DYDXUSDT
#DYDX/USDT Breakout from Falling Wedge |#DYDX
The price is moving within a descending channel on the 1-hour timeframe and has reached the lower boundary. It is now poised for a bounce and is expected to retest this boundary.
The Relative Strength Index (RSI) indicates a downward trend, which is likely to continue given the overbought conditions.
There is a key support zone in green at 0.09800, and the price has bounced off this zone several times, making it a strong support level.
The price is trending towards the 100-period moving average, which we are approaching. This trend supports an upward move.
Entry Price: 0.1070
Target 1: 0.1100
Target 2: 0.1121
Target 3: 0.1156
Stop Loss: At the resistance zone in green
Remember this simple rule: Money management.
Any questions? Please leave a comment.
Thank you.
DYDX: local squeeze with $0.168 destinationThe Macro Picture 🗺️
DYDX has spent months rotating inside a broad range, and price has pulled back to $0.1217 — right onto the $0.1103 local-low shelf, with the $0.0790 macro floor deeper below. The tape is compressing near range support as it waits for the next impulse.
The Setup ⚙️
The Range Floor 🟢
$0.1103 (Local Low) is the immediate demand shelf; $0.0790 (Macro Support) is the deeper floor. Holding above $0.1103 keeps the base intact.
The Decision Point 🔴
$0.1983 (Local High) is the gate that flips the bigger structure. Before it, the $0.168 measured-move target is the first real objective.
The Roadmap 🛣️
Hold above $0.1103 → reclaim through equilibrium → run toward $0.168 → then challenge $0.1983. Invalidation is a clean daily close below $0.1103, which reopens the $0.0790 macro floor.
This is a GRID Range Play: a defined band to rotate, buying the lower half and scaling out into strength.
More setups in profile.
#DYDX #crypto #trading #TA #3Commas #GRID
DYDX USDT LONG SIGNAL#76. DYDX./USDT – Trade Setup (LONG)
📈 Position Type: LONG
🕒 Timeframe: 1H
📊 Market: Futures
💰 Entry Zone:
0.1187
0.1143
🛑 Stop-Loss:
0.1130
🎯 Take-Profit Targets:
• TP1: 0.1215
• TP2: 0.1244
• TP3: 0.1279
• TP4: 0.1318
⚙️ Leverage:
5 *10
▫️ After TP1, move SL to Entry + 0.2%.
▪️ Exit Plan:
• 40% at TP1
• 20% at TP2
• 20% at TP3
20% at. TP4
📌 Risk Management:
Risk only 1–2% of your capital per trade.
⚠️ Always check and confirm the setup on your chart before entering the trade.
DYDX Market Structure
The first thing to notice is that after the heavy decline at the beginning of the chart, the price has entered an accumulation phase. It has been fluctuating between around 0.126 and 0.133 for several days, which usually means that the sellers have lost their initial strength.
The recent move to the 0.141 area was the first attempt by the buyers to break out of this box, but they have not yet managed to consolidate above it and are now pulling back.
I see this pullback as more of a break in the trend as long as the recent lows hold rather than the start of a new decline.
A few positives:
Volume has increased when the box breaks.
Bullish candles have been stronger than bearish candles.
The important bottom of the 0.126-0.128 range has not been broken yet.
My view on DYDX is currently cautiously bullish, but I would look for the main confirmation from price reaction to support or consolidation above resistance, not just from recent growth.
DYDX USDT SHORT SIGNALDYDX/USDT – Trade Setup (SHORT)
📈 Position Type: SHORT
🕒 Timeframe: 1 H
📊 Market: Futures
💰 Entry Zone:
0.1329
🛑 Stop-Loss:
0.14
🎯 Take-Profit Targets:
• TP1: 0.1277
• TP2: 0.1233
• TP3: 0.1197
• TP4: 0.1144
TP5: 0.1091
TP6: 0.1041
⚙️ Leverage:
5- 3
⚠️ After reaching TP1, move Stop-Loss to Entry Price.
📌 Risk Management:
Risk only 1–2% of your capital per trade.
Always confirm the setup on your chart before entry
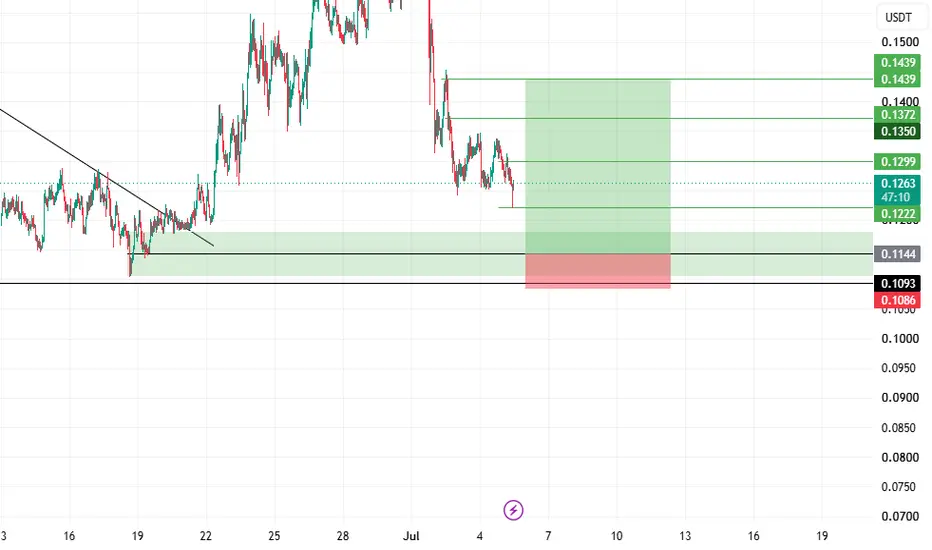
DYDX USDT LONG SIGNALDYDX/USDT – Trade Setup (LONG)
📈 Position Type: LONG
🕒 Timeframe: 1 H
📊 Market: Futures
💰 Entry Zone:
0.1145
🛑 Stop-Loss:
0.1085
🎯 Take-Profit Targets:
• TP1: 0.1221
• TP2: 0.1299
• TP3: 0.1370
• TP4: 0.1439
TP5:
TP6:
⚙️ Leverage:
5- 3
⚠️ After reaching TP1, move Stop-Loss to Entry Price.
📌 Risk Management:
Risk only 1–2% of your capital per trade.
Always confirm the setup on your chart before entry
#DYDXUSDT Breakout from Falling Wedge |#DYDX
The price is moving within a descending channel on the 1-hour timeframe and has reached the lower boundary. It is now poised for a bounce and is expected to retest this boundary.
The Relative Strength Index (RSI) indicates a downward trend, which is likely to continue given the overbought conditions.
A key support zone (in green) has been identified at 0.1100. The price has bounced off this zone several times, making it a strong support level.
The price is trending towards the 100-period moving average, which we are approaching. This trend supports an upward move.
Entry Price: 0.1300
First Target: 0.1369
Second Target: 0.1460
Third Target: 0.1563
You can close at the second target or wait for the third target. The choice is yours.
Stop Loss: At the resistance zone (in green).
Remember this simple rule: Money Management.
Any questions? Please leave a comment.
Thank you.
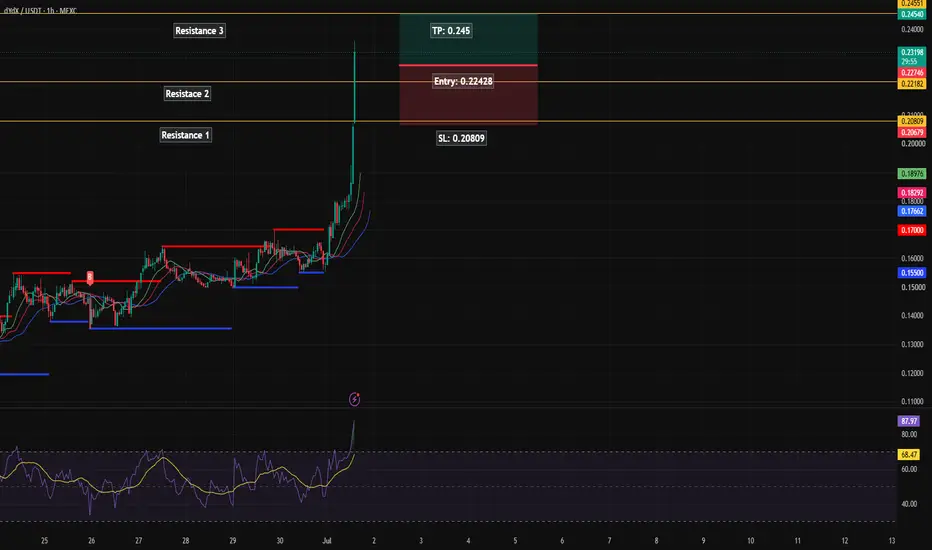
DYDX: Strong Resistance BreakoutDYDX: Strong Resistance Breakout – Patiently Waiting for a Retest to Optimize Long Position
DYDX's trend structure has just recorded a major turning point with the appearance of an incredibly powerful bullish momentum. A long-bodied candle accompanied by a surge in trading volume has officially triggered, pushing the price completely above the solid resistance zone around the $0.20 mark. This action serves as a confirmation signal that the bulls have regained control of the market, ending the previous prolonged suppression phase.
Even though the current upward impulse is highly exhilarating, the smart trading behavior right now is strictly to avoid chasing the crowd's psychological momentum (FOMO). Sharp short-term price increases typically generate profit-taking pressure, leading to technical corrections. Therefore, the most logical strategy is to patiently set up an entry order within the new support area around the $0.20 milestone.
This price zone converges multiple key technical factors to establish a solid foundation. First, it represents a significant psychological round number level. Second, this mark perfectly aligns with the retest of the recently broken long-term descending trendline. Patiently waiting for a price reaction in this area not only increases the probability of a successful trade, but also offers a massive advantage by minimizing the stop-loss distance, effectively protecting capital before the market initiates its next upward wave.
Disclaimer: This is not financial advice, DYOR.
DYDX has started a major bullish phase (1D)First of all, you should know that the price has already increased significantly, so it needs to correct before reaching our entry zones where we can enter the position.
It appears that a large ABC structure on DYDX has been completed, and the price has moved upward with momentum. We expect at least one bullish phase of the same degree as the previous correction to form.
The current move looks like Wave 1 (or A) of the bullish phase. If the price corrects and reaches our entry levels, we expect it to find support again and continue toward higher targets, as the larger bullish structure on DYDX appears significant.
The targets are marked on the chart.
A daily candle closing below the invalidation level would invalidate this analysis.
If you have a coin or altcoin you want analyzed, first hit the like button and then comment its name so I can review it for you.
Do you also think DYDX is bullish?
#DYDX/USDT Breakout from Falling Wedge |#DYDX
The price is moving within a descending channel on the 1-hour timeframe and has reached the lower boundary. It is now poised for a bounce and is expected to retest this boundary.
The Relative Strength Index (RSI) indicates a downward trend, which is likely to continue given the overbought conditions.
There is a key support zone in green at 0.1412, and the price has bounced off this zone several times, making it a strong support level.
The price is trending towards the 100-period moving average, which we are approaching. This trend supports an upward move.
Entry Price: 0.1610
First Target: 0.1660
Second Target: 0.1715
Third Target: 0.1776
You can stop at the first and second targets and close below them, or continue towards the third target. Stop Loss: At the resistance zone in green.
Remember this simple rule: Money Management.
Any questions? Please leave a comment.
Thank you.
DYDX Is Compressing Before Its Next MoveDYDXUSDT / 1h
-- STRUCTURE --
Trend: BULLISH / moderate
Pattern: HH_HL
BOS: BULLISH @ 0.12384
Recent close above the 0.12384 swing high (08:00 candle high 0.12486) breaks the prior short-term structure to the upside
CHoCH: BULLISH @ 0.12017
After the 0.11883 low, the sequence of higher lows shifted character from corrective downside to constructive upside
Primary Recovery from a local downswing; price reclaiming above all major moving averages after a corrective dip toward 0.1188
and Behavior Stair-stepping higher over the last 9 candles with rising lows and improving closes
Price corrected from the 0.1285 region into 0.1188, then formed a clear higher-low base and recovered above SMA28/58/128. The MA cluster is tightly compressed (0.1212-0.1236), indicating an emerging directional resolution rather than a strong established trend.
-- MOVING AVERAGES --
Stack: BULLISH
-- MOMENTUM --
ATR is stable near the lower end of its recent range (0.0018-0.0021), suggesting volatility is contracting during the recovery
Volatility: low-to-moderate
-- LIQUIDITY --
Support: 0.12017 | 0.11883 | 0.1212
Resistance: 0.12486 | 0.1272 | 0.1285
Sweep: DOWNSIDE 0.11883
The 02:00 candle wicked to 0.11883 and closed back at 0.12017, sweeping sell-side liquidity below the 0.1196 prior low before reversing
FVG: 0.12328 - 0.12486 (BULLISH)
Impulsive 08:00 candle left an inefficiency between open and high that price may revisit as support
-- RISK --
Rating: MEDIUM
ATR Stop: 0 pts
Context: Low ATR favors tighter structural stops, but proximity to the 0.12486 resistance increases reaction risk
-- SUMMARY --
Recovering market transitioning from corrective decline to early bullish structure
Price has reclaimed all major MAs and is testing the upper boundary of the recent range at 0.12486 with improving momentum
Confirms change, A decisive close above 0.12486 confirms continuation; a close below 0.12017 negates the bullish shift
The downside liquidity sweep at 0.11883 followed by higher lows and a momentum-confirmed BOS leans bullish, but tight MA compression and proximity to resistance warrant confirmation before conviction. Watch the 0.12328-0.12486 imbalance as a key support-on-pullback zone.
DYDXUSDT Bullish Structure Emerging After Channel BreakoutPrice has finally broken out of its prolonged descending channel, signaling a potential shift in market structure after months of sustained selling pressure. While the breakout alone is constructive, what makes the current setup particularly interesting is the development of a potential bullish harmonic pattern, with price gradually moving toward its completion zone.
The highlighted demand region remains the most important area on the chart. This zone combines structural support with the harmonic completion area, creating a high-confluence region where buyers may look to re-enter the market.
As long as the demand zone remains protected, the broader outlook favors accumulation over distribution. A successful reaction from this region could provide the momentum needed for a move toward the immediate resistance level, with the higher supply zone becoming the next major objective.
The strongest reversals often begin when a completed correction meets a fresh breakout. DYDX may be approaching that point.
DYDXUSDT SHORT SIGNALDYDX/USDT – Trade Setup (SHORT)
📉 Position Type: SHORT
🕒 Timeframe: 1H
📊 Market: Futures
💰 Entry Zone:
0.1906 – 0.1966
🛑 Stop-Loss:
0.1986
🎯 Take-Profit Targets:
• TP1: 0.1821
• TP2: 0.1796
• TP3: 0.1668
• TP4: 0.1551
• TP5: 0.1445
⚙️ Leverage:
10–5×
🧠 Technical Analysis:
TRUTH is facing strong resistance within the 0.1906–0.1966 supply zone after an extended bullish rally. Price has started to reject from resistance while losing momentum near local highs. Multiple resistance levels are clustered above the current price, increasing the probability of a corrective move toward lower support levels. As long as price remains below 0.1986, the bearish scenario remains valid with potential downside targets at 0.1821, 0.1796, and lower.
📌 Trade Management:
Move SL to Break Even after TP1.
Take partial profits at each target.
Risk only 1–2% per trade.
Always confirm the setup on your chart before entry.
Bearish BAT Pattern Formation on DYDX | 2H Timeframe | PotentialYDX is currently forming a Bullish BAT Harmonic Pattern on the 2-hour timeframe, indicating a possible trend reversal from the current support zone.
🔹 XA, AB, BC, and CD legs are aligning with key Fibonacci retracement and extension levels typically associated with a valid BAT setup.
🔹 Price is approaching the Potential Reversal Zone (PRZ), where buyers may step in and trigger a bearish move.
🔹 Traders should watch for:
bearish candlestick confirmation
RSI bullish divergence
Increased volume
Break below trend line
dydxusdt longInstructions:
Entry point: yellow
Stop loss: red
Take profit: green
👉Leverage x 5-10-20 for crypto
👉Leverage x 20-50-100 for commodities, stocks, indices, and forex
👉Margin 1-5% max.
Always practice risk and money management.
Invest a maximum of 5% on any trade or across all your trades.
Invest only what you can afford to lose, as no one is in control of the market.
👉Our analyses are primarily based on:
breakouts: two trend lines (ascending and descending) and a line indicating a horizontal breakout.
chart patterns: shoulders and head, triangle parttern, elliott impulse, etc etc.
We don't always have the time to track them at all times or to represent them visibly, given the numerous signals, the number of channels to manage, and especially because of the often rapid pace of market movements.
indicators: We associate at least two indicators with this technique.
👉Depending on the circumstances, we use specific indicators, often setting 3 or more take profit levels.
👉Indeed, there are good days in trading and also bad days. No one can promise to win every trade, and like all traders worldwide, we also experience stop-loss orders. However, we win more than we lose and remain positive.
👉You can close the position before or after the take profit orders indicated by the green lines if you are personally satisfied; the same applies to stop loss orders.
👉We must stay positive, clear-headed, and humble.
we cannot provide all instructions or all trades here on this channel.
Good luck to us all, and may God guide us. Amen.
DYDXUSDT 1D#DYDX is trading above the Ichimoku cloud and is currently facing the daily SMA200. It is also forming an inverse head & shoulders pattern. In case of a breakout above the neckline of the pattern, the potential upside targets are:
🎯 $0.21695
🎯 $0.24932
🎯 $0.29540
🎯 $0.35410
⚠️ Always use a tight stop-loss and maintain proper risk management.
DYDXUSDT Forming Bullish MomentumDYDXUSDT is forming a clear bullish momentum pattern, a classic bullish wave signal that often indicates an upcoming breakout. The price has been consolidating within a narrowing range, suggesting that selling pressure is weakening while buyers are beginning to regain control. With consistent volume confirming accumulation at lower levels, the setup hints at a potential bullish breakout soon. The projected move could lead to an impressive gain of around 40% to 50% once the price breaks above the wedge resistance.
This bullish momentum pattern is typically seen at the end of downtrends or corrective phases, and it represents a potential shift in market sentiment from bearish to bullish. Traders closely watching DYDXUSDT are noting the strengthening momentum as it nears a breakout zone. The good trading volume adds confidence to this pattern, showing that market participants are positioning early in anticipation of a reversal.
Investors’ growing interest in DYDXUSDT reflects rising confidence in the project’s long-term fundamentals and current technical strength. If the breakout confirms with sustained volume, this could mark the start of a fresh bullish leg. Traders might find this a valuable setup for medium-term gains, especially as the pattern completes and buying momentum accelerates.
✅ Show your support by hitting the like button and
✅ Leaving a comment below! (What is your opinion about this Coin?)
Your feedback and engagement keep me inspired to share more insightful market analysis with you!