#DYMUSDT may continue its trend after correction#DYM
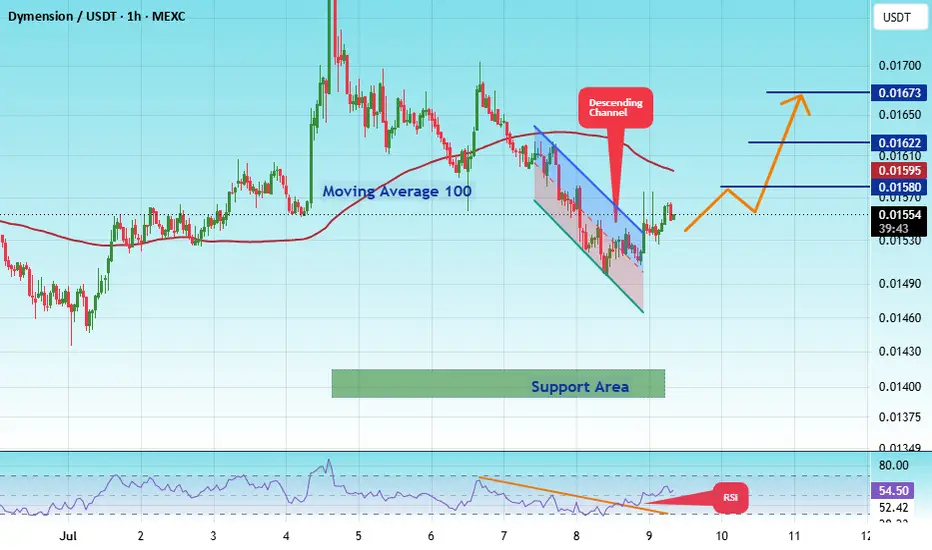
The price is moving within a descending channel on the 1-hour timeframe and has reached the lower boundary. It is now poised for a bounce and is expected to retest this boundary.
The Relative Strength Index (RSI) indicates a downward trend, which is likely to continue given the overbought conditions.
There is a key support zone in green at 0.01391. The price has bounced off this zone several times, making it a strong support level.
The price is trending towards the 100-period moving average, which we are approaching. This trend supports an upward move.
Entry Price: 0.01552
Target 1: 0.01580
Target 2: 0.01622
Target 3: 0.01673
Stop Loss: At the resistance zone in green
Remember this simple rule: Money management.
Any questions? Please leave a comment.
Thank you.
In-depth trading ideas
#DYMUSDT may continue its trend after correction#DYM
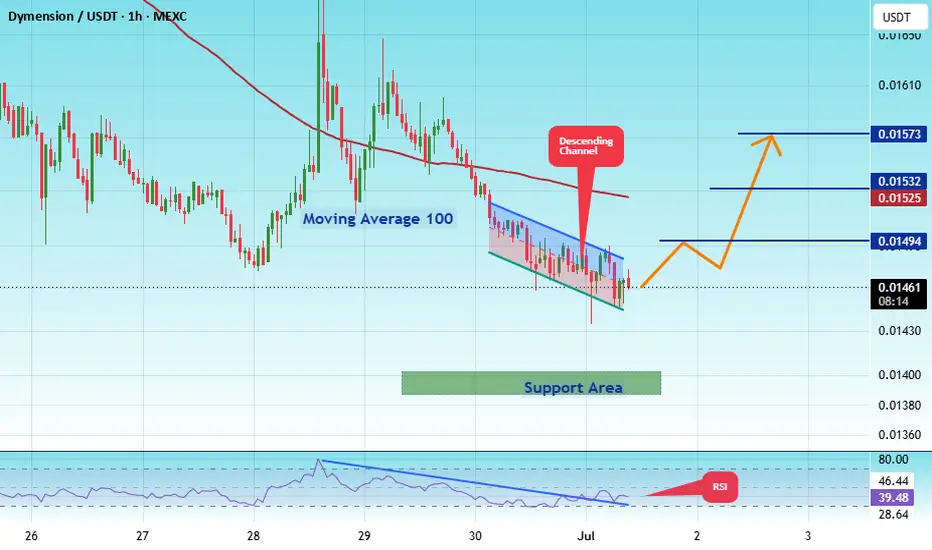
The price is moving within a descending channel on the 1-hour timeframe and has reached the lower boundary. It is now poised for a bounce and is expected to retest this boundary.
The Relative Strength Index (RSI) indicates a downward trend, which is likely to continue given the overbought conditions.
There is a key support zone in green at 0.01380. The price has bounced off this zone several times, making it a strong support level.
The price is trending towards the 100-period moving average, which we are approaching. This trend supports an upward move.
Entry Price: 0.01460
Target 1: 0.01494
Target 2: 0.01510
Target 3: 0.01530
Stop Loss: At the resistance zone in green
Remember this simple rule: Money management.
Any questions? Please leave a comment.
Thank you.
#DYMUSDT may continue its trend after correction#DYM
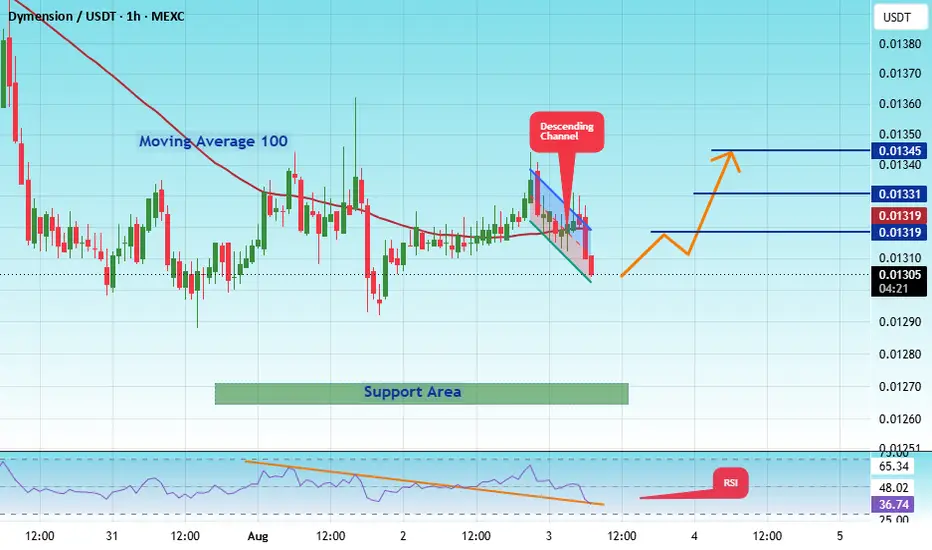
The price is moving within a descending channel on the 1-hour timeframe and has reached the lower boundary. It is now poised for a bounce and is expected to retest this boundary.
The Relative Strength Index (RSI) indicates a downward trend, which is likely to continue given the overbought conditions.
There is a key support zone in green at 0.01265, and the price has bounced off this zone several times, making it a strong support level.
The price is trending towards the 100-period moving average, which we are approaching. This trend supports an upward move.
Entry Price: 0.01305
Target 1: 0.01319
Target 2: 0.01331
Target 3: 0.01345
Stop Loss: At the resistance zone in green
Remember this simple rule: Money management.
Any questions? Please leave a comment.
Thank you.
DYM at macro floor: base recovery toward $0.01680The Macro Picture 🗺️
DYM ground down from the $0.03486 macro ceiling all the way to the $0.01265 macro floor and has flattened onto it at $0.01315. The long, steady bleed has given way to a base right on support — exhaustion rather than continuation.
The Setup ⚙️
The Accumulation Zone 🟢
$0.01265–0.01315 is where the selling has dried up. Macro Support has held on retest, and this is the demand shelf a recovery would build from.
The Decision Point 🔴
$0.02092 (Local High) is the structural gate far above. Before it, the $0.01680 measured-move target is the first objective — reclaiming it proves buyers are stepping back in.
The Roadmap 🛣️
Hold the $0.01265 floor → recover toward $0.01680 as the first leg up. Invalidation is a clean daily close below $0.01265 — that voids the accumulation thesis.
This is a textbook DCA Accumulation Zone setup: scale in across the $0.01265–0.01315 band and let the base do the work.
#DYM #Dymension #crypto #trading #TA #3Commas #DCA
DYM/USDT (1d) Approaching the Apex of a Descending TriangleDYM/USDT is consolidating inside a long-term descending triangle on the daily chart, with price moving closer to the apex.
A confirmed breakout above the descending resistance could signal a bullish reversal. A breakdown below the lower support would confirm bearish continuation and expose the price to further downside.
#DYMUSDT may continue its trend after correction#DYM
The price is moving within a descending channel on the 1-hour timeframe and has reached the lower boundary. It is now poised for a bounce and is expected to retest this boundary.
The Relative Strength Index (RSI) indicates a downward trend, which is likely to continue given the overbought conditions.
There is a key support zone in green at 0.01385. The price has bounced off this zone several times, making it a strong support level.
The price is trending towards the 100-period moving average, which we are approaching. This trend supports an upward move.
Entry Price: 0.01462
Target 1: 0.01494
Target 2: 0.01530
Target 3: 0.01573
Stop Loss: At the resistance zone in green
Remember this simple rule: Money management.
Any questions? Please leave a comment.
Thank you.
#DYMUSDT — Last Line of Defense: Reversal Incoming or Breakdo#DYM
The price is moving within a descending channel on the 1-hour timeframe and has reached the lower boundary. It is now poised for a bounce and is expected to retest this boundary.
The Relative Strength Index (RSI) indicates a downward trend, which is likely to continue given the overbought conditions.
There is a key support zone (in green) at 0.01534. The price has bounced off this zone several times, making it a strong support level.
The price is trending towards the 100-period moving average, which we are approaching. This trend supports an upward move.
Entry Price: 0.01743
Target 1: 0.01813
Target 2: 0.01914
Target 3: 0.02062
Stop Loss: At the resistance zone (in green)
Remember this simple rule: Money management.
Any questions? Please leave a comment.
Thank you.
#DYMUSDT may continue its trend after correction#DYM
The price is moving within a descending channel on the 1-hour timeframe and has reached the lower boundary. It is now poised for a bounce and is expected to retest this boundary.
The Relative Strength Index (RSI) indicates a downward trend, which is likely to continue given the overbought conditions.
A key support zone has been identified in green at 0.01284. The price has bounced off this zone several times, making it a strong support level.
The price is trending towards the 100-period moving average, which we are approaching. This trend supports an upward move.
Entry Price: 0.01500
First Target: 0.01553
Second Target: 0.01629
Third Target: 0.01725
You can close at the second target or wait for the third target. The choice is yours.
Stop Loss: At the resistance zone in green.
Remember this simple rule: Money Management.
Any questions? Please leave a comment.
Thank you.
#DYMUSDT — Last Line of Defense: Reversal Incoming or Breakdo#DYM
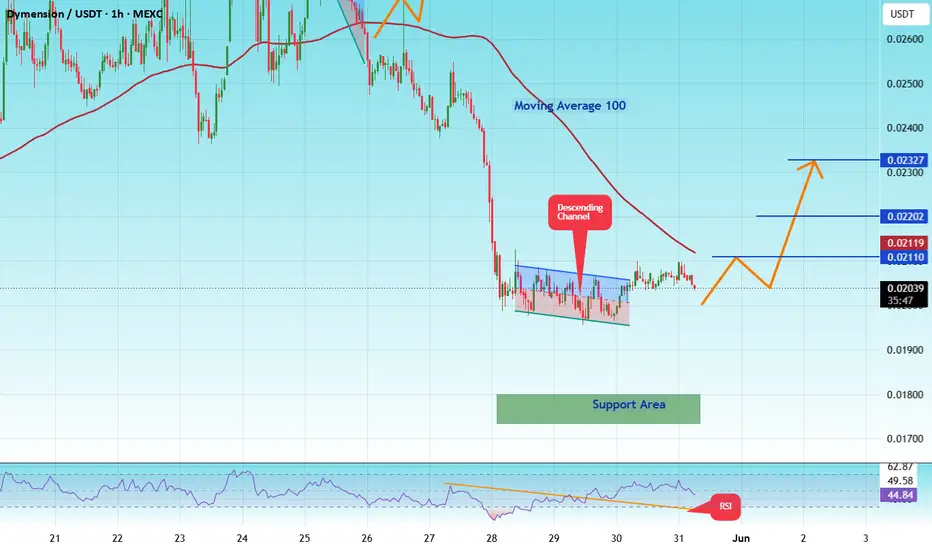
The price is moving within a descending channel on the hourly timeframe. It has reached the lower boundary and is trending towards a bounce. A retest of this boundary is expected.
The Relative Strength Index (RSI) indicates a downward trend, and this trend is likely to continue due to the overbought condition.
A key support zone has been identified in green at 0.01742. The price has bounced off this zone several times, making it a strong support level.
The price is trending towards the 100-period moving average, which we are approaching. This trend supports an upward move.
Entry Price: 0.0200
First Target: 0.2110
Second Target: 0.02210
Third Target: 0.02037
You can close at the second target or wait for the third target to reach it. The choice is yours.
Stop Loss: At the resistance zone in green.
Remember this simple rule: Money Management.
Any questions? Please leave a comment.
Thank you.
#DYMUSDT may continue its trend after correction#DYM
The price is moving within a descending channel on the hourly timeframe. It has reached the lower boundary and is trending towards a bounce. A retest of this boundary is expected.
The Relative Strength Index (RSI) indicates a downward trend, and this trend is likely to continue due to the overbought condition.
A key support zone has been identified in green at 0.02280. The price has bounced off this zone several times, making it a strong support level.
The price is trending towards the 100-period moving average, which we are approaching. This trend supports an upward move.
Entry Price: 0.02630
First Target: 0.02700
Second Target: 0.02811
Third Target: 0.02946
You can close at the second target or wait for the third target to be reached. The choice is yours.
Stop Loss: At the resistance zone in green.
Remember this simple rule: Money Management.
Any questions? Please leave a comment.
Thank you.
DYMUSDT Forming Bullish MomentumDYMUSDT is forming a clear bullish momentum pattern, a classic bullish continuation signal that often points toward a major breakout in the near future. The price has been consolidating within a tightening range, suggesting that selling pressure is gradually weakening while buyers continue to regain control around key support levels. This type of structure is commonly associated with accumulation phases before a strong bullish expansion begins.
The projected breakout from this bullish momentum structure could lead to an impressive gain of around 190% to 200% if the price confirms above the resistance zone with strong volume support. This pattern is frequently observed after corrective phases and may signal a transition from bearish sentiment into a powerful new bullish trend.
Traders closely watching DYMUSDT are noticing strengthening momentum as the price approaches a critical breakout area. The stable trading volume adds confidence to the setup, showing that buyers may already be accumulating positions in anticipation of a bullish continuation move.
Growing investor interest in DYMUSDT reflects increasing confidence in both its technical structure and long-term upside potential. If the breakout confirms with sustained buying pressure and strong follow-through momentum, this could mark the beginning of a powerful bullish wave.
✅ Show your support by hitting the like button and
✅ Leaving a comment below! (What is your opinion about this coin?)
Your feedback and engagement keep me inspired to share more insightful market analysis with you!
#DYM/USDT — Last Line of Defense: Reversal Incoming or Breakdo#DYM
The price is moving within a descending channel on the hourly timeframe. It has reached the lower boundary and is trending towards a bounce. A retest of this boundary is expected.
The Relative Strength Index (RSI) indicates a downward trend, and this trend is likely to continue due to the overbought condition.
A key support zone (in green) was found at 0.03000, and the price has bounced off this zone several times, making it a strong support level.
The price is trending towards the 100-period moving average, which we are approaching. This trend supports an upward move.
Entry Price: 0.03121
First Target: 0.03194
Second Target: 0.03311
Third Target: 0.03458
Stop Loss: At the resistance zone (in green)
Remember this simple rule: Money Management.
Any questions, please leave a comment.
Thank you.
DYMUSDT Forming Bullish MomentumDYMUSDT is forming a clear bullish momentum pattern, a classic bullish wave signal that often indicates an upcoming breakout. The price has been consolidating within a narrowing range, suggesting that selling pressure is weakening while buyers are beginning to regain control. With consistent volume confirming accumulation at lower levels, the setup hints at a potential bullish breakout soon. The projected move could lead to an impressive gain of around 290% to 300% once the price breaks above the wedge resistance.
This bullish momentum pattern is typically seen at the end of downtrends or corrective phases, and it represents a potential shift in market sentiment from bearish to bullish. Traders closely watching DYMUSDT are noting the strengthening momentum as it nears a breakout zone. The strong trading volume adds confidence to this pattern, showing that market participants may already be positioning early in anticipation of a reversal.
Investors’ growing interest in DYMUSDT reflects rising confidence in the project’s long-term fundamentals and current technical strength. If the breakout confirms with sustained volume, this could mark the start of a fresh bullish leg. Traders might find this a valuable setup for medium-term gains, especially as the momentum pattern completes and buying pressure accelerates.
✅ Show your support by hitting the like button and
✅ Leaving a comment below! (What is your opinion about this coin?)
Your feedback and engagement keep me inspired to share more insightful market analysis with you!
DYMUSDT 1DKeep an eye on the #DYM daily chart. The setup looks promising, with RSI and MACD indicating potential bullish momentum. In case of a breakout above the descending resistance and the daily SMA50, the upside targets are:
🎯 $0.0254
🎯 $0.0308
🎯 $0.0352
🎯 $0.0395
🎯 $0.0458
🎯 $0.0537
⚠️ Always remember to use a tight stop-loss and maintain proper risk management.
#DYMUSDT may continue its trend after correction#DYM
The price is moving within a descending channel on the 1-hour timeframe and has reached the lower boundary. It is now poised for a bounce and is expected to retest this boundary.
The Relative Strength Index (RSI) indicates a downward trend, which is likely to continue given the overbought conditions.
There is a key support zone (in green) at 0.01710. The price has bounced off this zone several times, making it a strong support level.
The price is trending towards the 100-period moving average, which we are approaching. This trend supports an upward move.
Entry Price: 0.01834
First Target: 0.01869
Second Target: 0.01912
Third Target: 0.01963
You can stop at the first and second targets and close the price, or continue towards the third target.
Stop Loss: At the resistance zone (in green).
Remember this simple rule: Money Management.
Any questions? Please leave a comment.
Thank you.
#DYMUSDT may continue its trend after correction#DYM
The price is moving within a descending channel on the 1-hour timeframe and has reached the lower boundary. It is now poised for a bounce and is expected to retest this boundary.
The Relative Strength Index (RSI) indicates a downward trend, which is likely to continue given the overbought conditions.
There is a key support zone in green at 0.01594. The price has bounced off this zone several times, making it a strong support level.
The price is trending towards the 100-period moving average, which we are approaching. This trend supports an upward move.
Entry Price: 0.01791
First Target: 0.01861
Second Target: 0.01949
Third Target: 0.02038
You can stop at the first and second targets and close the price, or continue towards the third target. Stop Loss: At the resistance zone in green.
Remember this simple rule: Money Management.
Any questions? Please leave a comment.
Thank you.
DYM/USDT — Long at Reclaimed Support, Structural Shift ConfirmedDYMUSDT Perpetual
Context:
DYM sold off 30%+ from 0.024 to 0.016 over two weeks — a deep correction. But the recovery has been strong and structural. Price has now reclaimed the 0.019 level, which was the key support that held throughout early April before it broke. The structure is shifting.
Why this setup works — three confluences:
Higher low forming — after the sell-off bottomed at 0.016, each pullback is making a higher low. The current retest of 0.019 is building the second higher low in the new recovery structure. That's the earliest confirmation of a trend reversal
Polarity reclaim — the 0.019 zone acted as major support from April 8-10, broke down during the crash, and is now being retested from above. Price holding here confirms the polarity flip — old support broke, became resistance, and is now flipping back to support
Momentum shift — the left side of the chart shows the previous setup at this same price zone had a similar structure — consolidation, breakdown, recovery, and a full move to the upside. The pattern is repeating
A signal is active at this level. Entry at 0.01900.
Trade management:
Entry: 0.01900
Stop Loss: 0.01708 — below the recovery structure
TP1: 0.02100 — mid-range resistance where previous selling occurred
TP2: 0.02222 — upper target for 100% exit
R:R: ~1:1 to TP1, ~1:1.7 to TP2. Managed exit — 50% off at TP1, stop to breakeven, let TP2 ride risk-free.
Invalidation: Close below 0.01708 — the higher low structure fails and the recovery thesis is dead.
The lesson:
Reversals don't happen in a straight line. They build through structure — higher lows, polarity flips, and reclaimed levels. The mistake most traders make is entering at the bottom before any confirmation. The smarter play is waiting for the first higher low to form and entering on the retest. You give up the first 10% of the move in exchange for dramatically higher confidence that the reversal is real.
Signal fired. We took it. Update coming with the result.
#DYMUSDT may continue its trend after correction#DYM
The price is moving within a descending channel on the hourly timeframe. It has reached the lower boundary and is trending towards a bounce. A retest of this boundary is expected.
The Relative Strength Index (RSI) indicates a downward trend, and this trend is likely to continue due to the overbought condition.
A key support zone (in green) was found at 0.01730, and the price has bounced off this zone several times, making it a strong support level.
The price is trending towards the 100-period moving average, which we are approaching. This trend supports a potential upward move.
Entry Price: 0.01920
First Target: 0.02017
Second Target: 0.02107
Third Target: 0.02235
Stop Loss: At the resistance zone (in green)
Remember this simple rule: Money Management.
Any questions? Please leave a comment.
Thank you.
#DYMUSDT may continue its trend after correction#DYM
The price is moving within a descending channel on the 4-hour timeframe. It has reached the lower boundary and is heading for a bounce. A retest of this boundary is expected.
The Relative Strength Index (RSI) indicates a downward trend, and this trend is likely to continue due to the overbought condition.
There is a key support zone in green at 01887, and the price has bounced off this zone several times, making it a strong support level.
The price is trending towards the 100-period moving average, which we are approaching. This trend supports an upward move.
Entry Price: 0.02070
Target 1: 0.02114
Target 2: 0.02242
Target 3: 0.02395
Stop Loss: At the resistance zone in green
Remember this simple rule: Money management.
Any questions, please leave a comment.
Thank you.
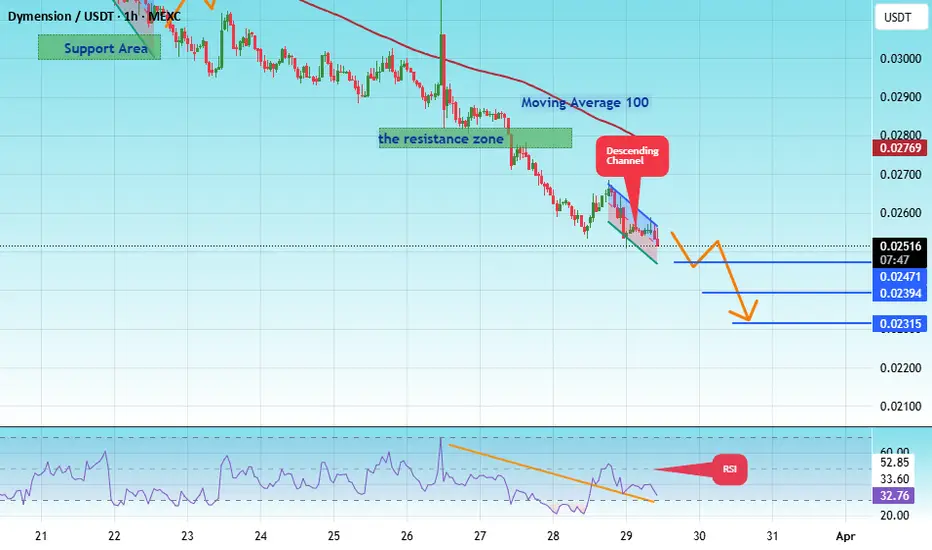
#DYMUSDT may continue its trend after correction#DYM
The price is moving within an ascending channel on the hourly timeframe. It has reached the lower boundary and is heading towards a breakout. A retest of this boundary is expected.
The Relative Strength Index (RSI) indicates a downward trend, and this trend is likely to continue due to the overbought condition.
There is a key resistance zone in green at 0.02800, which the price has bounced off several times, making it a strong support level.
A consolidation trend is observed below the 100-period moving average, which we are approaching. This trend supports a decline towards this level.
Entry Price: 0.02530
Target 1: 0.02480
Target 2: 0.02394
Target 3: 0.02315
Stop Loss: At the resistance zone in green.
Remember this simple rule: Manage your money wisely.
For any questions, please leave a comment.
Thank you.
#DYM/USDT — Last Line of Defense: Reversal Incoming or Breakdo
#DYM
The price is moving within a descending channel on the hourly timeframe. It has reached the lower boundary and is trending towards a bounce. A retest of this boundary is expected.
The Relative Strength Index (RSI) indicates a downward trend, and this trend is likely to continue due to the overbought condition.
There is a key support zone in green at 0.03470 . The price has bounced off this zone several times, making it a strong support level.
The price is trending towards the 100-period moving average, which we are approaching. This trend supports an upward move.
Entry Price: 0.03628
Target 1: 0.03680
Target 2: 0.03763
Target 3: 0.03858
Stop Loss: At the resistance zone in green
Remember this simple rule: Money management.
Any questions, please leave a comment.
Thank you.