DOW JONES Bullish as long as the 1D MA50 holds.Dow Jones (DJIA) has been trading within a Channel Up since early April and right now is slowly rising following a Monday Low near the 1D MA50 (blue trend-line).
The 1D MA50 is now exactly at the bottom (Higher Lows trend-line) of the pattern and is the natural technical Support of this structure,
US30 REJECTION -SELLERS TAKING CONTROL
Dow kissed the ceiling at 52,645... and got sent packing.
That supply zone has rejected price before and it just did it again, no mercy.
Now the flip: old support (52,336–52,418) just became resistance. That's the market telling you who's in charge now. who else here looking for sells ?
DOW JONES Break or make moment for this pattern.Dow Jones (DJIA) has been trading within a Channel Up for almost 3 months but lately is has found itself struggling to maintain the momentum as since the July 07 High, it's under the pressure of a Lower Highs trend-line).
Still, it hasn't closed a 4H candle below the 4H MA100 (green trend-line) yet
Heading towards 50% Fib resistance?US30 is rising to the resistance level, which is a pullback resistance that aligns with the 50% Fibonacci retracement and could reverse from this level to our take-profit.
Entry: 52,819.93
Why we like it:
There is a pullback resistance level that aligns with the 50% Fibonacci retracement.
Stop los
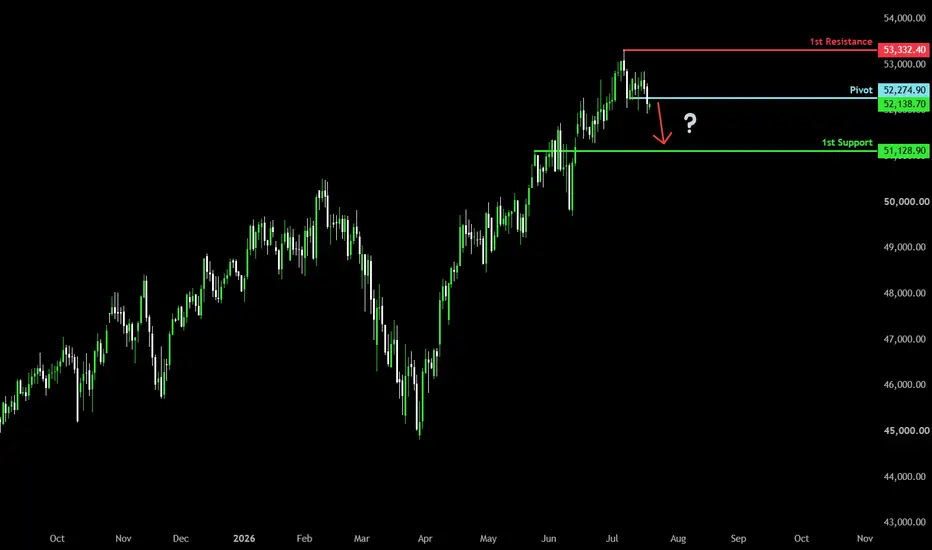
Could we see a drop from here?Dow Jones (US30) is rising towards the pivot, which is a pullback resistance and could reverse toward the 1st support.
Pivot: 52,274.90
1st Support: 51,128.90
1st Resistance: 53,332.40
Disclaimer:
The opinions given above constitute general market commentary and do not constitute the opinion or
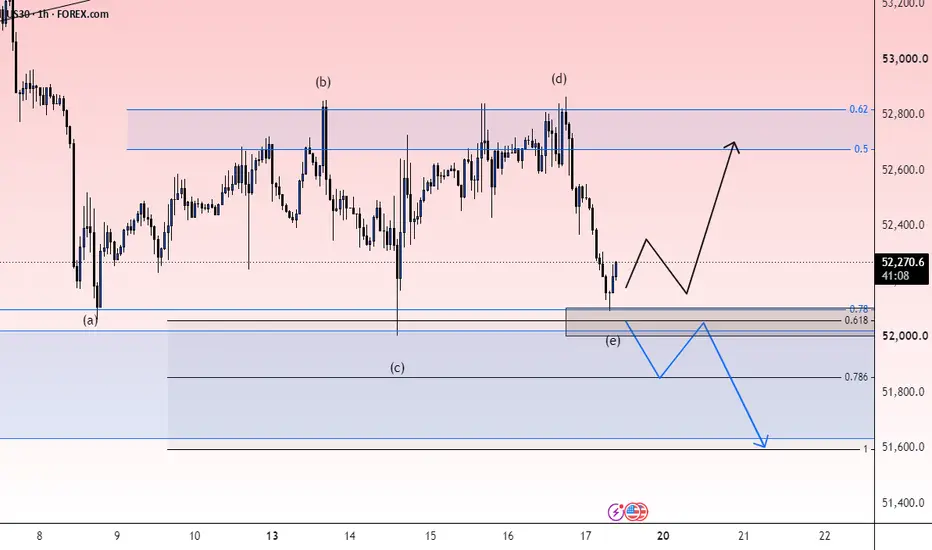
US30: Is the Correction Just Getting Started?US30 appears to have completed a larger impulsive advance and is now showing signs that a broader corrective phase may be unfolding. The current Elliott Wave structure suggests the recent weakness could be the beginning of a deeper pullback rather than a short-lived decline.
We'll be watching how p
DOW JONES: Channel Up correction aiming at 45,000 by year end.Dow Jones is marginally bullish on its 1D technical outlook (RSI = 56.484, MACD = 399.550, ADX = 27.852) as it's having a neutral week but the 1M RSI remains overbought. However it is being rejected on the 5 year Resistance, which has produced the last 3 corrections of the long term Channel Up. Insi
See all ideas
Displays a symbol's value movements over previous years to identify recurring trends.
Frequently asked questions
US 30 (DOW) / US Dollar reached its highest quote on Jul 7, 2026 — 53,653 USD. See more data on the US 30 (DOW) / US Dollar chart.
The lowest ever quote of US 30 (DOW) / US Dollar is 18,048 USD. It was reached on Mar 23, 2020. See more data on the US 30 (DOW) / US Dollar chart.
US 30 (DOW) / US Dollar is just a number that lets you track performance of the instruments comprising the index, so you can't invest in it directly. But you can buy US 30 (DOW) / US Dollar futures or funds or invest in its components.