#EDGE Possible Scenario Overview & Current Market Structure
Current Bias: Bullish (Trendline Bounce Setup)
Current Price: ~0.4009 USDT
The 4-hour chart shows EDGE recovering from its massive early-July spike and entering a steady ascending consolidation phase. Price action is currently respecting a clear upward-sloping support trendline and holding above a key moving average, signaling potential upside continuation toward previous local highs.
1. Trend Identification
Macro Trend: Neutral-to-Bullish. Following a explosive volatility spike in early July to over $0.55, the pair entered a cooling-off period.
Micro Trend (4H): Uptrend / Ascending Consolidation. Price has consistently produced higher lows since mid-July, respecting an ascending trendline that signals persistent buying pressure on dips.
EDGEUSDT Perpetual Contract
No trades
No trades
In-depth trading ideas
EDGEUSDT: Strong Bounce From Lows – Bulls Target HigherEDGEUSDT has produced a strong bullish reversal after defending a key support zone. Buyers stepped in aggressively, shifting short-term momentum back to the upside.
As long as 0.4167 holds, the bullish structure remains intact. A sustained move above the current range could drive the price toward 0.4355, while a break below support would invalidate the setup.
Trade Setup
Entry: 0.4220
Target: 0.4355
Stop Loss: 0.4167
I'm looking for continued buying pressure and strong volume to confirm the breakout.
EDGEUSDT: bullish reclaim toward $0.55The Macro Picture 🗺️
EDGEUSDT's post-capitulation recovery has cleared its first structural hurdle. The squeeze that built across June 16–21 between $0.34 and $0.37 resolved upward as projected, with price spiking to $0.42 around June 22–23 before pulling back into the zone. Critically, the pullback found support at $0.36 — a higher low above the original squeeze floor — and RSI has lifted from the low-20s to ~30 with the moving average crossing under the line for the first time since the June 2 crash. The pattern is no longer just compression: it is an early-stage accumulation base with rising lows, validated rejection wicks, and momentum building back toward the midline. The path back toward the former macro floor at $0.55 is opening one level at a time.
The Setup ⚙️
The Higher Low: The $0.36 defense after the $0.42 rejection confirms structural buyers stepped in above the original squeeze floor — exactly the signature of accumulation rather than failed-breakout exhaustion, and the launchpad for a stronger second attempt.
The Reclaim Stack: The first ceiling to clear sits at $0.40 (broken base floor), followed by the $0.42–$0.45 supply pocket where the May descent originated. Each level flipped to support compounds the structural force behind the move.
The Trigger: A clean daily close above $0.42 confirms the second attempt resolves through the rejection wick and opens the empty corridor toward the $0.45 failed base high — the last major hurdle before the $0.55 reclaim test.
The Roadmap: Primary target sits at $0.55 — the former macro floor that capped the entire post-April structure, now positioned as the high-confluence overhead supply pocket where the recovery thesis confirms a true regime change. The white projection traces a multi-leg climb through $0.40 and $0.45 on the way up. Invalidation: a sustained daily close below $0.34 would invalidate this reclaim thesis and reopen the $0.32 capitulation wick low as the immediate downside destination.
EDGEUSDT: local squeeze with $0.55 destinationThe Macro Picture 🗺️
EDGEUSDT's post-capitulation structure has done something important — it built a base above the wick low rather than into it. Across the past nine sessions, sellers couldn't punch through $0.32 despite three weeks of compounding pressure, and buyers didn't need the deeper sweep to step in. Price has compressed into a tight $0.34–$0.37 range with RSI flatlining at oversold extremes (~22) and the moving average finally catching up to the line — the first sign of momentum stabilization since the June 2 crash. The squeeze is narrowing into the kind of compression that resolves with conviction, and the dead-air pocket between $0.38 and $0.55 contains the trapped supply from the entire June descent.
The Setup ⚙️
The Squeeze: The $0.34–$0.37 compression has held nine consecutive sessions without breaking lower, with each downside attempt absorbing into smaller candles and shrinking range — the structural signature of accumulation disguised as drift.
The Trigger: A clean daily close above $0.38 confirms the squeeze resolves bullish and opens the empty corridor toward the $0.40 broken base floor, where the first major reclaim test sits.
The Reclaim: Once $0.40 flips to support, the $0.45 failed-base-high becomes the next hurdle, and reclaiming that band stacks the structural force needed to challenge the $0.55 former macro floor from below.
The Roadmap: Primary target sits at $0.55 — the former macro floor that defined the entire pre-crash structure, now positioned as the high-confluence overhead supply pocket where the recovery thesis either confirms a regime change or stalls into the next decision. The white projection traces a curved multi-leg recovery through $0.40 and $0.45 on the way up. Invalidation: a sustained daily close below $0.32 would invalidate this recovery thesis and reopen the $0.25 macro extension as the immediate downside destination.
EDGEUSDT: liquidity sweep before bullish reactionThe Macro Picture 🗺️
EDGEUSDT has spent the past two weeks tracing the textbook post-capitulation path — vertical crash on June 2–3, failed base attempt at $0.40–$0.50, methodical bleed into $0.35 as sellers compounded pressure on every retest. The structure has now arrived at the high-confluence decision pocket: the $0.32 capitulation wick sits directly below current price, and RSI has been pinned at oversold extremes (~22) for over a week without a single divergent push. This is where post-capitulation cycles either extend into deeper liquidity or reverse, and the conditions for reversal are now stacked. Each leg lower has been smaller than the last, the moving average has rolled over into price, and the dead-air pocket between $0.32 and $0.40 holds the trapped supply that fuels relief rallies.
The Setup ⚙️
The Sweep: A final flush into the $0.28–$0.32 pocket would clear the remaining stops parked beneath the capitulation wick and reset positioning to maximum-oversold — the structural signature of a tradable bottom rather than a continuation low.
The Reaction: Once the sweep absorbs the last of the desperate selling, structural buyers regain leverage and the path of least resistance flips back into the broken band, where every retest of lower levels through June has trapped late shorts.
The Trigger: A clean daily close above $0.38 confirms the reversal and opens the dead-air pocket toward $0.40, where the broken base floor is now defended as overhead resistance from below — the first major reclaim target for the bullish reset.
The Roadmap: Primary target sits at $0.40 — once the sweep resolves higher, the white projection traces a choppy multi-leg recovery through the empty zone between $0.32 and $0.40, where no defended supply exists to slow the bounce. Invalidation: a sustained daily close below $0.28 would invalidate this reaction thesis and reopen the deeper $0.20 extension as the next downside destination.
EDGEUSDT: bearish continuation toward $0.32The Macro Picture 🗺️
EDGEUSDT's post-capitulation base has failed at its own invalidation level. The $0.40–$0.50 consolidation that built across June 4–7 looked structurally clean — RSI was at oversold extremes, the $0.32 wick had cleared liquidity, and the conditions for a textbook mean-reversion bounce were all in place. Instead, no buyer stepped in. Price broke the lower boundary cleanly on June 9, sustained a daily close below $0.40, and has bled methodically into $0.38 across the past three sessions without printing a single relief candle. RSI remains pinned in the low-20s with no divergence forming, and the moving average has crossed below price to confirm momentum is still compounding to the downside. The structural read flips back to continuation — the base wasn't accumulation, it was distribution disguised as a pause.
The Setup ⚙️
The Failed Base: The June 4–7 consolidation between $0.40 and $0.50 broke down without defending its lower edge, exposing the absence of structural buyers and confirming the prior leg was incomplete. The $0.40–$0.45 band now sits as overhead resistance from below.
The Ceiling: The $0.55 former macro floor remains structurally untested from below — relief flow died well beneath it, leaving the broken level as a distant supply pocket no longer in immediate play.
The Grind: The white projection traces a saw-tooth path rather than a clean impulse — methodical lower-highs and lower-lows compounding into the wick zone, the signature of distribution where each retest of a lower level draws in failed dip-buyers before sellers extend the move.
The Roadmap: Primary target sits at $0.32 — the capitulation wick low where the next high-confluence liquidity reaction is parked. A failure to hold $0.32 opens the deeper $0.25 macro extension as the secondary destination. Invalidation: a clean daily close back above $0.45 would invalidate this bearish continuation thesis and reopen the relief-bounce path toward the former macro floor.
EDGEUSDT: bullish reaction toward $0.55The Macro Picture 🗺️
EDGEUSDT has just completed one of the most violent structural events in its history — the June 2–3 candle ripped through every level on the chart, slicing from $1.20 through the $0.85–$0.95 shelf and continuing down through the $0.55 macro floor in a single session before wicking to $0.32. The entire April–May impulse leg has been retraced, every late long has been cleared, and the structural map has been reset from scratch. Price has since stabilized in a tight $0.40–$0.50 band across five sessions, with RSI parked at deeply oversold and the moving average rolling over to confirm momentum exhaustion. This is the textbook post-capitulation read where structural buyers reload below the prior macro floor before the first reversion attempt.
The Setup ⚙️
The Sweep: The $0.32 wick is a textbook liquidity sweep below the $0.55 macro floor — every stop parked under the 8-week structural support got cleared in a single candle, resetting positioning and exhausting the supply that drove the move.
The Base: The post-capitulation consolidation between $0.40 and $0.50 has held five consecutive sessions, with selling pressure visibly absorbed at each retest of $0.40. This is the signature of accumulation, not continuation — sellers have lost their leverage at oversold extremes.
The Trigger: A clean daily close above $0.50 confirms the reversion thesis and opens the path back toward the broken floor for a high-confluence retest from below — the same level that bears now defend as overhead resistance.
The Roadmap: Primary target sits at $0.55 — once the base resolves higher, the white projection points directly into the underside of the former macro floor, where the first major supply reaction defines the next decision point. Invalidation: a sustained daily close below $0.40 would invalidate this reversion thesis and reopen the $0.32 capitulation low as the immediate downside target.
EDGEUSDT: bearish flush toward $0.90The Macro Picture 🗺️
EDGEUSDT's post-impulse range is reaching the end of its patience. The structure between $1.20 and $1.40 that held through mid-April has now absorbed two failed upside attempts — the late-May sweep into $1.55 and the brief push toward $1.50 — and each rejection has left the upper boundary structurally weaker. Price has rolled back to the $1.20 lower edge for a third test, and the rising-lows defense that bulls relied on through May has lost its conviction. RSI confirms the shift, breaking below 50 and curling toward the low-40s with no divergence support, while sellers compound pressure on the floor with each retest. This is the signature of a range about to fail rather than a range about to coil back up.
The Setup ⚙️
The Failed Reclaim: The wick to $1.50 across May 29–31 trapped late breakout buyers who chased the squeeze attempt, and the subsequent failure to print a daily close above $1.40 as support has flipped the path of least resistance back to the downside.
The Floor: The $1.20 critical range floor is now under terminal stress on its third test. Bears are defending the rejection from $1.40 with conviction, and over-leveraged longs parked just beneath the floor become the next liquidity target once price gives way.
The Trigger: A sustained daily close below $1.20 confirms the range failure and opens the path toward the deeper $0.85–$0.95 accumulation pocket — the same shelf that anchored the April impulse leg and now sits as the next high-confluence reaction zone.
The Roadmap: Primary target sits at $0.90 — once $1.20 gives way, the white projection points through the dead-air pocket between $1.20 and $0.95 toward the prior breakout shelf where structural buyers reload. Invalidation: a clean daily close back above $1.40 would invalidate this bearish thesis and reactivate the upper-boundary retest toward $1.55.
EDGEUSDT: local squeeze with $1.55 destinationThe Macro Picture 🗺️
EDGEUSDT has spent the past six weeks building a clean stair-step structure off the $0.55 macro floor — higher lows stacking at $0.55, $0.90 and now $1.20, while the $1.50–$1.55 macro ceiling has capped every push. The late-May sweep into $1.55 cleared out the over-leveraged longs that chased the breakout, and the structure rotated back to test the lower boundary. The $1.20 floor held cleanly across May 26–27, confirming the rising-lows structure remains intact and bulls are quietly defending each step up. Price is now compressing into a local squeeze against the upper boundary, and the path of least resistance points back toward the macro ceiling.
The Setup ⚙️
The Squeeze: Price is coiling beneath the $1.40 local high — the same level that has capped three of the last six weeks. Each rejection has been shallower than the last, and the compression range is narrowing. This is the signature of a level about to flip rather than hold.
The Support Flip: The $1.20 boundary, once the lower edge of the range, is now a validated structural support after the late-May defense. A reclaim of $1.40 turns it into a confirmed mid-range pivot and clears the runway for the next leg.
The Trigger: A clean daily close above $1.40 confirms the squeeze resolves bullish and opens the path toward the $1.50–$1.55 supply pocket, where the third macro-ceiling test will decide the structural fate of the entire post-impulse leg.
The Roadmap: Primary target sits at $1.55 — once $1.40 flips to support, the roadmap points directly back into the macro ceiling for a high-confluence third test, as indicated by the white projection. Invalidation: a sustained daily close below $1.20 would invalidate this bullish-leaning thesis and reactivate the deeper $0.90 accumulation pocket as the next downside destination.
EDGEUSDT: liquidity sweep before bearish moveThe Macro Picture 🗺️
EDGEUSDT printed a textbook 3x impulse from the $0.55 macro floor into the $1.55 macro ceiling, and the structure has since cooled into a post-impulse range between $1.20 and $1.40. The late-May wick into $1.55 looks like a clean liquidity sweep — bulls who chased the breakout were trapped and over-leveraged longs got cleared out before price snapped back inside the box. RSI confirms the shift, printing a quiet bearish divergence against the May peak as momentum drains. This is a volatility playground sitting at a high-confluence decision zone, and the next directional impulse will most likely follow whichever boundary breaks first.
The Setup ⚙️
The Ceiling: The $1.50–$1.55 supply pocket has now rejected price twice, and bears are defending it with conviction — each test prints heavier sell pressure than the last, leaving the macro ceiling structurally intact.
The Floor: The $1.20 lower boundary is the real structural pivot. A clean breakdown clears out the late-buyers stacked above it and opens the path of least resistance toward the deeper $0.85–$0.95 accumulation pocket, as indicated by the white projection.
The Range Play: The zone between $1.20 and $1.40 creates a structural playground for grid-based accumulation while the market decides direction — capturing the rotation between boundaries without forcing a single-side thesis.
The Roadmap: Primary target sits at $0.90 — a sustained daily close below $1.20 triggers the flush as the post-impulse range fails and momentum unwinds. Invalidation: a clean daily close above $1.55 would invalidate this bearish-leaning thesis and put continuation toward $1.80+ back into play.
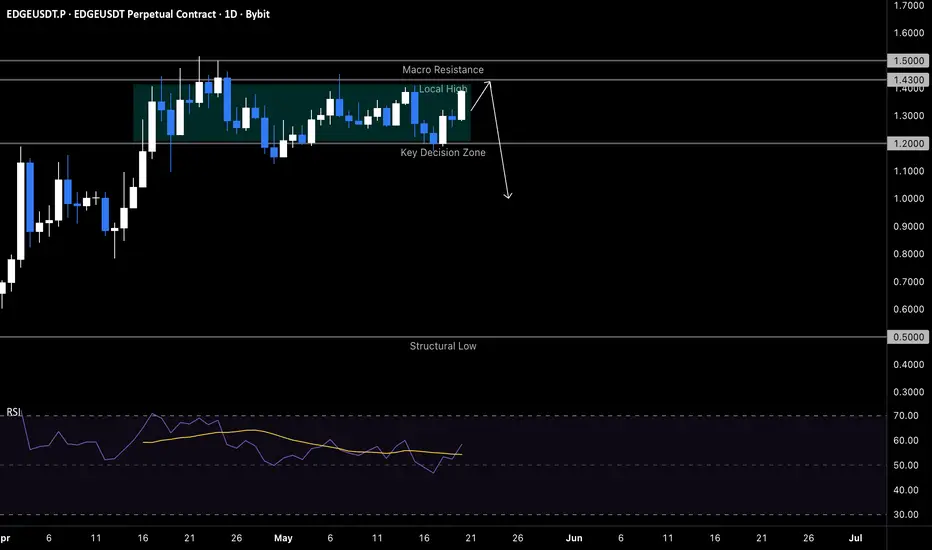
EDGEUSDT: local squeeze with $1.50 destinationThe Macro Picture 🗺️
After an explosive impulse from $0.50 to $1.50 across late March and April, price has built a four-week consolidation between $1.20 and $1.43. This kind of structural reset after a vertical leg is the market's way of digesting gains and rebuilding fuel — a textbook volatility playground where liquidity pools accumulate on both sides of the range. Current price at $1.35 sits in the middle of the box, with RSI flattening near 55 — momentum cooling, neither side committed yet.
The Setup ⚙️
The Ceiling: The $1.40–$1.43 zone has rejected price three times since late April. Bears are defending this band with size, and a clean reclaim would trap shorts and trigger buy stops layered above the $1.50 macro peak.
The Floor: The $1.18–$1.22 zone has been tested and defended three times, building it into a high-confluence support shelf. A sustained break below would clear out over-leveraged longs and open a flush toward the $1.00 prior consolidation flag.
The Range Play: The structural box between $1.20 and $1.43 creates a textbook playground for grid-based accumulation while the squeeze resolves. Repeated touches on both boundaries make this zone mechanically suited to range-bound strategies.
The Roadmap: Primary target sits at $1.50 — a reclaim of $1.43 with follow-through would sweep the macro ceiling and trigger buy stops layered above April's peak. Invalidation: a sustained 1D close below $1.18 would invalidate this bullish thesis and open the path toward the $1.00 macro support pocket.
$EDGE - 4H StructureBYBIT:EDGEUSDT is still hovering around its previous high around 0.85, currently consolidating under a descending resistance trendline after the strong impulsive move earlier this month.
The key level that needs to hold here is 0.80. As long as price maintains this support, the current structure remains constructive, and the consolidation could simply be a pause before the next expansion. However, losing 0.80 would weaken the structure and increase the probability of a deeper pullback toward the 0.75–0.70 demand zone, which aligns with the next major support area on the chart.
On the upside, the key resistance to watch is 0.90. A clean reclaim and hold above this level would signal strength and potentially trigger continuation toward new high.
EDGEUSDT — Compression Beneath HighsEDGE isn’t in clean expansion right now — it’s in decision territory.
After a strong move off the lows, price is now compressing beneath local overhead supply while still holding constructive higher-low structure underneath.
🧭 HTF Context
On the higher timeframe, EDGE has already shown a clear expansion off the daily base.
The bigger picture is no longer about whether participants can lift it off the lows — that already happened. The question now is whether this market can accept near the highs and continue, or whether this becomes distribution before a deeper retrace.
Daily structure still looks constructive overall, but price is now pushing into an area where continuation needs real participation, not just drift.
🔬 LTF Structure
On the lower timeframes, price is tightening into a clear compression.
The 15m is showing a coiled range beneath descending local supply, while the 5m is building a tighter base with higher lows pressing into that resistance line.
That matters because compression near highs is usually one of two things:
Acceptance before expansion
Stalling before rejection
Right now, this still leans constructive as long as price keeps holding the higher-low sequence and doesn’t lose the local base.
🌀 Cycle Position
This looks like a Base & Break continuation attempt inside the broader higher-timeframe expansion.
The impulse already happened.
Now the market is deciding whether it has enough participation for another leg.
So this is not the part of the cycle where I want prediction.
This is the part where I want to see whether compression actually resolves with commitment.
🟢 Continuation Scenario
If EDGE can hold this local base and accept above the compression trendline, the next thing I’d be watching for is expansion through the nearby overhead area.
That would suggest participants are still in control and this consolidation was simply a pause, not distribution.
In that case, I’d expect a move back into the prior highs and potentially a continuation leg if volume and momentum expand with it.
What I want to see:
Higher lows continue to hold
Clean break of compression
Immediate acceptance, not a quick fakeout
Participation expanding on the breakout
🔴 Failure Scenario
If price breaks down from this compression and starts losing the local higher-low structure, then the read changes.
That would suggest this wasn’t healthy acceptance near highs — it was a stall.
And once compression fails near the top of a move, price often rotates back into deeper support to search for new participation.
If that happens, I’d expect a move away from breakout thinking and back toward retrace / rebase thinking.
🎯 Execution Mindset
This is the kind of spot where forcing entries inside the range makes no sense.
The edge is not in guessing — it’s in waiting for the market to show whether this compression resolves with acceptance and expansion or rejection and unwind.
For me, this is a structure-first setup:
Hold the base
Break the compression
Watch the quality of the follow-through
If the breakout can’t hold, I’m not interested in pretending it’s strength.
EDGE is in a clean “coiled” state here. The higher timeframe still supports continuation, but lower timeframe compression has to resolve with real participation before this becomes actionable.
Not a signal. Just how I’m reading structure and participation.
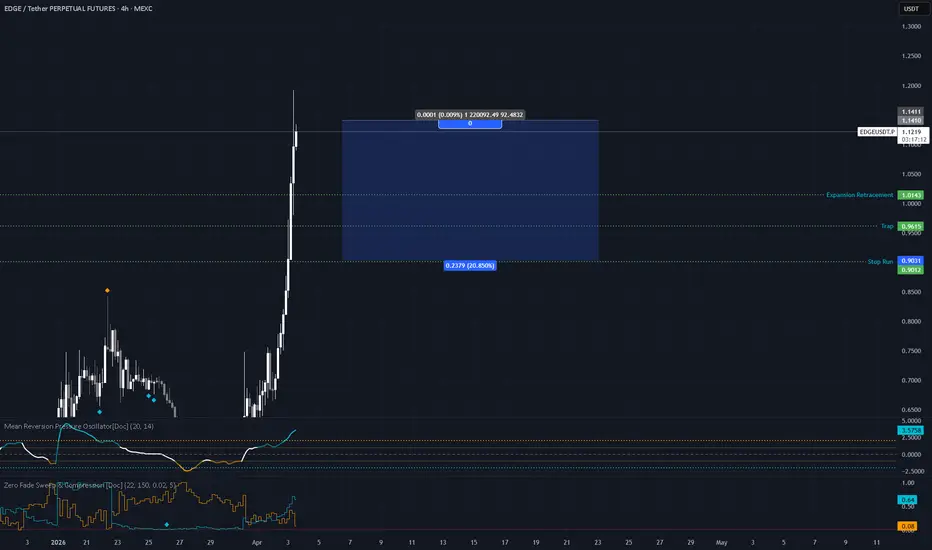
Irregular Volume The irregular volume on this is unsustainable for this asset as well and its likely to drop rapidly with at least a 15% downside to the trap level. The current daily volume is 10x the 30 day average and most of this upside momentum is from a short squeeze as there was no major news. When large holders begin to exit their positions I expect the downside move to be violent. The main indicator I wall pay attention to is the mean reversion oscillator when it dips under 2 and look for a confirmation from compression on the Zero Fade. If there is no confirmation then I won't fade as the short squeeze may still be ongoing.
$EDGE Can It Break Above $1?Recent catalyst for KUCOIN:EDGEUSDT was the token launch on March 31, with a large portion of the supply distributed through a community airdrop. Newly launched tokens tend to be volatile early on as airdrop recipients and early participants may create initial sell pressure.
Another event to watch is a scheduled token unlock around April 2, which will add a significant amount of supply into circulation and could introduce short term volatility if early holders decide to take profits.
TECHNICAL OUTLOOK:
Price recently saw a sharp impulse but is now trading back below a descending trendline, suggesting the short term structure still leans bearish. Key resistance sits around the .70–.75 zone, which previously acted as a strong supply area.
As long as .60 holds as support, price could still attempt a few more tests of that resistance. Consolidation between .60 and .70 would not be surprising.
If .60 fails to hold, the next likely liquidity area sits around .50, aligning with previous reactions on the chart.
Also watching $BTC. If Bitcoin fails to reclaim the 70k level, broader market weakness could increase the probability of EDGE revisiting the .50 area.