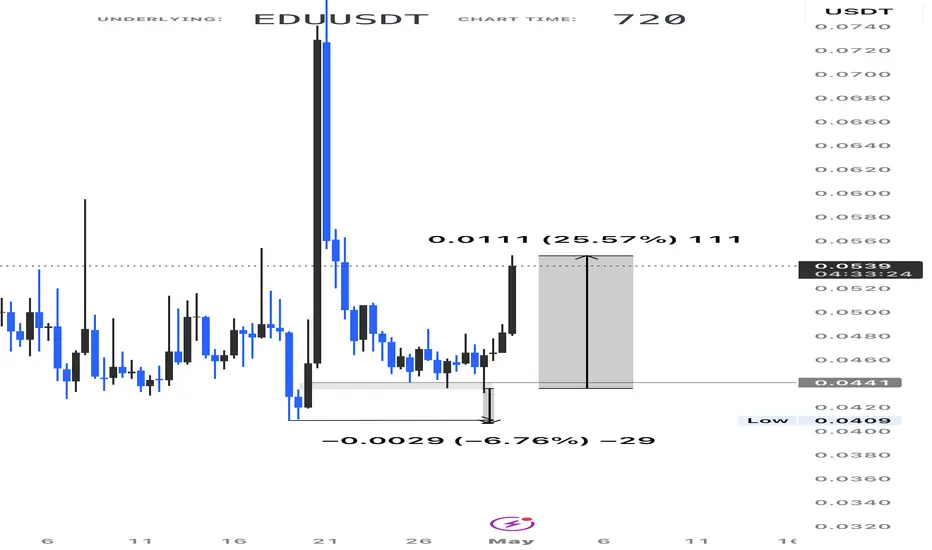
EDUUSDT: Bearish Rejection Signals Potential Continuation LowerEDUUSDT has lost bullish momentum after rejecting a key resistance zone and failing to hold above recent support. Following the sharp rally, price has entered a consolidation phase before rolling over, suggesting buyers are losing control while sellers begin to regain dominance.
The current structu
#EDUUSDT Forming Bullish Momentum#EDU
The price is moving within a descending channel on the 1-hour timeframe and has reached the lower boundary. It is now poised for a bounce and is expected to retest this boundary.
The Relative Strength Index (RSI) indicates a downward trend, which is likely to continue given the overbought con
#EDUUSDT Forming Bullish Momentum#EDU
The price is moving within a descending channel on the 1-hour timeframe and has reached the lower boundary. It is now poised for a bounce and is expected to retest this boundary.
The Relative Strength Index (RSI) indicates a downward trend, which is likely to continue given the overbought con
#EDUUSDT Forming Bullish Momentum#EDU
The price is moving within a descending channel on the 1-hour timeframe and has reached the lower boundary. It is now poised for a bounce and is expected to retest this boundary.
The Relative Strength Index (RSI) indicates a downward trend, which is likely to continue given the overbought con
#EDUUSDT Forming Bullish Momentum#EDU
The price is moving within a descending channel on the 1-hour timeframe and has reached the lower boundary. It is now poised for a bounce and is expected to retest this boundary.
The Relative Strength Index (RSI) indicates a downward trend, which is likely to continue given the overbought con
EDUUSDT - Bear Flag, Potential Continuation of the Downtrend?On the 8-hour timeframe, EDUUSDT remains in a bearish trend following a sharp sell-off (flagpole). The price is currently trading within a Bear Flag, a classic continuation pattern that typically forms after a strong bearish impulse before the downtrend resumes. 📊
📈 The current upward movement insi
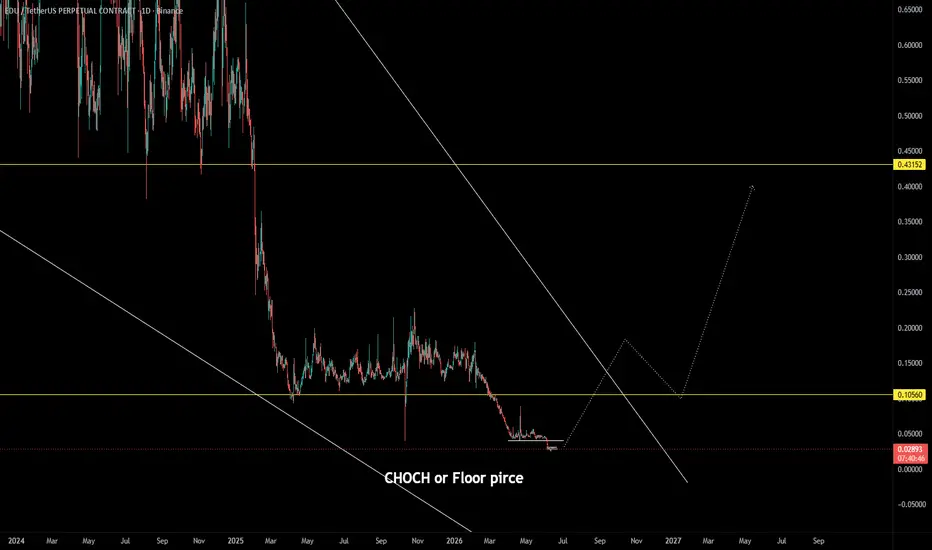
EDU Technical Analysis | Open CampusEDU is sitting at a major decision point after breaking down from its previous range and testing the floor zone. Structure is still weak, but this is the area where a potential CHOCH can begin if buyers step in.
The first key move bulls need is a clean reclaim of the previous support area, which is
#EDUUSDT #EDUUSDT Forming Bullish Momentum#EDU
The price is moving within a descending channel on the 1-hour timeframe and has reached the lower boundary. It is now poised for a bounce and is expected to retest this boundary.
The Relative Strength Index (RSI) indicates a downward trend, which is likely to continue given the overbought con
See all ideas
Summarizing what the indicators are suggesting.
Oscillators
Neutral
SellBuy
Strong sellStrong buy
Strong sellSellNeutralBuyStrong buy
Oscillators
Neutral
SellBuy
Strong sellStrong buy
Strong sellSellNeutralBuyStrong buy
Summary
Neutral
SellBuy
Strong sellStrong buy
Strong sellSellNeutralBuyStrong buy
Summary
Neutral
SellBuy
Strong sellStrong buy
Strong sellSellNeutralBuyStrong buy
Summary
Neutral
SellBuy
Strong sellStrong buy
Strong sellSellNeutralBuyStrong buy
Moving Averages
Neutral
SellBuy
Strong sellStrong buy
Strong sellSellNeutralBuyStrong buy
Moving Averages
Neutral
SellBuy
Strong sellStrong buy
Strong sellSellNeutralBuyStrong buy
Displays a symbol's price movements over previous years to identify recurring trends.