EDUUSDT: Bearish Rejection Signals Potential Continuation LowerEDUUSDT has lost bullish momentum after rejecting a key resistance zone and failing to hold above recent support. Following the sharp rally, price has entered a consolidation phase before rolling over, suggesting buyers are losing control while sellers begin to regain dominance.
The current structure favours the bears, with price continuing to print lower highs beneath resistance. As long as 0.03398 remains intact, the probability favours a move lower toward 0.03201. A decisive breakout above resistance would invalidate the bearish outlook and indicate renewed buying strength.
Trade Setup
Entry: 0.03345
Target: 0.03201
Stop Loss: 0.03398
I'll remain bearish while price trades below 0.03398, targeting a continuation toward 0.03201. A confirmed close above the stop-loss level would invalidate this trade idea.
In-depth trading ideas
#EDUUSDT Forming Bullish Momentum#EDU
The price is moving within a descending channel on the 1-hour timeframe and has reached the lower boundary. It is now poised for a bounce and is expected to retest this boundary.
The Relative Strength Index (RSI) indicates a downward trend, which is likely to continue given the overbought conditions.
There is a key support zone in green at 0.0270. The price has bounced off this zone several times, making it a strong support level.
The price is trending towards the 100-period moving average, which we are approaching. This trend supports an upward move.
Entry Price: 0.0293
Target 1: 0.0300
Target 2: 0.0310
Target 3: 0.0320
Stop Loss: At the resistance zone in green
Remember this simple rule: Money management.
Any questions? Please leave a comment.
Thank you.
#EDUUSDT Forming Bullish Momentum#EDU
The price is moving within a descending channel on the 1-hour timeframe and has reached the lower boundary. It is now poised for a bounce and is expected to retest this boundary.
The Relative Strength Index (RSI) indicates a downward trend, which is likely to continue given the overbought conditions.
There is a key support zone in green at 0.0270. The price has bounced off this zone several times, making it a strong support level.
The price is trending towards the 100-period moving average, which we are approaching. This trend supports an upward move.
Entry Price: 0.0307
Target 1: 0.0314
Target 2: 0.0325
Target 3: 0.0340
Stop Loss: At the resistance zone in green
Remember this simple rule: Money management.
Any questions? Please leave a comment.
Thank you.
#EDUUSDT Forming Bullish Momentum#EDU
The price is moving within a descending channel on the 1-hour timeframe and has reached the lower boundary. It is now poised for a bounce and is expected to retest this boundary.
The Relative Strength Index (RSI) indicates a downward trend, which is likely to continue given the overbought conditions.
There is a key support zone in green at 0.0275. The price has bounced off this zone several times, making it a strong support level.
The price is trending towards the 100-period moving average, which we are approaching. This trend supports an upward move.
Entry Price: 0.0290
Target 1: 0.0300
Target 2: 0.0310
Target 3: 0.0321
Stop Loss: At the resistance zone in green
Remember this simple rule: Money management.
Any questions? Please leave a comment.
Thank you.
#EDUUSDT Forming Bullish Momentum#EDU
The price is moving within a descending channel on the 1-hour timeframe and has reached the lower boundary. It is now poised for a bounce and is expected to retest this boundary.
The Relative Strength Index (RSI) indicates a downward trend, which is likely to continue given the overbought conditions.
There is a key support zone in green at 0.0264. The price has bounced off this zone several times, making it a strong support level.
The price is trending towards the 100-period moving average, which we are approaching. This trend supports an upward move.
Entry Price: 0.0290
Target 1: 0.0304
Target 2: 0.0318
Target 3: 0.0335
Stop Loss: At the resistance zone in green
Remember this simple rule: Money management.
Any questions? Please leave a comment.
Thank you.
EDUUSDT - Bear Flag, Potential Continuation of the Downtrend?On the 8-hour timeframe, EDUUSDT remains in a bearish trend following a sharp sell-off (flagpole). The price is currently trading within a Bear Flag, a classic continuation pattern that typically forms after a strong bearish impulse before the downtrend resumes. 📊
📈 The current upward movement inside the channel appears to be nothing more than a temporary correction, rather than a genuine trend reversal.
⚠️ In addition, the price is now retesting the lower trendline of the Bear Flag, making this area a key decision point for the next major move.
🔻 As long as the price remains below the channel resistance, sellers continue to dominate the market, keeping the probability of further downside relatively high.
---
🐻 Bear Flag Pattern Explanation
A Bear Flag consists of two main components:
🔻 Flagpole
- 📉 A sharp decline that reflects strong bearish momentum and clear seller dominance.
🏳️ Flag
- 📊 A temporary consolidation or pullback forming an upward-sloping channel.
- 📉 Trading volume generally decreases during the flag formation.
- ⚡ A breakdown below the channel often confirms the continuation of the existing bearish trend.
💡 This pattern suggests that buyers are only creating a short-term relief rally, while sellers remain in control of the overall trend.
---
📉🐻 Bearish Scenario
✅ As long as the price remains below the Bear Flag resistance, bearish pressure is likely to persist.
🔻 A confirmed breakdown below the lower support trendline (red line), accompanied by a strong candle close, would strengthen the bearish outlook.
🎯 If the breakdown is confirmed, the next potential downside targets are:
🎯 First support: around 0.0261 USDT
🎯 If that level fails to hold, the next target is around 0.0252 USDT, with the possibility of extending even lower according to the Bear Flag projection.
---
📈🐂 Bullish Scenario
A bullish outlook becomes more likely only if the price can:
✅ Break above the upper resistance of the Bear Flag.
✅ Close with a strong bullish candle.
✅ Be supported by increasing trading volume. 📊
🚀 If these conditions are met, the Bear Flag pattern would become invalid, opening the door for a stronger recovery toward the next resistance levels.
---
⚠️📌 Conclusion
📉 The current market structure continues to favor a bearish bias.
🐻 The ongoing Bear Flag suggests that the recent upward movement is likely just a consolidation phase before the primary downtrend resumes.
🎯 The channel support is the key level to monitor.
🔻 A confirmed breakdown would reinforce the bearish continuation scenario.
🚀 Conversely, a breakout above the channel resistance would invalidate the bearish setup and shift momentum toward the bulls.
«⚠️ Always wait for candle close and volume confirmation before making any trading decisions. Never enter a trade based solely on pattern expectations. Practice proper risk management at all times. 🛡️»
---
#EDUUSDT #EDU #Crypto 🚀 #Cryptocurrency #Trading 📈 #TechnicalAnalysis #TradingView #PriceAction #BearFlag 🐻 #Bearish #Downtrend #Breakdown #Support #Resistance #Altcoins
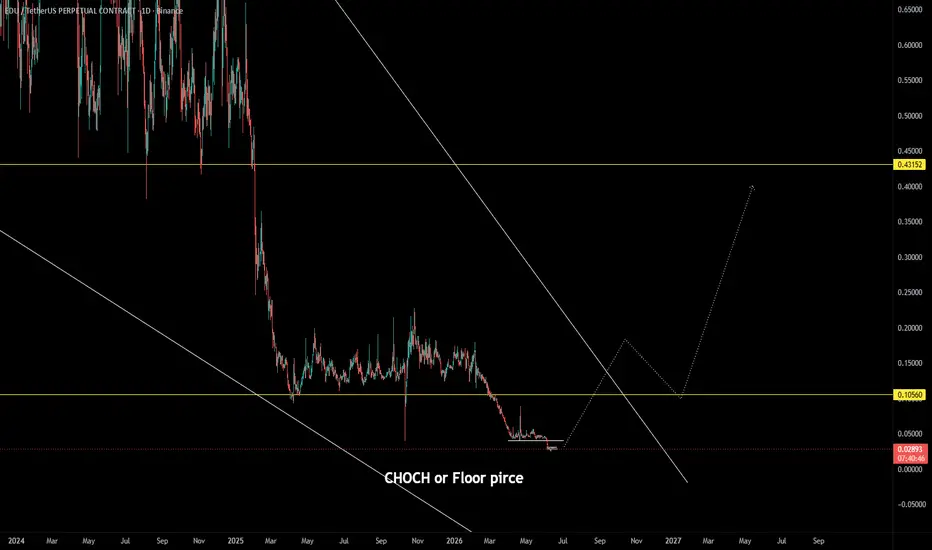
EDU Technical Analysis | Open CampusEDU is sitting at a major decision point after breaking down from its previous range and testing the floor zone. Structure is still weak, but this is the area where a potential CHOCH can begin if buyers step in.
The first key move bulls need is a clean reclaim of the previous support area, which is now acting as resistance. Until that happens, the trend remains bearish and any bounce should be treated as a relief move.
If EDU forms higher lows and breaks above the descending trendline, it could open the door for a larger recovery setup. Without that confirmation, bears remain in control.
For now, EDU is in a high-risk, high-reward zone. Bulls need a confirmed reclaim. Bears want continued rejection below resistance.
#EDUUSDT #EDUUSDT Forming Bullish Momentum#EDU
The price is moving within a descending channel on the 1-hour timeframe and has reached the lower boundary. It is now poised for a bounce and is expected to retest this boundary.
The Relative Strength Index (RSI) indicates a downward trend, which is likely to continue given the overbought conditions.
There is a key support zone (in green) at 0.0428. The price has bounced off this zone several times, making it a strong support level.
The price is trending towards the 100-period moving average, which we are approaching. This trend supports an upward move.
Entry Price: 0.0465
First Target: 0.0476
Second Target: 0.0491
Third Target: 0.0507
You can stop at the first and second targets and close the price, or continue towards the third target. Stop Loss: At the resistance zone (in green).
Remember this simple rule: Money Management.
Any questions? Please leave a comment.
Thank you.
#EDUUSDT Forming Bullish Momentum#EDU
The price is moving within a descending channel on the 1-hour timeframe and has reached the lower boundary. It is now poised for a bounce and is expected to retest this boundary.
The Relative Strength Index (RSI) indicates a downward trend, which is likely to continue given the overbought conditions.
There is a key support zone in green at 0.0390. The price has bounced off this zone several times, making it a strong support level.
The price is trending towards the 100-period moving average, which we are approaching. This trend supports an upward move.
Entry Price: 0.0518
Target 1: 0.0550
Target 2: 0.0588
Target 3: 0.0635
You can stop at the first and second targets and close the price, or continue to the third target. Stop Loss: At the resistance zone in green.
Remember this simple rule: Money Management.
Any questions? Please leave a comment.
Thank you.
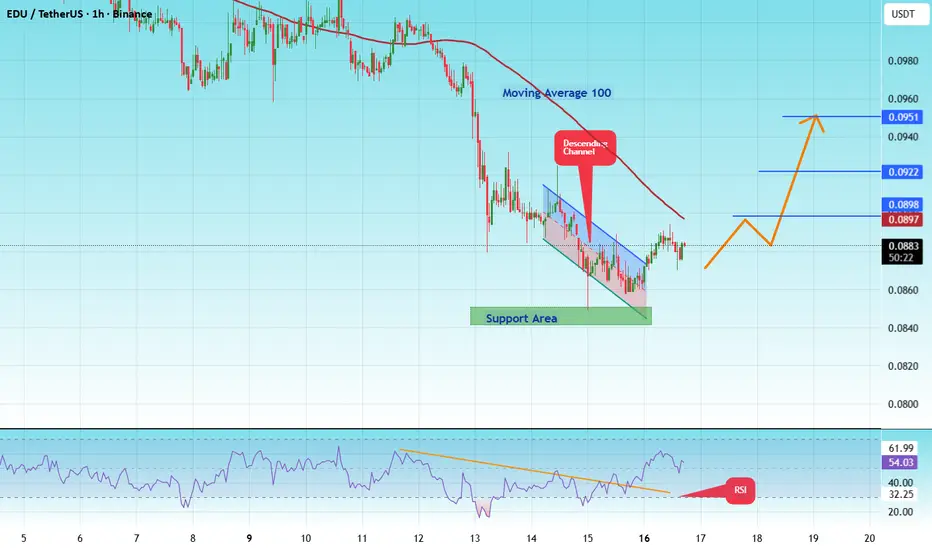
#EDU/USDT Forming Bullish Momentum#EDU
The price is moving within a descending channel on the hourly timeframe. It has reached the lower boundary and is trending towards a bounce. A retest of this boundary is expected.
The Relative Strength Index (RSI) indicates a downward trend, and this trend is likely to continue due to the overbought condition.
A key support zone (in green) was found at 0.0845, and the price has bounced off this zone several times, making it a strong support level.
The price is trending towards the 100-period moving average, which we are approaching. This trend supports an upward move.
Entry Price: 0.0883
Target 1: 0.0898
Target 2: 0.0922
Target 3: 0.0951
Stop Loss: At the resistance zone (in green)
Remember this simple rule: Money management.
Any questions, please leave a comment.
Thank you.
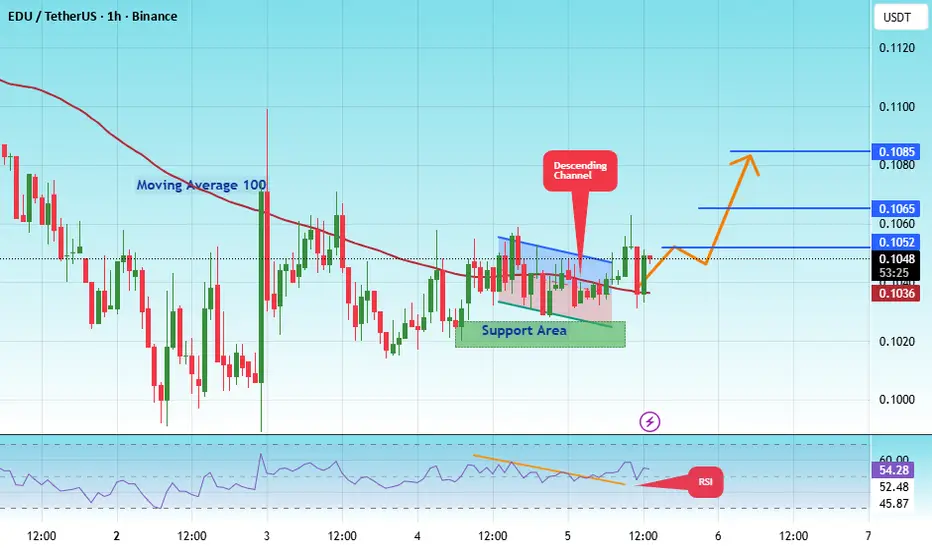
#EDU/USDT Forming Bullish Momentum
#EDU
The price is moving within a descending channel on the hourly timeframe. It has reached the lower boundary and is trending towards a bounce. A retest of this boundary is expected.
The Relative Strength Index (RSI) indicates a downward trend, and this trend is likely to continue due to the overbought condition.
There is a key support zone in green at 0.1020, and the price has bounced off this zone several times, making it a strong support level.
The price is trending towards the 100-period moving average, which we are approaching. This trend supports an upward move.
Entry Price: 0.1040
Target 1: 0.1052
Target 2: 0.1065
Target 3: 0.1085
Stop Loss: At the resistance zone in green
Remember this simple rule: Money management.
Any questions, please leave a comment.
Thank you.
#EDU/USDT Forming Bullish Momentum#EDU
The price is moving within a descending channel on the hourly timeframe. It has reached the lower boundary and is heading towards a breakout, with a retest of the upper boundary expected.
The Relative Strength Index (RSI) is showing a downward trend, approaching the lower boundary, and an upward bounce is anticipated.
There is a key support zone in green at 0.1316, and the price has bounced from this level several times. Another bounce is expected.
The RSI is showing a trend towards consolidation above the 100-period moving average, which we are approaching, supporting the upward move.
Entry Price: 0.1405
Target 1: 0.1450
Target 2: 0.1528
Target 3: 0.1639
Stop Loss: Below the green support zone.
Remember this simple thing: Money management.
For any questions, please leave a comment.
Thank you.
#EDU/USDT Forming Bullish Momentum#EDU
The price is moving within a descending channel on the hourly timeframe. It has reached the lower boundary and is heading towards a breakout, with a retest of the upper boundary expected.
The Relative Strength Index (RSI) is showing a downward trend, approaching the lower boundary, and an upward bounce is anticipated.
There is a key support zone in green at 0.1286, and the price has bounced from this level several times. Another bounce is expected.
The RSI is showing a trend towards consolidation above the 100-period moving average, which we are approaching, supporting the upward move.
Entry Price: 0.1607
Target 1: 0.1391
Target 2: 0.1486
Target 3: 0.1607
Stop Loss: Below the green support zone.
Remember this simple thing: Money management.
For any questions, please leave a comment.
Thank you.
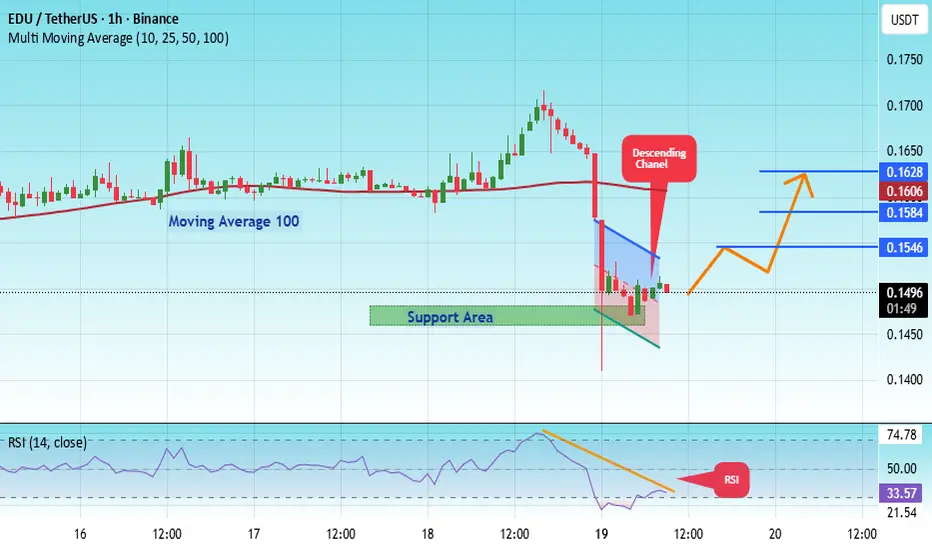
#EDU/USDT Forming Bullish Momentum
#EDU
The price is moving within a descending channel on the hourly timeframe. It has reached the lower boundary and is heading towards a breakout, with a retest of the upper boundary expected.
The Relative Strength Index (RSI) is showing a downward trend, approaching the lower boundary, and an upward bounce is anticipated.
There is a key support zone in green at 0.1465. The price has bounced from this level several times and is expected to bounce again.
The RSI is showing a trend towards consolidation above the 100-period moving average, which we are approaching, supporting the upward move.
Entry Price: 0.1496
Target 1: 0.1546
Target 2: 0.1585
Target 3: 0.1628
Stop Loss: Below the green support zone.
Remember this simple thing: Money management.
For any questions, please leave a comment.
Thank you.
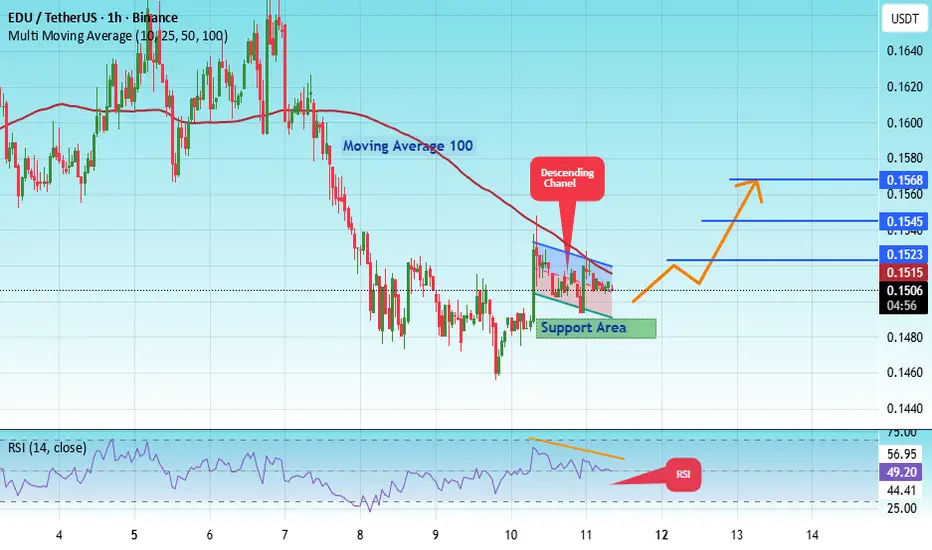
#EDU/USDT Forming Bullish Momentum
#EDU
The price is moving within a descending channel on the hourly timeframe. It has reached the lower boundary and is heading towards a breakout, with a retest of the upper boundary expected.
The Relative Strength Index (RSI) is showing a downward trend, approaching the lower boundary, and an upward bounce is anticipated.
There is a key support zone in green at 0.1486. The price has bounced from this level several times and is expected to bounce again.
The indicator is showing a trend towards consolidation above the 100-period moving average, which we are approaching, supporting the upward move.
Entry Price: 0.1506
First Target: 0.1523
Second Target: 0.1545
Third Target: 0.1568
Stop Loss: Below the green support zone.
Don't forget one simple thing: Money Management.
For inquiries, please leave a comment.
Thank you.
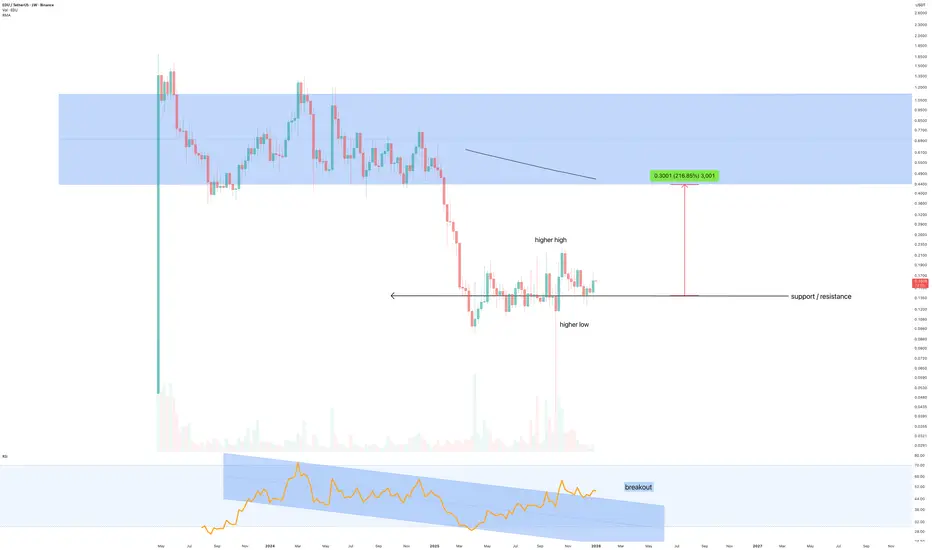
Open Campus (EDU) The bounce nobody expects… Until it’s up 200%
Timeframe : Weekly
EDU has been doing what most crypto tokens do when they’re not pumping, bleeding out slowly, then pretending it meant to. The weekly chart is showing early signs of seller fatigue and a bit of structural improvement, we’ve got a higher low (HL) and a higher high (HH) forming around a clearly defined base. The question now is simple: can this pullback hold and print another HL, or is this just the market taking a breather before continuing its favourite hobby: burning peoples cash.
This is a high-risk, speculative attempt to catch a potential trend shift early.
Key Levels
Support (Higher-Low Zone): ~$0.15 – $0.17. This is the “if buyers are real, they show up here” area.
Invalidation : A sustained break (meaningful weekly close) below the support zone. If it loses that, the “reversal” narrative gets thrown in the bin.
Resistance areas:
T1: ~$0.44 (first major reaction level / gateway into the supply zone).
T2: ~$0.60 (mid-zone resistance where price may stall and people will start tweeting again).
T3 (Stretch): ~$1.05 (top of the prior supply zone, the “bagholder reunion tour” level).
Conclusion
EDU is attempting to base after a nasty decline, with early HL/HH structure and an RSI breakout suggesting momentum may be trying to turn. If the support zone holds and another HL forms, there’s a reasonable case for a relief rally toward T1, and possibly deeper into the overhead supply zone at T2/T3. But don’t romanticise it, the area above is packed with supply and impatient sellers, and failure is still very much on the table. Trade is invalidated if the new support structure breaks.
Ww
===============================================================
Disclaimer
This is not financial advice. It’s a technical-analysis idea, not a guarantee, not a signal service, and definitely not a substitute for your own research. Crypto is volatile, thin liquidity happens, and price can invalidate your “perfect setup” just to be spiteful. Manage position size, use stops appropriate to volatility, and assume you can be wrong, because you can. I may hold a position at any time, and this idea may be invalidated without notice.
#EDU/USDT Forming Bullish Momentum#EDU
The price is moving in a descending channel on the 1-hour timeframe. It has reached the lower boundary and is heading towards breaking above it, with a retest of the upper boundary expected.
We have a downtrend on the RSI indicator, which has reached near the lower boundary, and an upward rebound is expected.
There is a key support zone in green at 0.1418. The price has bounced from this zone multiple times and is expected to bounce again.
We have a trend towards consolidation above the 100-period moving average, as we are moving close to it, which supports the upward movement.
Entry price: 0.1441
First target: 0.1454
Second target: 0.1469
Third target: 0.1491
Don't forget a simple principle: money management.
Place your stop-loss order below the green support zone.
For any questions, please leave a comment.
Thank you.