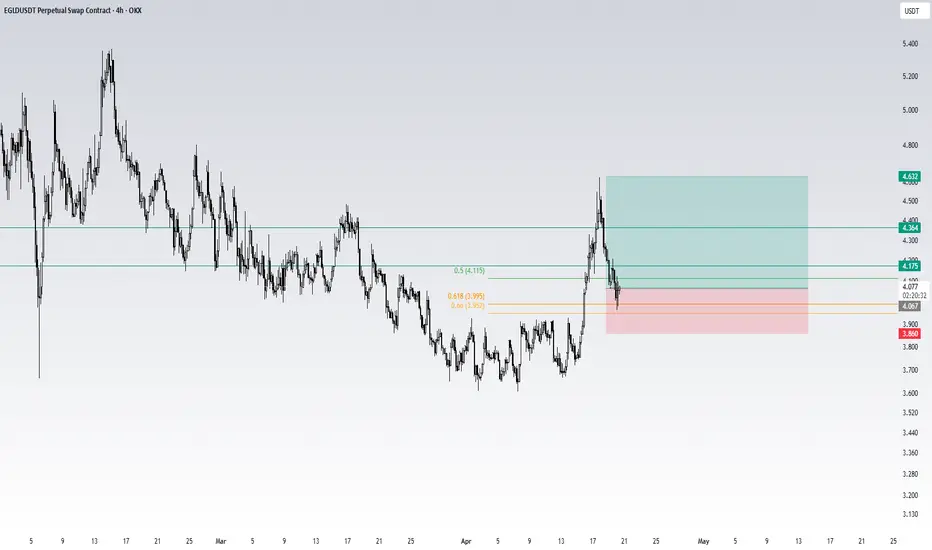
EGLD: local squeeze with $3.89 destinationThe Macro Picture 🗺️
EGLD sold off from the $4.874 May high all the way to $2.409 in June, then reversed sharply. Price has reclaimed back to $3.031 in a clean impulse, printing higher lows the whole way up — momentum has flipped to the buyers.
The Setup ⚙️
The Momentum Base 🟢
$2.678 (Local Low)
EGLDUSDT Forming Bullish MomentumEGLDUSDT is forming a clear bullish momentum pattern, a classic bullish wave signal that often indicates an upcoming breakout. The price has been consolidating within a narrowing range, suggesting that selling pressure is weakening while buyers are beginning to regain control. With consistent volume
EGLD/USDT – Adding to My Long Position I’m confident we have more upside ahead, so I just added more size to my long.
This is a swing trade and I always scale in on winning positions rather than averaging down on losers. So far the setup is playing out perfectly.
After holding above the 0.618 Fib retracement and breaking structure, I b
EGLDUSDT UPDATEEGLD Technical Setup Pattern: Falling Wedge Breakout Current Price: $4.12 Target Price: $5.75 Target % Gain: 41.94% EGLD is breaking out of a falling wedge pattern on the 1D chart with price reclaiming resistance and showing early bullish strength, structure indicates a potential trend reversal afte
EGLD / USDT Holding Structure — Key Support Retest in FocusEGLD / USDT is maintaining a strong structure, but we are expecting a move toward the $3.76 support level for a potential retest. If price shows a solid bounce from this zone, it could continue its bullish rally toward the $4 target. Watch this level closely, wait for confirmation of the reaction, a
#EGLD#EGLD has broken out of a falling wedge pattern 🚀 and is currently consolidating near the 4.011 level. This breakout is supported by increasing volume 📈, suggesting strong bullish momentum. The next target for #EGLD is around the 4.500 level 🎯.
Breakouts from falling wedges can be powerful, but alw
EGLD/USDT Make-or-Break — Descending Triangle About to Explode!On the EGLD/USDT (1D timeframe) chart, we can clearly see a strong downtrend structure dominating for the past few months. Price continues to form lower highs and lower lows, indicating persistent selling pressure.
Currently, price is testing a key area: a strong demand zone (3.95 – 3.65) highlight
See all ideas
Summarizing what the indicators are suggesting.
Oscillators
Neutral
SellBuy
Strong sellStrong buy
Strong sellSellNeutralBuyStrong buy
Oscillators
Neutral
SellBuy
Strong sellStrong buy
Strong sellSellNeutralBuyStrong buy
Summary
Neutral
SellBuy
Strong sellStrong buy
Strong sellSellNeutralBuyStrong buy
Summary
Neutral
SellBuy
Strong sellStrong buy
Strong sellSellNeutralBuyStrong buy
Summary
Neutral
SellBuy
Strong sellStrong buy
Strong sellSellNeutralBuyStrong buy
Moving Averages
Neutral
SellBuy
Strong sellStrong buy
Strong sellSellNeutralBuyStrong buy
Moving Averages
Neutral
SellBuy
Strong sellStrong buy
Strong sellSellNeutralBuyStrong buy
Displays a symbol's price movements over previous years to identify recurring trends.