Market Sentiment & Deep Dive: "Extreme Greed"🚨 Market Sentiment & Deep Dive: "Extreme Greed"
🎭 Sentiment Check:
The broader market is currently in an "Extreme Greed" phase. 🎢
Investors are actively overlooking weak earnings and thin cash flows in favor of speculative asset-revaluation stories, particularly for companies with diverse investment portfolios.
💰 Cash Flow vs. Paper Profits:
This asset-management profile operates purely as a "Speculative Momentum Play."
A look under the hood reveals key fundamental risks:
Illiquid Gains: Cash inflows from actual exits are rare.
Core operational cash flow remains incredibly thin compared to total reported revenue. 📉💸
Paper Earnings: Most "Income" on the financial statement is derived from the revaluation of subsidiaries rather than actual cash dividends received. 📝🖼️
High Volatility: Earnings are hyper-sensitive to stock market fluctuations and non-core gains. This was highly evident when TTM profits plunged ~89% in late 2025. 📉💥
🏛️ Balance Sheet Stress:
The balance sheet is heavily weighed down by ~EGP 1.7 Billion in liabilities, which is a massive red flag when stacked against its thin operating cash generation.
While accruals appear manageable, it is simply because the business model relies on asset marking rather than traditional trade credit. 🏗️⚠️
📝 The Strategic Verdict:
This is a classic "musical chairs" stock. 🎶🪑
It performs exceptionally well while market momentum is strong, but the low quality of underlying earnings means that when the technical trend breaks, it will break sharply. Trade with tight stops and protect your capital! 🛡️🛑
If you like my insights, follow and boost! 🙌💙🚀
🎁 $15 TradingView Discount:
🔗 www.tradingview.com ✨💸🤑
Alahly For Development & Investment
No trades
No trades
In-depth trading ideas
AFDI- LOW RISK / good opportunity / great fundamentalAFDI- Timeframe 1 day
Format a Gartley bullish pattern as follows:
- Entry: 30.85(current price: 30.80)
- Stop loss: 29.80(potential loss: 3.50%)
- First target: 33.38(potential profit: 8%)
- Second target: 35.50(potential profit: 15%)
This is not investment advice, only my analysis based on chart data.
Consult your account manager before investing.
Thanks and good luck.
AFDI : Symmetrical triangle + Cup & Handle(AFDI)
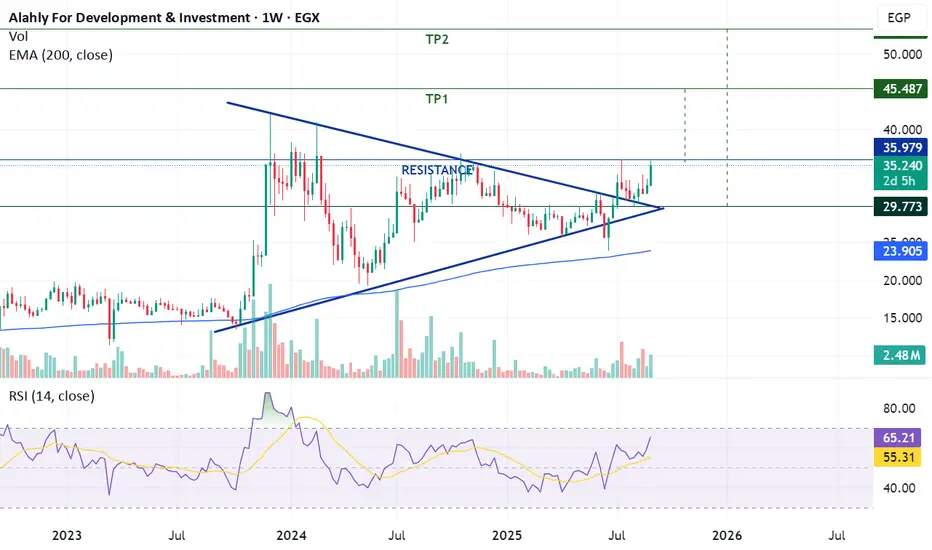
The stock previously formed a symmetrical triangle, which was successfully broken on July 9. On the weekly chart, a clear Cup & Handle pattern has also developed.
If the price breaks above 35.8 and sustains, this would validate the pattern and open the way for the following medium- to long-term targets: 45 – 53.
⚠ The stop-loss level after a confirmed breakout is set at 35.5.
Trade Setup:
-Stock Code: AFDI
-Potential Buy Range: 35.8 – 36.8
-Target Price 1 (TP1): 45
-Target Price 2 (TP2): 53
-Stop-Loss (SL): 35.5 after breakout
#AFDI Egyptian stock#AFDI time frame 1 DAY
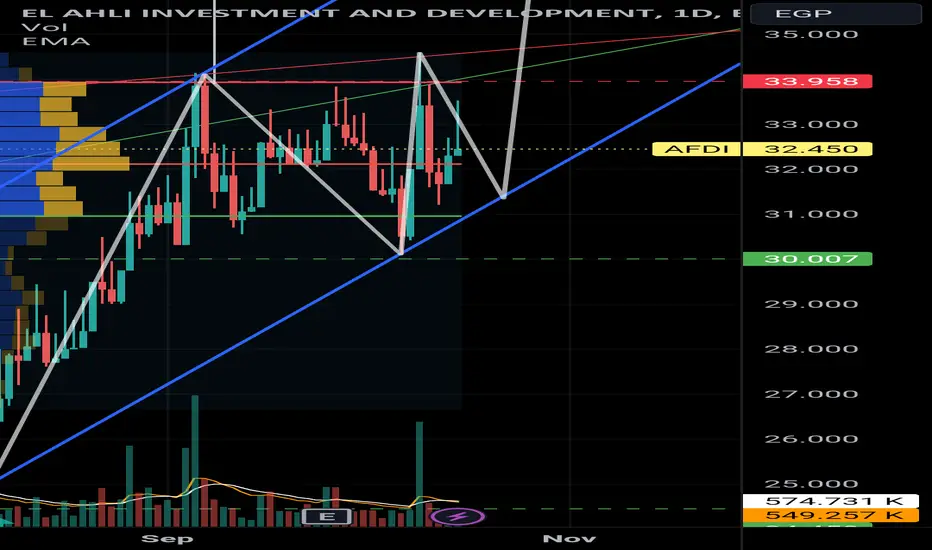
created a bullish Gartley pattern
entry level at 30.60
stop loss 30.00
first target at 32.65
second target 34.20
NOTE: if prices closed under 30.00 (1 DAY frame) may go down to 27.00
MACD indicator show bottom less than last bottom unlike the data on chart , may that is support our idea.
NOTE : this data according to time frame 1 hour
Its not an advice for investing only my vision according to the data on chart
Please consult your account manager before investing
Thanks and good luck
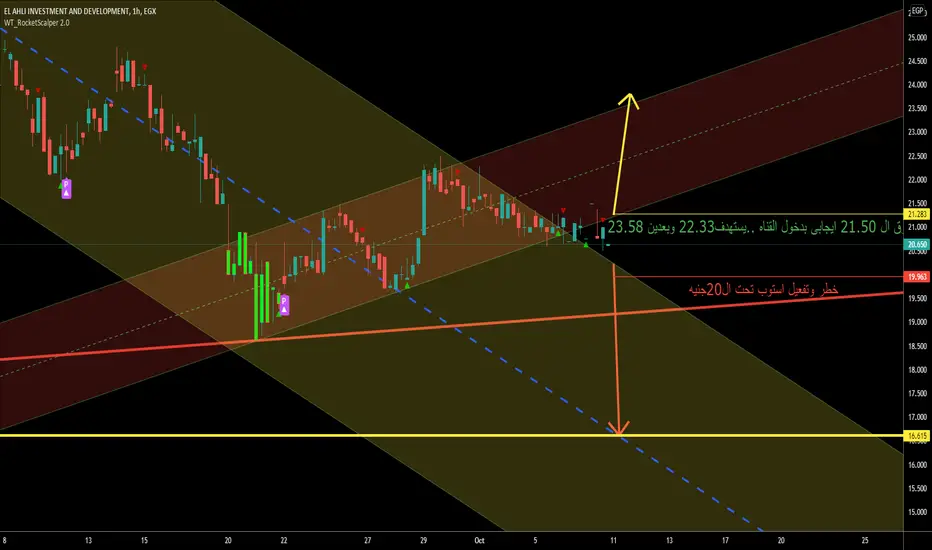
AFDI Downtrend Channel.Levels on the Chart.
Price trying to break above the downtrend Channel.
Worry again if it was a false break, then Going back down towards the Channel.
Will Target 1st the Middle Trendline of the Channel around 16.~
if it was just a retest and then went back up to the mini uptrend channel will have Targets up on chart.
Good Luck!