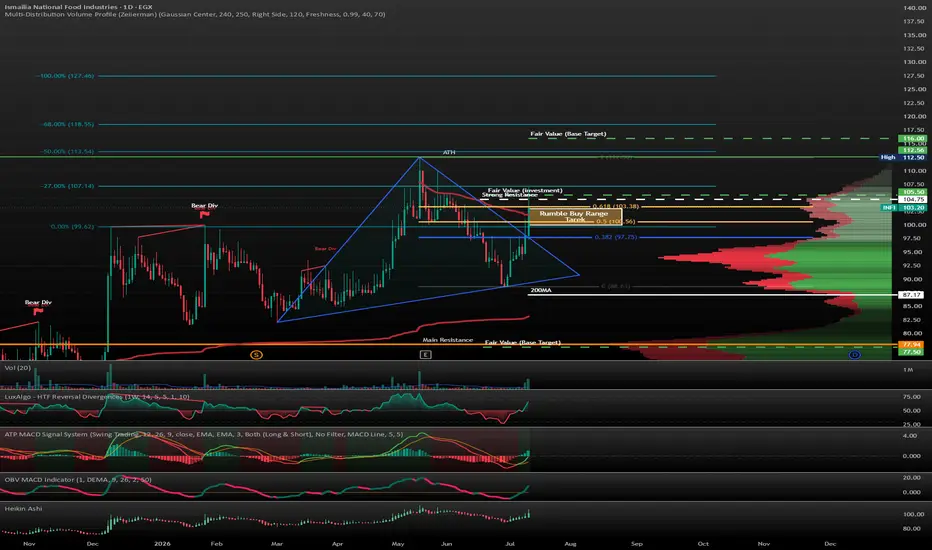
INFI: Triangle Breakout Confirmed, But Fundamentals Remain a Con📈 INFI: Triangle Breakout Confirmed, But Fundamentals Remain a Concern ⚠️
The Fundamentals 🌽
INFI benefits from strong institutional ownership, a healthy balance sheet, and a well-established position in Egypt's food processing sector. 📈
However, the sharp decline in recent earnings continues to we
Ismailia National Food Industries
No trades
No trades
71.76 M EGP
418.75 M EGP
Details
Sector
Industry
CEO
Mahmoud Ali Abdul Hamid
Website
Headquarters
Cairo
Founded
1983
IPO date
Sep 6, 2010
ISIN
EGS01041C010
FIGI
BBG0015TBZK6
Identifiers
ISIN EGS01041C010
Ismailia National Food Industries produces frozen fruits and vegetables. Its activities include the production, marketing, and sale of frozen vegetables, juice, juice concentrate, tomato paste, and tomato concentrate. The firm also engages in land reclamation for the Ismailia region. The company was founded on November 27, 1983 and is headquartered in Cairo, Egypt.
INFI: Key Trend Line Test, High Quality Risk Setup 📊 INFI: Key Trend Line Test, High Quality Risk Setup 🎯
🔍 The Pulse:
INFI is testing a very important long term trend line that has been in place for almost one year and has been touched several times without a break. 🔎
This makes the current area a potentially high quality entry point with a clear
INFI – ATH Breakout vs. Momentum ExhaustionINFI – ATH Breakout vs. Momentum Exhaustion 📉🍎
The Reality: While INFI remains a powerhouse in jams and juices, the quality of earnings is flashing yellow. ⚠️
I find it concerning that the cash conversion ratio is below 1.0, meaning operating profits aren't fully hitting the bank likely due to inve
INFI: Breaking the 91.00 BarINFIL Breaking the 91.00 Barrier! 🚨
The stock is maintaining its long-term uptrend, but the price action has been "boxed in" since December. 📊
First Gate: Resistance at 91.00. Breaking this is the first signal of returning momentum. 🧱
The Breakout: A daily close above 96.30 officially exits the s
INFI – Key Breakout Opening the Door to Higher Price Levels 📌 INFI Stock – Daily Technical View
The stock is currently trading around 109.94, showing a breakout attempt from a tight consolidation zone, and is moving above a strong ascending trendline.
🔵 Demand Zones (Buying Areas)
• 94.03 – 88.83 → First strong buying zone aligned with trendline support.
See all ideas
Summarizing what the indicators are suggesting.
Oscillators
Neutral
SellBuy
Strong sellStrong buy
Strong sellSellNeutralBuyStrong buy
Oscillators
Neutral
SellBuy
Strong sellStrong buy
Strong sellSellNeutralBuyStrong buy
Summary
Neutral
SellBuy
Strong sellStrong buy
Strong sellSellNeutralBuyStrong buy
Summary
Neutral
SellBuy
Strong sellStrong buy
Strong sellSellNeutralBuyStrong buy
Summary
Neutral
SellBuy
Strong sellStrong buy
Strong sellSellNeutralBuyStrong buy
Moving Averages
Neutral
SellBuy
Strong sellStrong buy
Strong sellSellNeutralBuyStrong buy
Moving Averages
Neutral
SellBuy
Strong sellStrong buy
Strong sellSellNeutralBuyStrong buy
Displays a symbol's price movements over previous years to identify recurring trends.
Frequently asked questions
The current price of INFI is 105.11 EGP — it has increased by 1.87% in the past 24 hours. Watch Ismailia National Food Industries stock price performance more closely on the chart.
Depending on the exchange, the stock ticker may vary. For instance, on EGX exchange Ismailia National Food Industries stocks are traded under the ticker INFI.
INFI stock has risen by 2.32% compared to the previous week, the month change is a 9.57% rise, over the last year Ismailia National Food Industries has showed a 69.22% increase.
INFI reached its all-time high on May 13, 2026 with the price of 112.50 EGP, and its all-time low was 1.89 EGP and was reached on Nov 7, 2016. View more price dynamics on INFI chart.
See other stocks reaching their highest and lowest prices.
INFI stock is 2.70% volatile and has beta coefficient of 0.49. Track Ismailia National Food Industries stock price on the chart and check out the list of the most volatile stocks — is Ismailia National Food Industries there?
Today Ismailia National Food Industries has the market capitalization of 2.16 B, it has decreased by −2.04% over the last week.
Yes, you can track Ismailia National Food Industries financials in yearly and quarterly reports right on TradingView.
INFI net income for the last quarter is 18.25 M EGP, while the quarter before that showed 15.56 M EGP of net income which accounts for 0.00% change. Track more Ismailia National Food Industries financial stats to get the full picture.
Ismailia National Food Industries dividend yield was 0.00% in 2025, and payout ratio reached 0.00%. The year before the numbers were 0.49% and 3.81% correspondingly. See high-dividend stocks and find more opportunities for your portfolio.
Like other stocks, INFI shares are traded on stock exchanges, e.g. Nasdaq, Nyse, Euronext, and the easiest way to buy them is through an online stock broker. To do this, you need to open an account and follow a broker's procedures, then start trading. You can trade Ismailia National Food Industries stock right from TradingView charts — choose your broker and connect to your account.
Investing in stocks requires a comprehensive research: you should carefully study all the available data, e.g. company's financials, related news, and its technical analysis. So Ismailia National Food Industries technincal analysis shows the buy rating today, and its 1 week rating is strong buy. Since market conditions are prone to changes, it's worth looking a bit further into the future — according to the 1 month rating Ismailia National Food Industries stock shows the strong buy signal. See more of Ismailia National Food Industries technicals for a more comprehensive analysis.
If you're still not sure, try looking for inspiration in our curated watchlists.