$EIGEN DAILY TF UPDATECRYPTOCAP:EIGEN is forming an almost-completed Bullish Bat Pattern on the Daily TF. 🦇📈
D point is sitting around key PRZ (Daily Bullish OB) which could trigger a bullish reaction from CMP. 👀
Do you think it pumps from here?
Like & Retweet this post ❤️🔁
Follow @HamzaTheInsider for more updates li
EIGEN: local squeeze with $0.2674 destinationThe Macro Picture 🗺️
EIGEN unwound from the $0.3154 macro ceiling into a summer range and now sits at $0.1979, holding above the $0.1766 local low. Price is rotating in the middle of the range with the floor intact — a base rebuilding, not a breakdown.
The Setup ⚙️
The Range Floor 🟢
$0.1766 (Local
EIGEN USDT LONG SIGNAL#109 EIGEN/USDT – Trade Setup (LONG)
📈 Position Type: LONG
🕒 Timeframe: 1H
📊 Market: Futures
💰 Entry Zone:
0.2379
0.2280
🛑 Stop-Loss:
0.22
🎯 Take-Profit Targets:
• TP1: 0.2485
• TP2: 0.2640
• TP3: 0.2830
• TP4: 0.3015
⚙️ Leverage:
5 *3
▫️ After TP1, move SL to Entry + 0.2%.
▪️ Exit
EIGEN Looks Super Bullish (8HIt looks like EIGEN is forming a bullish expanding pattern, with only Wave E remaining to complete the structure.
Wave E is expected to be bullish and could push the price toward the higher targets. The targets are marked on the chart.
As long as the green support zone holds, the price can continu
EIGENUSDT: Relief Rally Losing Steam? Bears Watching This ZoneEIGENUSDT has recovered from recent lows but is now approaching a resistance area where bullish momentum appears to be fading. Unless buyers break above 0.23507, the current rally may turn into another lower high.
A rejection from this zone could send the price back toward 0.22528, while a close ab
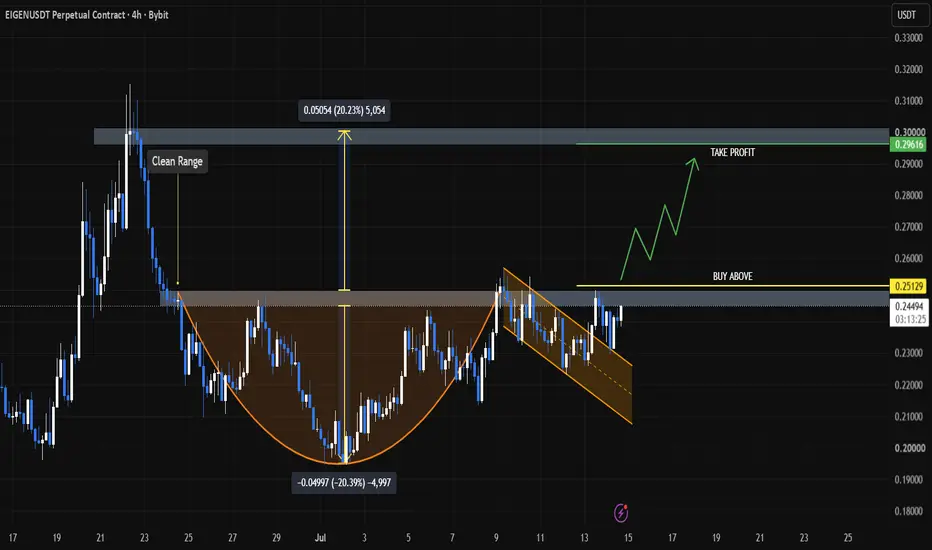
EIGENUSDT: Cup & Handle Breakout + Sector Strength | 20% Spot UpTechnically, price has formed an inward cup-and-handle pattern and has already broken above the handle's descending channel. A breakout above 0.2513 would confirm the structure, while the clean range above provides additional confluence for continuation. The setup presents an attractive 20% upside f
EIGEN / EIGENUSDT Bullish Setup | Futures Trade IdeaMARKET ANALYSIS
EIGEN is currently reacting from a key technical area highlighted on the chart.
As long as the protected support zone remains intact, the bullish market structure remains valid and higher liquidity targets may continue to attract price action.
A breakdown below the invalidation
EIGENUSDT 1D#EIGEN has bounced from the support zone and is now facing a key resistance cluster formed by the descending resistance and the EMA100 on the daily chart.
In case of a confirmed breakout above these levels, the following upside targets could come into play:
🎯 $0.2637
🎯 $0.2985
🎯 $0.3333
🎯 $0.3829
Eigen on verge of massive breakout EIGEN has been stuck in a strong downtrend for a long time, but recently the price managed to break out of the descending trendline, signaling a potential shift in market structure. At the moment, the chart is forming an inverse Head & Shoulders pattern, with price currently testing the neckline res
See all ideas
Summarizing what the indicators are suggesting.
Oscillators
Neutral
SellBuy
Strong sellStrong buy
Strong sellSellNeutralBuyStrong buy
Oscillators
Neutral
SellBuy
Strong sellStrong buy
Strong sellSellNeutralBuyStrong buy
Summary
Neutral
SellBuy
Strong sellStrong buy
Strong sellSellNeutralBuyStrong buy
Summary
Neutral
SellBuy
Strong sellStrong buy
Strong sellSellNeutralBuyStrong buy
Summary
Neutral
SellBuy
Strong sellStrong buy
Strong sellSellNeutralBuyStrong buy
Moving Averages
Neutral
SellBuy
Strong sellStrong buy
Strong sellSellNeutralBuyStrong buy
Moving Averages
Neutral
SellBuy
Strong sellStrong buy
Strong sellSellNeutralBuyStrong buy
Displays a symbol's price movements over previous years to identify recurring trends.