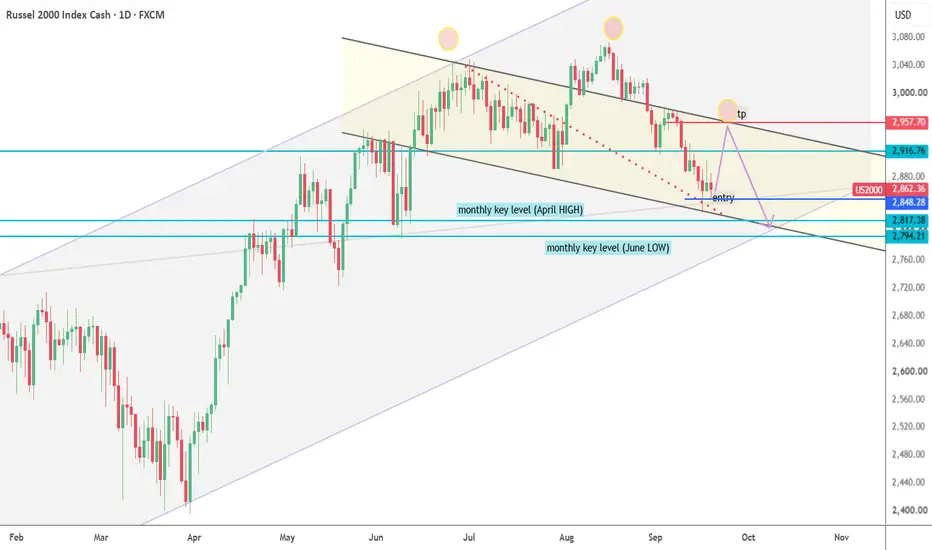
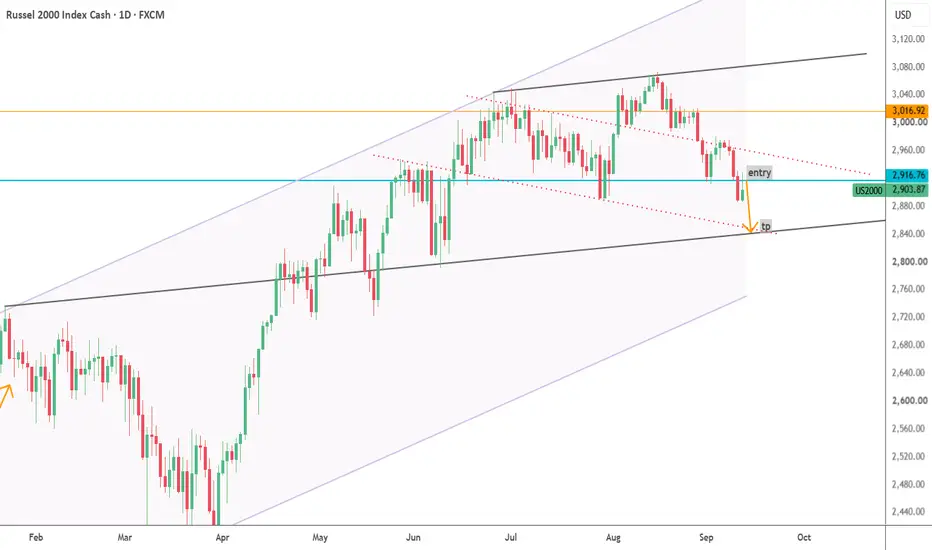
RUSSELL: targeting its 1D MA200 in the next days.Russell 2000 turned bearish on its 1D technical outlook (RSI = 39.006, MACD = -28.020, ADX = 51.578) as it is extending a bearish wave since August 14th. The long term Channel Up is correcting and the last bearish wave hit the 1D MA200. Target that for a new LL (TP =2,780).
See how our prior idea h
US2000--LONG--CorrectionUS2000 — Weekly Macro Channel & Head & Shoulders Retest
Higher-Timeframe Channel: US2000 has been respecting a gray ascending channel on the weekly chart (anchored from the 2025 low to the 2026 low, with the parallel upper boundary aligned with the 3rd week of 2026).
Market Structure: Price is cur
US Small Cap 2000 Index — Bullish Setup Toward 3412US Small Cap 2000 Index — Bullish Setup Toward 3412 📈🇺🇸
The US Small Cap 2000 Index is presenting a constructive bullish structure, with price action showing improving upside potential and renewed strength across the broader small-cap segment.
The current technical formation suggests that buyers a
Huge Butterfly At Resistance.If you draw a fib on the 2020 pullback the 2021 high in the RUT was around the 1.61. Small head fake after trading at it for almost a year.
Recently the 2.61 of this swing hit, and it has complete inside of a huge butterfly pattern.
If that pattern is successful, this ends really badly.
Super
Russell: Volume, Sellers, and the Area of Interest.Hello everyone :)
Something on the Russell chart caught my attention.
Whenever I get that feeling—that little spark in my eye—I feel like I have to understand what exactly caught my attention. It doesn't happen often, but when it does, I believe there's usually a reason for it.
I can see that buye
Russell 2000 LONG — 12H ALMA Setup (WR 86% · avg RR 1.3)IG:RUSSELL · 12H · long only.
(Context: Russell 2000 — US small-cap beta via rates, breadth, and risk appetite — not a discretionary “buy the IWM dip” call.)
═
█ RESEARCH HUB
Category: Indices sentiment 32.4 (Fear) — built from 74 locked notes (11 constructive / 48 risk-off / 15 mixed); ti
Small Caps Could Be SputteringThe Russell 2000 has outperformed most of this year, but some traders may see downside risk.
The first pattern on today’s chart is the mid-August high of 3070. It was less than 2 percent above the previous high on July 1. The small-cap index failed to hold that level and ended last week under 3,000
Will Friday's Sellers Strike Again on Monday?During Friday's trading session, sellers entered the market with relatively strong intraday momentum around the 3,015 price area.
Currently, the price has broken below the 2,975 demand zone, and the short-term intraday momentum is clearly bearish. However, from a broader perspective and on the high
US2000--SHORTBearish Reversal / Momentum Loss
Higher Timeframe Context: Price remains inside a massive ascending channel, but price action indicates that bullish momentum is losing steam.
Weekly Momentum: Last two weeks closed bearish.
Expectation: Expecting continued bearish momentum for the coming week.
See all ideas
Displays a symbol's value movements over previous years to identify recurring trends.
Frequently asked questions
Russel 2000 Cash reached its highest quote on Aug 17, 2026 — 3,072.67 USD. See more data on the Russel 2000 Cash chart.
The lowest ever quote of Russel 2000 Cash is 1,629.86 USD. It was reached on Oct 27, 2023. See more data on the Russel 2000 Cash chart.
Russel 2000 Cash is just a number that lets you track performance of the instruments comprising the index, so you can't invest in it directly. But you can buy Russel 2000 Cash futures or funds or invest in its components.