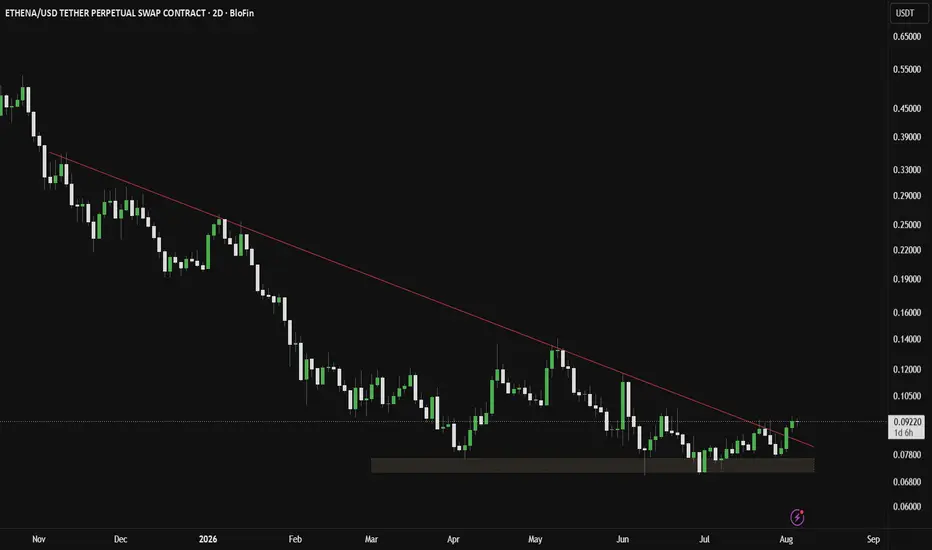
Recovery Faces a Critical Test After the HTF Triangle BreakdownENAUSDT remains technically bearish following the confirmed higher-timeframe symmetrical triangle breakdown, preserving the broader downtrend despite signs of short term stabilization.
Price is attempting to recover from a local base, but the bullish case remains dependent on reclaiming successive
ENA USDT SHORT SIGNAL#21. ENA/USDT – Trade Setup (LONG)
📈 Position Type: LONG
🕒 Timeframe: 1H
📊 Market: Futures
💰 Entry Zone:
0.091
🛑 Stop-Loss:
0.09446
🎯 Take-Profit Targets:
• TP1: 0.089
• TP2: 0.08697
• TP3: 0.08451
• TP4. 0.082
Tp5.
⚙️ Leverage:
5*10
▫️ After TP1, move SL to Entry + 0.2%.
▪️ Exit
ENA / ENAUSDT / ETHENA Long Setup | Breaker Block ReclaimMARKET ANALYSIS
ENA / ENAUSDT / ETHENA is currently reacting from a key technical area highlighted on the chart.
As long as the protected support zone remains intact, the bullish market structure remains valid and higher liquidity targets may continue to attract price action.
A breakdown belo
ENA USDT SHORT SIGNAL#143. ENA/USDT – Trade Setup (SHORT)
📈 Position Type:
🕒 Timeframe: 1H
📊 Market: Futures
💰 Entry Zone:
0.8368
🛑 Stop-Loss:
0.8650
🎯 Take-Profit Targets:
• TP1: 0.8193
• TP2: 0.7959
• TP3: 0.7640
• TP4: 0.7325
⚙️ Leverage:
5*10
▫️ After TP1, move SL to Entry + 0.2%.
▪️ Exit Plan:
•
ENA USDT SHORT SIGNAL#.6 ENA/USDT – Trade Setup (SHORT)
📈 Position Type: SHORT
🕒 Timeframe: 1H
📊 Market: Futures
💰 Entry Zone:
0.08848
🛑 Stop-Loss:
0.09071
🎯 Take-Profit Targets:
• TP1: 0.08691
• TP2: 0.08463
• TP3: 0.08187
• TP4.
Tp5.
⚙️ Leverage:
5 *10
▫️ After TP1, move SL to Entry + 0.2%.
▪️ Exi
Ethena ENA price analysisFor the past six months, OKX:ENAUSDT has been trading inside a very wide consolidation range of roughly 100%. Put simply, the market has been slowly moving the price back and forth between $0.07 and $0.14.
Then again... what's the rush? 🙂 Even at what many would call the "bottom" of the range, #E
ENAUSDT: Bearish Rejection Keeps Sellers in ControlENAUSDT has rejected the resistance zone and continues to trade below key short-term resistance, keeping bearish momentum intact. The recent failure to sustain higher prices suggests sellers remain active, increasing the probability of another leg lower.
As long as 0.09025 holds as resistance, the
ENAUSDTENAUSDT
ENAUSDT is currently trading below the 0.0931 resistance zone. This level has reacted to price multiple times in the past and is also aligned with the RSI 70 level, making it a stronger resistance area.
📈 Bullish Scenario:
A breakout and confirmation above 0.0931 could provide a potential tr
ENA 4H Level Map — 0.0932–0.0942 DecisionMIL:ENA has rallied back into the 0.0932–0.0942 decision zone after holding 0.0870–0.0890 demand.
A sustained 4H hold above 0.0942 opens 0.0985. A clean 4H close below 0.0870 invalidates the continuation map and puts 0.0820 back in play.
Bybit funding is mildly positive at 0.005% per 4h. Open int
See all ideas
Summarizing what the indicators are suggesting.
Oscillators
Neutral
SellBuy
Strong sellStrong buy
Strong sellSellNeutralBuyStrong buy
Oscillators
Neutral
SellBuy
Strong sellStrong buy
Strong sellSellNeutralBuyStrong buy
Summary
Neutral
SellBuy
Strong sellStrong buy
Strong sellSellNeutralBuyStrong buy
Summary
Neutral
SellBuy
Strong sellStrong buy
Strong sellSellNeutralBuyStrong buy
Summary
Neutral
SellBuy
Strong sellStrong buy
Strong sellSellNeutralBuyStrong buy
Moving Averages
Neutral
SellBuy
Strong sellStrong buy
Strong sellSellNeutralBuyStrong buy
Moving Averages
Neutral
SellBuy
Strong sellStrong buy
Strong sellSellNeutralBuyStrong buy
Displays a symbol's price movements over previous years to identify recurring trends.