ENJ: local squeeze with $0.0349 destinationThe Macro Picture 🗺️
ENJ unwound the entire move from the $0.10 spike down into a tight base, and price is now coiling at $0.02815 in a narrow band. The volatility has compressed hard near the lows — the kind of squeeze that usually resolves with an expansion.
The Setup ⚙️
The Range Floor 🟢
$0.02508 (Local Low) is the immediate demand shelf, with $0.01893 (Macro Support) as the deeper floor. Holding above $0.02508 keeps the base intact.
The Decision Point 🔴
$0.02964 (Local High) is the gate. A daily close above it flips the local structure bullish and opens the path to the $0.03488 measured-move target.
The Roadmap 🛣️
Hold above $0.02508 → break $0.02964 → run toward $0.03488. Invalidation is a clean daily close below $0.02508, which reopens the $0.01893 macro floor.
This is a GRID Range Play: a defined band to rotate, buying the lower half and scaling out into the breakout.
More setups in profile.
#ENJ #Enjin #crypto #trading #TA #3Commas #GRID
In-depth trading ideas
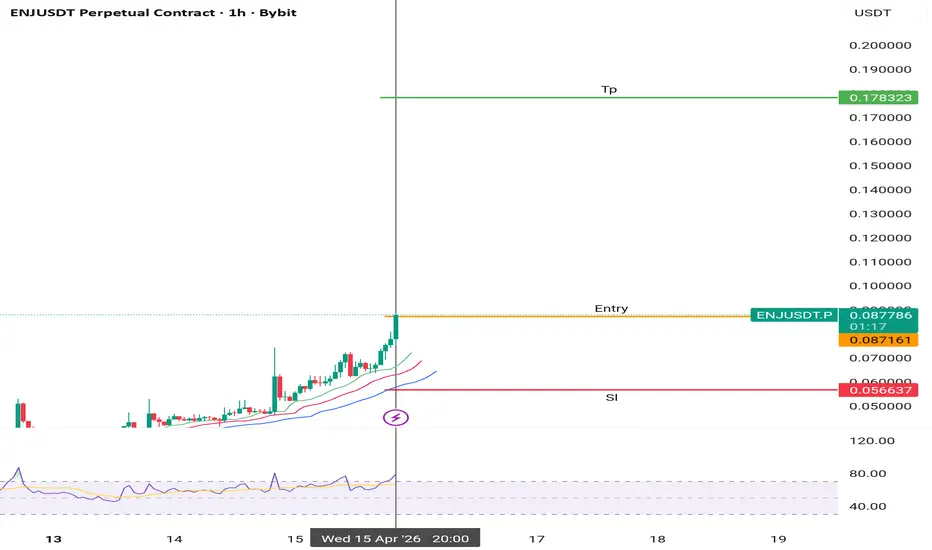
enjusdt longInstructions:
Entry point: yellow
Stop loss: red
Take profit: green
👉Leverage x 5-10-20 for crypto
👉Leverage x 20-50-100 for commodities, stocks, indices, and forex
👉Margin 1-5% max.
Always practice risk and money management.
Invest a maximum of 5% on any trade or across all your trades.
Invest only what you can afford to lose, as no one is in control of the market.
👉Our analyses are primarily based on:
breakouts: two trend lines (ascending and descending) and a line indicating a horizontal breakout.
chart patterns: shoulders and head, triangle parttern, elliott impulse, etc etc.
We don't always have the time to track them at all times or to represent them visibly, given the numerous signals, the number of channels to manage, and especially because of the often rapid pace of market movements.
indicators: We associate at least two indicators with this technique.
👉Depending on the circumstances, we use specific indicators, often setting 3 or more take profit levels.
👉Indeed, there are good days in trading and also bad days. No one can promise to win every trade, and like all traders worldwide, we also experience stop-loss orders. However, we win more than we lose and remain positive.
👉You can close the position before or after the take profit orders indicated by the green lines if you are personally satisfied; the same applies to stop loss orders.
👉We must stay positive, clear-headed, and humble.
we cannot provide all instructions or all trades here on this channel.
Good luck to us all, and may God guide us. Amen.
Enjin Coin: Higher Low & Higher High (PP: 1,200%)ENJUSDT (Enjin Coin) was one of the first projects to move strongly. The first move resulted in more than 500% growth and appeared together with the highest volume ever, by far.
The strong initial bullish breakout and the astonishingly high volume clearly reveals one thing, the start of a new bull market, the first one since March 2020. It took this project six full years to complete its bear market.
This is truly uncharted territory. ENJUSDT experienced one bull market in its history and that's it, total growth almost 15,000%. After six years of a bear market now everything again becomes possible. A new all-time low means a full flush so anything can happen.
The initial bullish breakout was followed by a seven weeks long correction and this correction always results in a higher low which came in this same week. This development, the end of the correction, signals the start of a new bullish wave, the third wave of a bullish impulse which tends to be the biggest.
ENJ can grow for months and really, really high this time around. The stage is set, the chart is ready, the market is ready and truly, we know exactly what follows next.
Higher lows lead to higher highs... There is no volume on the drop. The main target sits at $0.43 mid- to long-term. That's more than 1,200% profits potential from the current price. Amazing. We will see how it all develops.
Thank you for reading.
Namaste.
Enjusdt shortInstructions:
Entry point: yellow
Stop loss: red
Take profit: green
👉Leverage x 5-10-20 for crypto
👉Leverage x 20-50-100 for commodities, stocks, indices, and forex
👉Margin 1-5% max.
Always practice risk and money management.
Invest a maximum of 5% on any trade or across all your trades.
Invest only what you can afford to lose, as no one is in control of the market.
👉Our analyses are primarily based on:
breakouts: two trend lines (ascending and descending) and a line indicating a horizontal breakout.
chart patterns: shoulders and head, triangle parttern, elliott impulse, etc etc.
We don't always have the time to track them at all times or to represent them visibly, given the numerous signals, the number of channels to manage, and especially because of the often rapid pace of market movements.
indicators: We associate at least two indicators with this technique.
👉Depending on the circumstances, we use specific indicators, often setting 3 or more take profit levels.
👉Indeed, there are good days in trading and also bad days. No one can promise to win every trade, and like all traders worldwide, we also experience stop-loss orders. However, we win more than we lose and remain positive.
👉You can close the position before or after the take profit orders indicated by the green lines if you are personally satisfied; the same applies to stop loss orders.
👉We must stay positive, clear-headed, and humble.
we cannot provide all instructions or all trades here on this channel.
Good luck to us all, and may God guide us. Amen.
enjusdt short Roddy01-SIGNALSPROVIDERInstructions:
Entry point: yellow
Stop loss: red
Take profit: green
👉Leverage x 5-10-20 for crypto
👉Leverage x 20-50-100 for commodities, stocks, indices, and forex
👉Margin 1-5% max.
Always practice risk and money management.
Invest a maximum of 5% on any trade or across all your trades.
Invest only what you can afford to lose, as no one is in control of the market.
👉Our analyses are primarily based on:
breakouts: two trend lines (ascending and descending) and a line indicating a horizontal breakout.
chart patterns: shoulders and head, triangle parttern, elliott impulse, etc etc.
We don't always have the time to track them at all times or to represent them visibly, given the numerous signals, the number of channels to manage, and especially because of the often rapid pace of market movements.
indicators: We associate at least two indicators with this technique.
👉Depending on the circumstances, we use specific indicators, often setting 3 or more take profit levels.
👉Indeed, there are good days in trading and also bad days. No one can promise to win every trade, and like all traders worldwide, we also experience stop-loss orders. However, we win more than we lose and remain positive.
👉You can close the position before or after the take profit orders indicated by the green lines if you are personally satisfied; the same applies to stop loss orders.
👉We must stay positive, clear-headed, and humble.
we cannot provide all instructions or all trades here on this channel.
Good luck to us all, and may God guide us. Amen.
ENJUSDT Forming Bullish MomentumENJUSDT is forming a clear bullish momentum pattern, a classic bullish wave signal that often indicates an upcoming breakout. The price has been consolidating within a narrowing range, suggesting that selling pressure is weakening while buyers are beginning to regain control. With consistent volume confirming accumulation at lower levels, the setup hints at a potential bullish breakout soon. The projected move could lead to an impressive gain of around 90% to 100% once the price breaks above the wedge resistance.
This bullish momentum pattern is typically seen at the end of downtrends or corrective phases, and it represents a potential shift in market sentiment from bearish to bullish. Traders closely watching ENJUSDT are noting the strengthening momentum as it nears a breakout zone. The good trading volume adds confidence to this pattern, showing that market participants are positioning early in anticipation of a reversal.
Investors’ growing interest in ENJUSDT reflects rising confidence in the project’s long-term fundamentals and current technical strength. If the breakout confirms with sustained volume, this could mark the start of a fresh bullish leg. Traders might find this a valuable setup for medium-term gains, especially as the wedge pattern completes and buying momentum accelerates.
✅ Show your support by hitting the like button!
✅ Leave a comment below! (What is your opinion about this Coin?)
Your feedback and engagement keep me inspired to share more insightful market analysis with you!
Enjin coin ENJ price analysisWait… did we just miss the start of altseason? 😏
The move on OKX:ENJUSDT looks pretty aggressive:
from $0.02 to $0.10 in just over a week.
👇 But then you zoom out…
ATH for Enjin Coin is around $4.85 — so suddenly it doesn’t feel “too late” anymore.
But here’s the catch 👇
📉From a TA perspective, a correction looks very likely:
▪️ potential drop to $0.035–0.04
▪️ roughly -60% from current levels
So if you’re trading CRYPTOCAP:ENJ — stay careful.
P.S:
Looking at CRYPTOCAP:BTC dominance, there might still be a small window of opportunity for some altcoins.
What do you think — early altseason or just isolated pumps?
______________
◆ Follow us ❤️ for daily crypto insights & updates!
🚀 Don’t miss out on important market moves
🧠 DYOR | This is not financial advice, just thinking out loud
ENJUSDT.P: short setup from daily support at 0.05168BINANCE:ENJUSDT.P caught my attention with how cleanly the level is being respected. To be honest, the daily timeframe doesn't look great, but what the 5-minute chart shows is definitely worth a look.
We can see a confident price drop right from the daily open, followed by a high-volatility strike exactly at the level—pip for pip. A sharp drop like that would have continued if the price hadn't hit a wall. In our case, that "wall" is someone's large limit order absorbing the selling pressure.
After that, we saw another test of the level. In total, we already have two fakeouts, to which the asset shows zero bullish reaction. It's just sitting in consolidation right above the support, gearing up to break it. Therefore, I am expecting a breakout.
Where would you place your stop loss in this situation?
ENJUSDT Forming Bullish MomentumENJUSDT is currently forming a clear bullish momentum pattern, a classic wave structure that often signals an upcoming breakout. The price has been consolidating within a narrowing range, indicating that selling pressure is gradually weakening while buyers are beginning to regain control. With consistent volume supporting accumulation at lower levels, the setup suggests a strong potential for a bullish breakout in the near term.
If the price breaks above the wedge resistance, the projected move could be significant, with a potential gain of around 90% to 100%. This type of bullish momentum pattern is typically seen at the end of downtrends or corrective phases, signaling a possible shift in market sentiment from bearish to bullish.
Traders closely monitoring ENJUSDT are observing strengthening momentum as it approaches a key breakout zone. The presence of solid trading volume adds confidence to this setup, indicating that market participants may be positioning early in anticipation of a reversal.
Growing investor interest in ENJUSDT reflects rising confidence in its technical structure and overall market potential. If the breakout is confirmed with strong and sustained volume, it could mark the beginning of a fresh bullish leg. This setup may present a valuable opportunity for medium-term traders as momentum builds and the pattern completes.
✅ Show your support by hitting the like button
✅ Leave a comment below (What is your opinion about this coin?)
Your feedback and engagement keep me motivated to share more insightful market analysis with you!
ENJUSDT Forming Falling WedgeENJUSDT is forming a clear falling wedge pattern, a classic bullish reversal signal that often indicates an upcoming breakout. The price has been consolidating within a narrowing range, suggesting that selling pressure is weakening while buyers are beginning to regain control. With consistent volume confirming accumulation at lower levels, the setup hints at a potential bullish breakout soon. The projected move could lead to an impressive gain of around 190% to 200% once the price breaks above the wedge resistance.
This falling wedge pattern is typically seen at the end of downtrends or corrective phases, and it represents a potential shift in market sentiment from bearish to bullish. Traders closely watching ENJUSDT are noting the strengthening momentum as it nears a breakout zone. The good trading volume adds confidence to this pattern, showing that market participants are positioning early in anticipation of a reversal.
Investors’ growing interest in ENJUSDT reflects rising confidence in the project’s long-term fundamentals and current technical strength. If the breakout confirms with sustained volume, this could mark the start of a fresh bullish leg. Traders might find this a valuable setup for medium-term gains, especially as the wedge pattern completes and buying momentum accelerates.
✅ Show your support by hitting the like button and
✅ Leaving a comment below! (What is your opinion about this Coin?)
Your feedback and engagement keep me inspired to share more insightful market analysis with you!
ENJ/USDT 1H Chart AnalysisEnjin Coin continues to show strong bullish momentum, extending its gains after rallying over 90% last week, with price now stabilizing above key support levels.
Market Structure & Price Action:
After a strong impulsive move, BINANCE:ENJUSDT is currently forming a healthy pullback into a key Fibonacci support zone (0.5 – 0.618), which aligns with previous structure support.
Key Levels from Chart:
Support Zone: $0.04964 – $0.04592 (Fib confluence + demand area)
Entry Zone: Around $0.04959
Stop Loss: $0.04459
Targets:
• TP1: $0.05958
• TP2: $0.07459
Technical Confluence:
• Strong bounce from 0.618 Fibonacci level → classic continuation setup
• Higher highs & higher lows forming → bullish structure intact
• Trendline support holding → buyers defending dips
On-Chain / Derivatives Insight:
Rising open interest alongside increasing trading volume signals growing trader participation and conviction, supporting the bullish case.
Bias: BULLISH (Continuation Setup)
As long as price holds above the support zone, probability favors a continuation toward higher liquidity levels.
Conclusion:
BINANCE:ENJUSDT is showing a textbook pullback + continuation pattern after a strong rally.
If support holds, this setup offers a solid risk-to-reward long opportunity.
ENJUSDT - Extreme BullENJUSDT at 0.06683 with futures at 0.06582, a 101-pip basis gap — spot running a significant premium to futures at -1.51% Xtreme Bkwd Z:-2, two standard deviations into backwardation. Spot volume 459.04M against futures 4.01B, Spot:Fut Confirmed — the regime has crossed into full confirmation, meaning both spot and futures are participating in directional agreement. S/F dollar split 267.69M futures versus 30.68M spot. Extreme Bull 87.05% at 14.44x, Clarity 56.25% — the highest bull edge reading of the session with confidence above threshold. Bull Cascade active at 5 bars, 135.6%.
Signal board 59 green to 4 red out of 112 — the most dominant bull signal count across all pairs today, 93.5% green ratio. C>T 14:0 clean sweep, EMA 10:0 all bull, Candle 14:0 perfect, Ichi TK 8:4, Engulf 5:0, 3Sold 4:0, Star 4:0, Pat Tot 8:0. DD/SS 1:4 is the only distribution note in an otherwise flawless signal board. Squeeze None, BW:189.36% Explosion — bandwidth has fully exploded, no compression remaining, the move is fully in progress. Mom Bull Explosion. S.Mom Exp down 500.1% Normal — post-explosion momentum consolidation. MeanZ -1.5σ Drop. StdDev 45.824% Volatile. Cascade Bull at 5 bars 135.6%. Yield -1655% APY -2σ Bull.
Spot Z 1.24 Elevated, Futures Z 1.03 Elevated, Combined 1.05 Elevated — both sides elevated simultaneously, the only pair today showing dual elevated Z readings. SpotZ 0:5 sequence 1.24 to 1.56 to -0.32 Falling — the volume spike peaked and is now decelerating sharply. Bull:Bear Z 1.11 to -0.49 Neutral. OBV Z 7.37 Rush up — the highest OBV Z reading in today's entire session by a massive margin, sequence 7.37 to 5.57 to 1.8 showing rush inflow that is now tapering. Spread Div flagged alongside OBV Rush — the OBV surge is diverging from price spread, a sustainability caution identical to RED earlier. No whale despite the volume, no liquidations.
Leverage 8.58x flat, Elevated. Percentile 24.1% Floor — leverage is at its historical floor despite the explosive move, confirming this is not a leveraged squeeze but genuine buying. AT Max 30.51x at 925 bars ago, AT Min 1.62x at 411 bars. Price at 89% Upper — price is near the top of its entire historical range, the only pair today in the upper percentile. Retrace -9.1% Deep, Bounce 251.4% at 27.8x Para — parabolic classification.
The honest read: ENJ is the standout of the session — 59:4 signal count, EMA and C>T clean sweeps, OBV Z at 7.37 Rush with both spot and futures elevated in Confirmed regime, leverage at floor, and Bull Cascade running. The volume intelligence is as clean as it gets for a momentum continuation case. The caution flags are equally clear — SpotZ falling from 1.56, OBV Rush tapering from 7.37, Spread Div active, price at 89% Upper with parabolic bounce classification, and BW fully exploded. This is post-breakout consolidation territory, not a fresh entry point. The move has happened. Wait for OBV Z to stabilise above 3.0 and SpotZ to re-accelerate on the next consolidation bar before adding exposure. Existing positions trail stop only.
Is That Crypto Pump Real? Data Says No. Here's Why.
Stop Losing Money to Fake Volume. Find Real Moves Now.
Trade the REAL Crypto Volume. Stop Getting Faked Out.
Enjin Coin, Bitcoin & The Altcoins MarketWhat are the odds of a bullish continuation?
Let's see... We just have to look at Enjin Coin vs USDT.
There you have your continuation.
Have you ever seen Enjin Coin growing, or any of the legacy projects for that matter, while the market is crashing through an overextended bear market?
Have you ever seen sustained bullish action on this and other altcoins while Bitcoin hits new lows?
It is not possible, the market is one.
When in doubt, zoom out.
Let's say you look at Bitcoin and you start to doubt based on the short-term. Zoom out, look at the weekly timeframe—all doubt goes away.
That's my thinking. The fact that these altcoins are growing, it means the bigger projects will also continue to grow. That's one signal out of hundreds.
And remember, the short-term doesn't count.
Bitcoin continues bullish as long as it trades above $60,000. It can retrace for weeks or days, nothing changes.
The market can continue to recover and the altcoins can continue to grow. Bitcoin can produce just another higher low and then resume rising. The market is not in a hurry. We are going up.
Namaste.
Enjin Coin, the start of a bull marketEnjoin Coin in 2021 went through an incredible bull market. One of the signals that appeared to confirm the start of this bull market was a new all-time low followed by the highest volume ever.
The signal appeared twice before the final high. The highest volume ever at some point after the start of the bullish cycle. Then again during the process and once more, the highest ever, to end the third wave. Total growth resulted in almost 15,000%.
Let's look at the present.
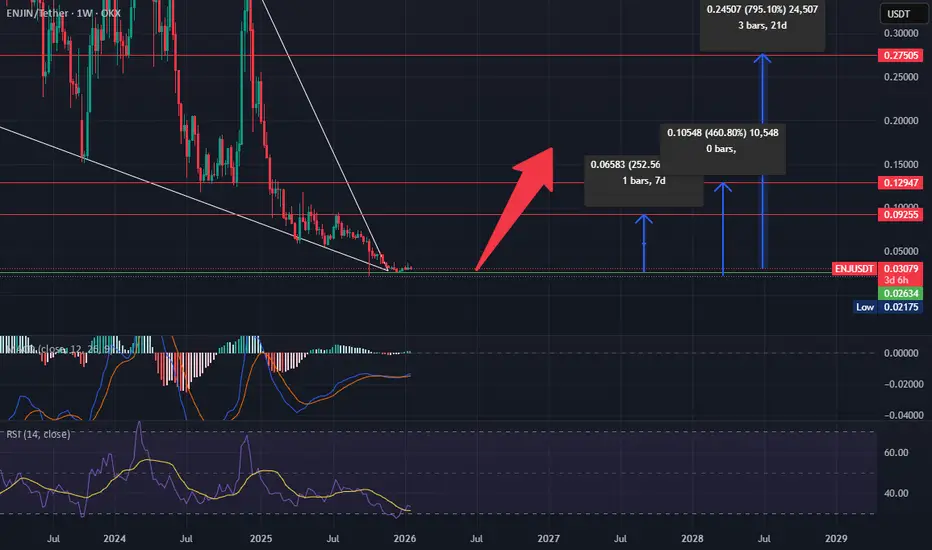
ENJUSDT hit a new all-time low recently while creating a falling wedge pattern. To break out of this pattern, which is a bullish reversal signal, ENJ produced the highest volume since the previous bull market. The second highest-volume weekly session ever. It might close being the first one.
This signal reveals the start of a new bull market on this trading pair.
It can happen that even higher volume shows up as the bull market unfolds.
Enjin Coin is set to grow long-term.
Namaste.
Is #ENJ On The Edge Of Collapse or Will it Recover From here? Yello Paradisers! Is #ENJ about to break down hard toward major demand, or are bears walking straight into a trap before a violent reversal? Let’s dissect this #EnjinCoin setup:
💎#ENJUSDT is trading on the 4H timeframe inside a well-defined descending triangle. The structure shows a flat lower support around $0.018 and a descending resistance trendline that continues to push the price lower. This is a classic bearish continuation pattern, especially after a prolonged downtrend.
💎The price is currently trading around $0.019, still below the descending trendline. The 50EMA will need to act as dynamic resistance to increase the bearish bias. Momentum indicators are showing bearish divergence, suggesting weakening bullish strength during recent bounces. As long as the price remains compressed inside this structure, pressure continues to build.
💎The key level to watch on the downside is the $0.018 horizontal support. A clean 4H breakdown below this level, followed by a rejection retest from underneath, would confirm continuation toward lower liquidity zones. The $0.012 region is the real liquidity magnet. If price accelerates toward this zone, we could see panic selling and long liquidations before a potential high-probability bounce.
💎To invalidate the bearish scenario, #ENJUSD must break and hold above the strong horizontal resistance at $0.023. This level also aligns with the upper resistance cluster. A strong 4H close above $0.023 would invalidate the descending triangle breakdown.
Trade smart, Paradisers. This setup will reward only the disciplined.
MyCryptoParadise
iFeel the success🌴
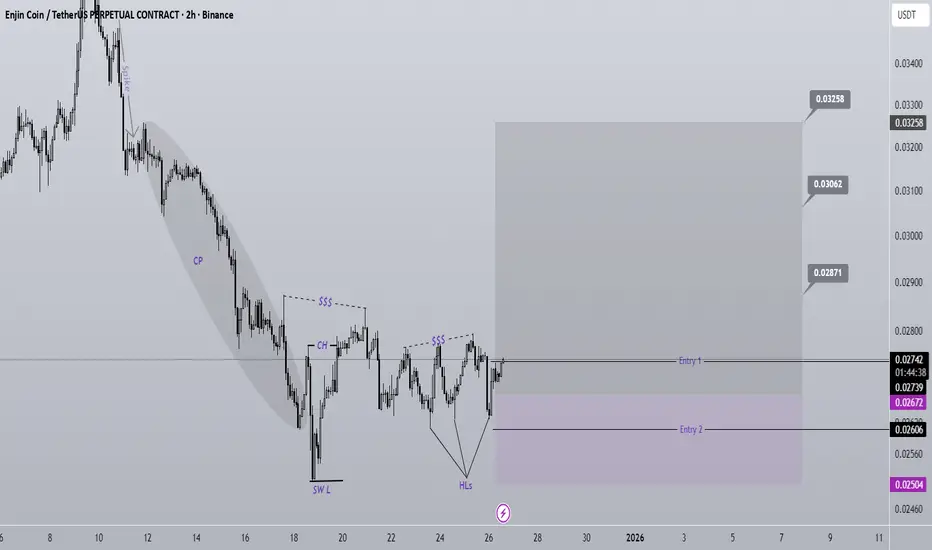
ENJ Buy/Long Signal (4H)ENJ has formed a bullish CH (Change of Character) on the chart.
Higher lows are continuously being printed, and at the top of the chart we have a CP pullback/drop.
If the price holds the two entry points that we marked on the chart, it can move upward and attack the higher zones.
We have two entry points, which should be entered using a DCA approach.
It is expected that the liquidity pools above the chart will be swept soon.
Do not enter the position without capital management and stop setting
Comment if you have any questions
thank you
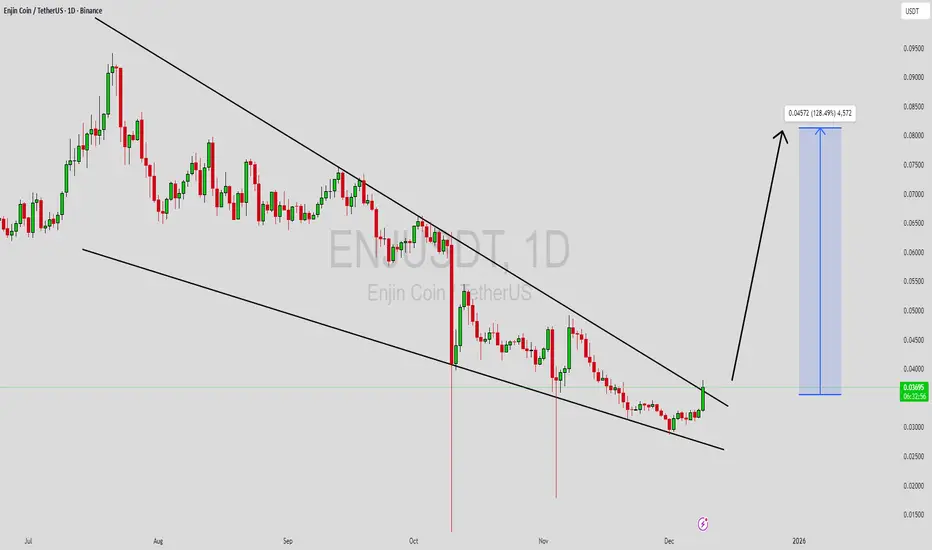
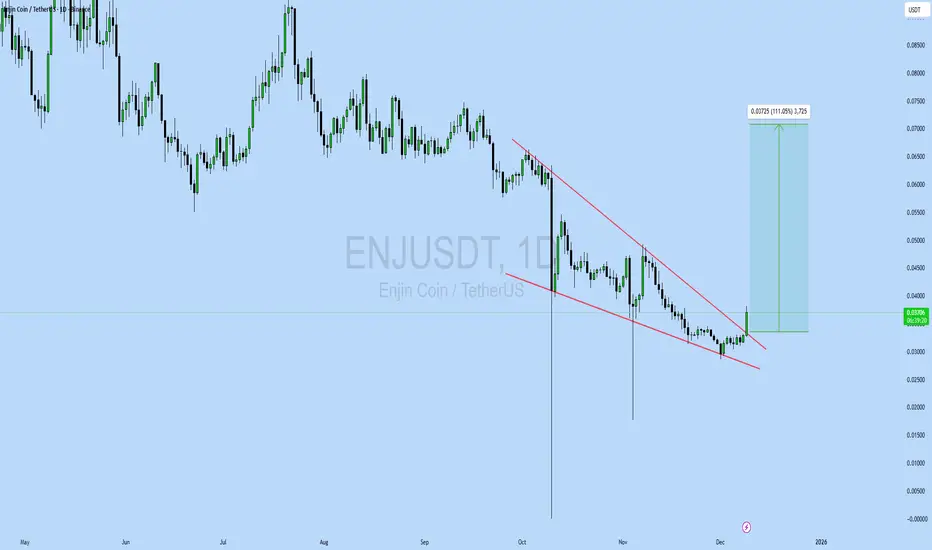
ENJUSDT Forming Falling WedgeENJUSDT is forming a clear falling wedge pattern, a classic bullish reversal signal that often indicates an upcoming breakout. The price has been consolidating within a narrowing range, suggesting that selling pressure is weakening while buyers are beginning to regain control. With consistent volume confirming accumulation at lower levels, the setup hints at a potential bullish breakout soon. The projected move could lead to an impressive gain of around 90% to 100% once the price breaks above the wedge resistance.
This falling wedge pattern is typically seen at the end of downtrends or corrective phases, and it represents a potential shift in market sentiment from bearish to bullish. Traders closely watching ENJUSDT are noting the strengthening momentum as it nears a breakout zone. The good trading volume adds confidence to this pattern, showing that market participants are positioning early in anticipation of a reversal.
Investors’ growing interest in ENJUSDT reflects rising confidence in the project’s long-term fundamentals and current technical strength. If the breakout confirms with sustained volume, this could mark the start of a fresh bullish leg. Traders might find this a valuable setup for medium-term gains, especially as the wedge pattern completes and buying momentum accelerates.
✅ Show your support by hitting the like button and
✅ Leaving a comment below! (What is your opinion about this Coin?)
Your feedback and engagement keep me inspired to share more insightful market analysis with you!
ENJUSDT UPDATEENJ
UPDATE
ENJ Technical Setup
Pattern: Falling Wedge Pattern
Current Price:
Target Price:
Target % Gain: 110520%
Technical Analysis: ENJ is breaking out of a falling wedge pattern on the 1D chart, signaling bullish potential. The price has recently surged above the resistance trendline, supported by an increase in volume. The setup is validated as the price approaches key resistance areas.
Time Frame: 1D
Risk Management Tip: Always use proper risk management.