ENJUSDT Forming Bullish MomentumENJUSDT is forming a clear bullish momentum pattern, a classic bullish reversal signal that often indicates an upcoming breakout. The price has been consolidating within a narrowing range, suggesting that selling pressure is weakening while buyers are beginning to regain control. With consistent volume confirming accumulation at lower levels, the setup hints at a potential bullish breakout soon. The projected move could lead to an impressive gain of around 40% to 50% once the price breaks above
In-depth trading ideas
ENJ/USDT: Accumulation Range Breakout Setup on 1H ChartENJ/USDT has been coiling inside a horizontal accumulation zone following a bullish expansion leg. Price is currently pushing toward the upper boundary of the range, signaling potential momentum expansion.
Key Technical Factors:
Market Structure: Consolidation after an aggressive impulse wave, holding strong higher low support above $0.0321.
RSI Momentum: RSI (14) sits at 58.04, showing steady bullish momentum breaking back into bullish territory without being overbought.
Setup Targets: Upsi
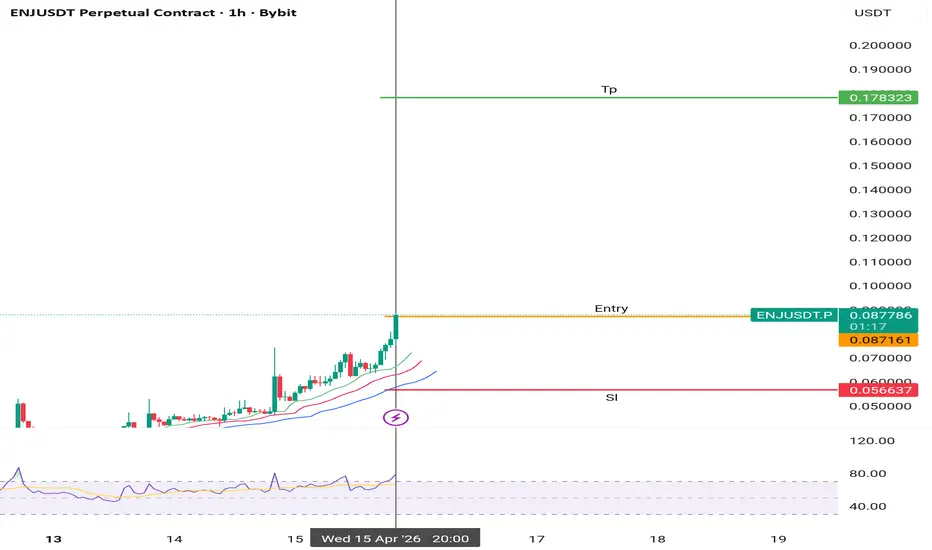
enjusdt shortINSTRUCTIONS TO READ AND TO FOLLOW:
Entry point: yellow
Stop loss: red
Take profit: green or blue
👉Leverage x 5-10-20 for crypto
👉Leverage x 20-50-100 for commodities, stocks, indices, and forex
👉Margin 1-5% max:
This limits your maximum loss to 5% and guarantees that you retain 95% of your portfolio in the event of a stop-loss.
🔥🔥🔥🔥🔥🔥🔥🔥🔥🔥🔥🔥🔥🔥
ALWAYS PRACTICE RISK AND MONEY MANAGEMENT:
🔥🔥🔥🔥🔥🔥🔥🔥🔥🔥🔥🔥🔥🔥
👉Invest a maximum of 5% on any trade or across all your trades.
Invest only what you can aff
ENJ / ENJUSDT Bullish Setup | Futures Trade IdeaMARKET ANALYSIS
ENJ is currently reacting from a key technical area highlighted on the chart.
As long as the protected support zone remains intact, the bullish market structure remains valid and higher liquidity targets may continue to attract price action.
A breakdown below the invalidation level would weaken the current bullish scenario and require a reassessment of market conditions.
📍 Entry, Stop Loss and Take Profit levels are marked directly on the chart.
━━━━━━━━━━━━━━
⚠️ DISCLA
ENJUSDT LONGInstructions:
Entry point: yellow
Stop loss: red
Take profit: green
👉Leverage x 5-10-20 for crypto
👉Leverage x 20-50-100 for commodities, stocks, indices, and forex
👉Margin 1-5% max.
Always practice risk and money management.
Invest a maximum of 5% on any trade or across all your trades.
Invest only what you can afford to lose, as no one is in control of the market.
👉Our analyses are primarily based on:
breakouts: two trend lines (ascending and descending) and a line indicating a horizontal
ENJ: local squeeze with $0.0349 destinationThe Macro Picture 🗺️
ENJ unwound the entire move from the $0.10 spike down into a tight base, and price is now coiling at $0.02815 in a narrow band. The volatility has compressed hard near the lows — the kind of squeeze that usually resolves with an expansion.
The Setup ⚙️
The Range Floor 🟢
$0.02508 (Local Low) is the immediate demand shelf, with $0.01893 (Macro Support) as the deeper floor. Holding above $0.02508 keeps the base intact.
The Decision Point 🔴
$0.02964 (Local High) is the gate.
Enjin Coin: Higher Low & Higher High (PP: 1,200%)ENJUSDT (Enjin Coin) was one of the first projects to move strongly. The first move resulted in more than 500% growth and appeared together with the highest volume ever, by far.
The strong initial bullish breakout and the astonishingly high volume clearly reveals one thing, the start of a new bull market, the first one since March 2020. It took this project six full years to complete its bear market.
This is truly uncharted territory. ENJUSDT experienced one bull market in its history and that
ENJUSDT Forming Bullish MomentumENJUSDT is forming a clear bullish momentum pattern, a classic bullish wave signal that often indicates an upcoming breakout. The price has been consolidating within a narrowing range, suggesting that selling pressure is weakening while buyers are beginning to regain control. With consistent volume confirming accumulation at lower levels, the setup hints at a potential bullish breakout soon. The projected move could lead to an impressive gain of around 90% to 100% once the price breaks above the
Enjin coin ENJ price analysisWait… did we just miss the start of altseason? 😏
The move on OKX:ENJUSDT looks pretty aggressive:
from $0.02 to $0.10 in just over a week.
👇 But then you zoom out…
ATH for Enjin Coin is around $4.85 — so suddenly it doesn’t feel “too late” anymore.
But here’s the catch 👇
📉From a TA perspective, a correction looks very likely:
▪️ potential drop to $0.035–0.04
▪️ roughly -60% from current levels
So if you’re trading CRYPTOCAP:ENJ — stay careful.
P.S:
Looking at CRYPTOCAP:BTC dominance, t
ENJUSDT.P: short setup from daily support at 0.05168BINANCE:ENJUSDT.P caught my attention with how cleanly the level is being respected. To be honest, the daily timeframe doesn't look great, but what the 5-minute chart shows is definitely worth a look.
We can see a confident price drop right from the daily open, followed by a high-volatility strike exactly at the level—pip for pip. A sharp drop like that would have continued if the price hadn't hit a wall. In our case, that "wall" is someone's large limit order absorbing the selling pressure.
ENJUSDT Forming Bullish MomentumENJUSDT is currently forming a clear bullish momentum pattern, a classic wave structure that often signals an upcoming breakout. The price has been consolidating within a narrowing range, indicating that selling pressure is gradually weakening while buyers are beginning to regain control. With consistent volume supporting accumulation at lower levels, the setup suggests a strong potential for a bullish breakout in the near term.
If the price breaks above the wedge resistance, the projected move
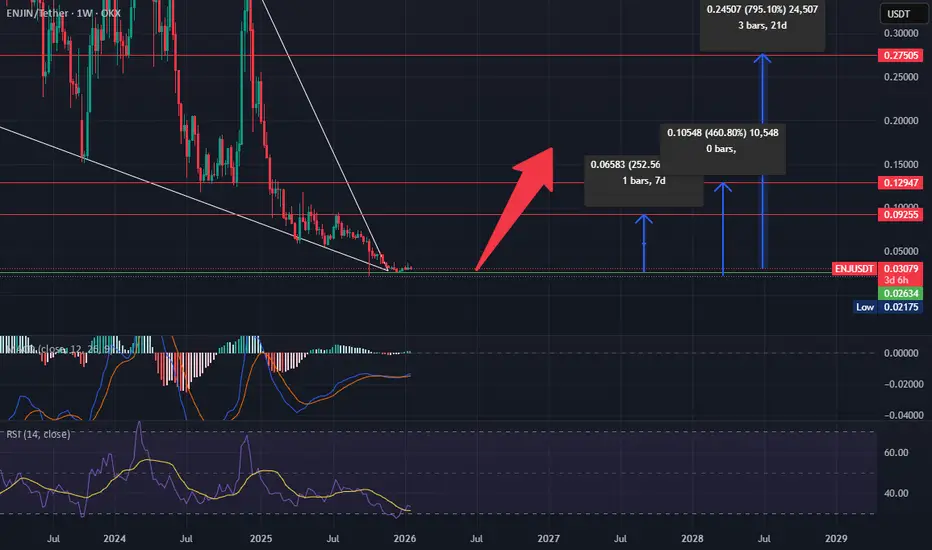
ENJUSDT Forming Falling WedgeENJUSDT is forming a clear falling wedge pattern, a classic bullish reversal signal that often indicates an upcoming breakout. The price has been consolidating within a narrowing range, suggesting that selling pressure is weakening while buyers are beginning to regain control. With consistent volume confirming accumulation at lower levels, the setup hints at a potential bullish breakout soon. The projected move could lead to an impressive gain of around 190% to 200% once the price breaks above t
ENJ/USDT 1H Chart AnalysisEnjin Coin continues to show strong bullish momentum, extending its gains after rallying over 90% last week, with price now stabilizing above key support levels.
Market Structure & Price Action:
After a strong impulsive move, BINANCE:ENJUSDT is currently forming a healthy pullback into a key Fibonacci support zone (0.5 – 0.618), which aligns with previous structure support.
Key Levels from Chart:
Support Zone: $0.04964 – $0.04592 (Fib confluence + demand area)
Entry Zone: Around $0.04959
Sto
ENJUSDT - Extreme BullENJUSDT at 0.06683 with futures at 0.06582, a 101-pip basis gap — spot running a significant premium to futures at -1.51% Xtreme Bkwd Z:-2, two standard deviations into backwardation. Spot volume 459.04M against futures 4.01B, Spot:Fut Confirmed — the regime has crossed into full confirmation, meaning both spot and futures are participating in directional agreement. S/F dollar split 267.69M futures versus 30.68M spot. Extreme Bull 87.05% at 14.44x, Clarity 56.25% — the highest bull edge reading
Enjin Coin, Bitcoin & The Altcoins MarketWhat are the odds of a bullish continuation?
Let's see... We just have to look at Enjin Coin vs USDT.
There you have your continuation.
Have you ever seen Enjin Coin growing, or any of the legacy projects for that matter, while the market is crashing through an overextended bear market?
Have you ever seen sustained bullish action on this and other altcoins while Bitcoin hits new lows?
It is not possible, the market is one.
When in doubt, zoom out.
Let's say you look at Bitcoin and you sta
Enjin Coin, the start of a bull marketEnjoin Coin in 2021 went through an incredible bull market. One of the signals that appeared to confirm the start of this bull market was a new all-time low followed by the highest volume ever.
The signal appeared twice before the final high. The highest volume ever at some point after the start of the bullish cycle. Then again during the process and once more, the highest ever, to end the third wave. Total growth resulted in almost 15,000%.
Let's look at the present.
ENJUSDT hit a new all-
Is #ENJ On The Edge Of Collapse or Will it Recover From here? Yello Paradisers! Is #ENJ about to break down hard toward major demand, or are bears walking straight into a trap before a violent reversal? Let’s dissect this #EnjinCoin setup:
💎#ENJUSDT is trading on the 4H timeframe inside a well-defined descending triangle. The structure shows a flat lower support around $0.018 and a descending resistance trendline that continues to push the price lower. This is a classic bearish continuation pattern, especially after a prolonged downtrend.
💎The price is c
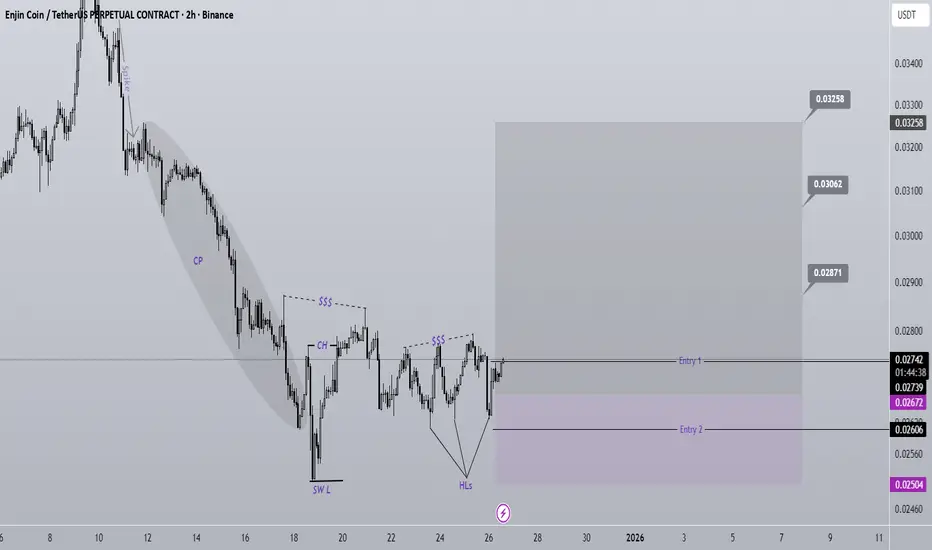
ENJ Buy/Long Signal (4H)ENJ has formed a bullish CH (Change of Character) on the chart.
Higher lows are continuously being printed, and at the top of the chart we have a CP pullback/drop.
If the price holds the two entry points that we marked on the chart, it can move upward and attack the higher zones.
We have two entry points, which should be entered using a DCA approach.
It is expected that the liquidity pools above the chart will be swept soon.
Do not enter the position without capital management and stop settin