ENS at macro floor: base recovery toward $5.176The Macro Picture 🗺️
ENS unwound from the $8.130 macro ceiling all the way down and has flattened into a base just above the $3.949 floor, now at $4.279. The steep selling has given way to a sideways grind — exhaustion rather than continuation.
The Setup ⚙️
The Accumulation Zone 🟢
$3.949–4.279 is where the selling has dried up. Macro Support has held on retest, and this is the demand shelf a recovery would build from.
The Decision Point 🔴
$6.954 (Local High) is the structural gate far above. Before it, the $5.176 measured-move target is the first objective — reclaiming it proves buyers are stepping back in.
The Roadmap 🛣️
Hold the $3.949 floor → recover toward $5.176 as the first leg up. Invalidation is a clean daily close below $3.949 — that voids the accumulation thesis.
This is a textbook DCA Accumulation Zone setup: scale in across the $3.949–4.279 band and let the base do the work.
#ENS #EthereumNameService #crypto #trading #TA #3Commas #DCA
In-depth trading ideas
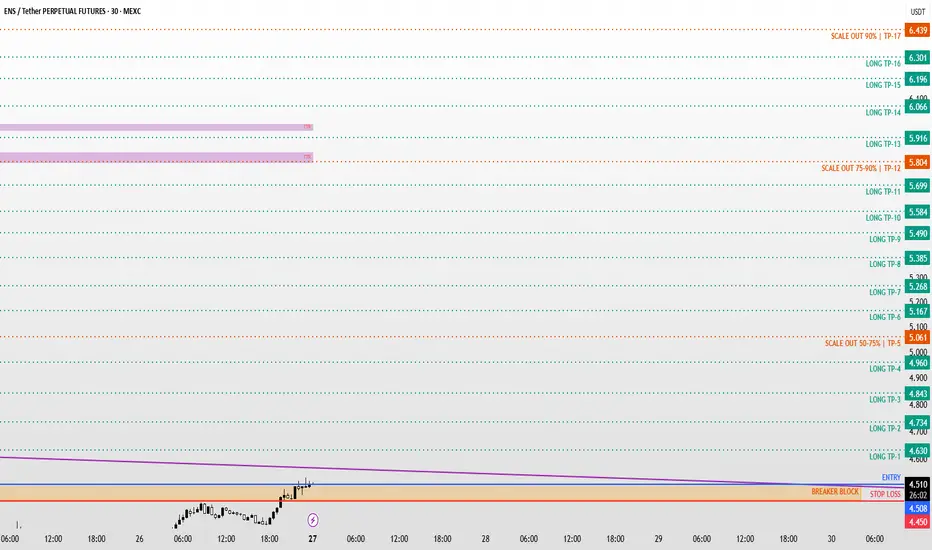
ENS / ENSUSDT Long Setup | Breaker Block ReclaimMARKET ANALYSIS
ENS is currently reacting from a key technical area highlighted on the chart.
As long as the protected support zone remains intact, the bullish market structure remains valid and higher liquidity targets may continue to attract price action.
A breakdown below the invalidation level would weaken the current bullish scenario and require a reassessment of market conditions.
📍 Entry, Stop Loss and Take Profit levels are marked directly on the chart.
━━━━━━━━━━━━━━
⚠️ DISCLAIMER
This publication is provided solely for educational and market observation purposes.
Nothing contained in this analysis should be considered financial advice, investment advice, or a recommendation to buy or sell any financial instrument.
All trading and investment decisions remain solely the responsibility of the individual trader.
Always conduct your own research and apply proper risk management before entering any position.
━━━━━━━━━━━━━━
🎯 PARALOG
▪️Crypto Market Analysis
▪️BTC Futures Signals
▪️Bitcoin & Altcoin Market Analysis
Precision • Momentum • Timing
━━━━━━━━━━━━━━
Exchange: #MEXC Futures
#bitcoin #btc #crypto #futures #technicalanalysis
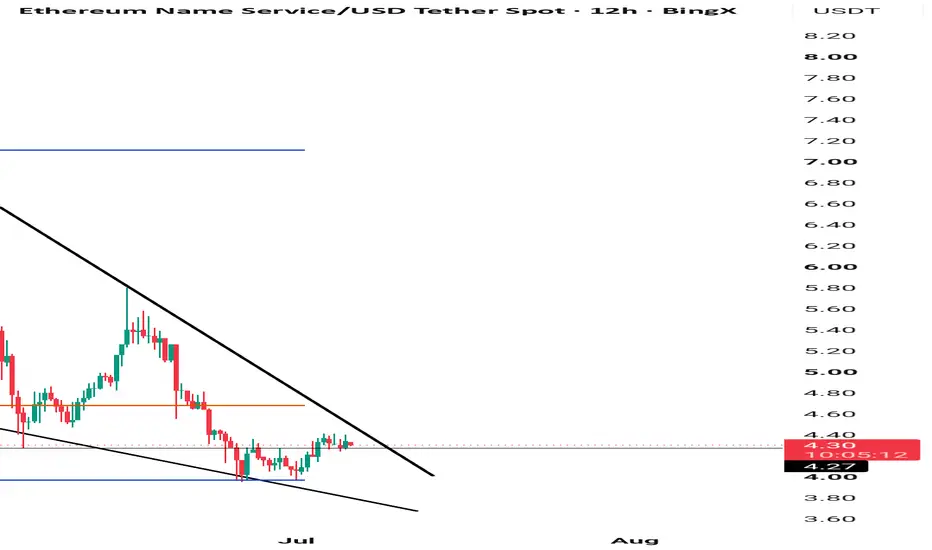
Long Swing Trade for #ENS/USDT | 12H TFLong Swing Trade for #ENS/USDT | 12H TF
ENS/USDT is trading inside a long-term descending channel and is currently holding above the lower support trendline. Price is showing signs of accumulation around a strong high-volume demand zone, while bearish momentum appears to be fading. A breakout above the descending resistance could trigger a strong bullish recovery toward the next resistance levels.
Fundamental: Ethereum Name Service (ENS) provides human-readable blockchain names for wallets, websites, and Web3 applications.
Entry: 4.25 – 4.00
Target 1: 4.31
Target 2: 4.36
Target 3: 4.42
Target 4: 4.46
Mid-Term Holding: 6.68
Risk Management: Book partial profits at each target.
After TP1, move SL to Entry. After TP2, move SL to TP1.
SL: 3.80
Wait for the Entry
ENS: local squeeze with $5.00 destinationThe Macro Picture 🗺️
ENS unwound its May $8.10 highs through a steep descent that bottomed at $3.90 in early July. Since then the structure has shifted from trend to range — price is now rotating inside a $3.90–4.60 band, a volatility playground where the lows keep getting defended and the rallies faded back toward the middle. Price sits in the lower half near $4.20 with RSI recovering toward the midline around 42. With the floor established and momentum turning up, buying into the lower portion of the range rather than chasing strength is the higher-confluence play, and the path of least resistance leans back toward the upper boundary.
The Setup ⚙️
The Buy Area: The $3.90–4.20 band has absorbed the recent dips. Bulls are defending the equilibrium, and as marked on the chart, price is holding above the $3.90 local support with room to rotate higher.
The Ceiling: The $4.60 decision line caps the range. A clean reclaim flips the local structure bullish and opens the path toward the $5.00 macro resistance above.
The Range Play: The zone between $3.90 and $4.60 creates a structural playground for grid-based accumulation — staggered entries across the range capture the chop while the market decides its next macro leg.
The Roadmap: Primary target sits at $5.00 — the green roadmap points there as price works up from the support toward the range top. Invalidation: a clean daily close below $3.70 would invalidate this bullish thesis and signal a structural breakdown out of the range.
More setups in profile.
#ENS #CRYPTO #EthereumNameService #DeFi #TechnicalAnalysis
Swing Trade for #ENS/USDT | 4H TFSwing Trade for #ENS/USDT | 4H TF
ENS/USDT is trading inside a falling wedge and is currently testing a strong support zone. The lower trendline and high-volume demand area are providing support, while the price is showing signs of seller exhaustion.
Fundamental: Ethereum Name Service (ENS) is the leading decentralized naming protocol on Ethereum. It allows users to replace complex wallet addresses with human-readable names, ENS continues to be one of the key infrastructure projects in the ecosystem.
Entry: 4.10 – 3.80
Target 1: 4.16
Target 2: 4.20
Target 3: 4.27
Target 4: 4.31
Mid-Term Holding: 4.50
Risk Management
Book partial profits at each target.
After TP1, move SL to Entry.
After TP2, move SL to TP1.
SL: 3.70
ENS Ready for a Mega Bullish Move and Most Traders Will Miss it Yello, Paradisers! Are you ready for the #ENS breakout, where impatient traders get trapped before the real explosive move begins? Let's view NYSE:ENS setup:
💎#ENSUSDT is currently showing a very clean Wyckoff-style accumulation structure on the daily timeframe, and the recent price action suggests that smart money may already be positioning for a much larger expansion phase. While most traders are still hesitating inside this range, the structure itself is becoming extremely bullish.
💎On the left side of the chart, we can clearly identify the Automatic Rally (AR) near the $7.21 region after the initial selling pressure was absorbed. This created the upper boundary of the trading range, while the Secondary Test (ST) around the $5.50 area confirmed strong demand stepping into the market.
💎Since then, #ENSUSD has spent several weeks consolidating inside this accumulation range, which is exactly how institutional accumulation typically develops. The market slows down, volatility decreases, and weak hands slowly exit their positions while stronger participants continue building exposure.
💎The current green demand zone between approximately $5.95 and $6.10 is acting as the key Last Point of Support (LPS). This area is extremely important because every healthy bullish continuation structure requires strong demand absorption before expansion can happen. As long as the price continues holding above this support region, the bullish scenario remains active.
💎Right now, the market is approaching the major resistance around $6.97–$7.21. This is the most critical level on the chart. A successful breakout above this zone would confirm the beginning of the Sign of Strength (SOS) phase and could trigger aggressive momentum continuation toward much higher levels.
💎If buyers manage to reclaim and hold above $7.21, the next major target comes near the psychological resistance around $9.78, where significant supply may enter the market again. Considering the size of this accumulation structure, the projected move could happen very aggressively once resistance finally breaks. If #EthereumNameService fails to hold the current demand zone, we could see another liquidity sweep toward the major support near $4.56. This would temporarily invalidate the bullish setup.
💎Volume profile also supports the bullish scenario, as we can clearly see heavy trading activity developing around the current accumulation region. This often indicates strong positioning by larger market participants before expansion phases begin. In addition, momentum indicators are slowly recovering from bearish conditions, showing early signs of strength building underneath the surface.
Trade smart, Paradisers. This setup will reward only the disciplined.
MyCryptoParadise
iFeel the success🌴
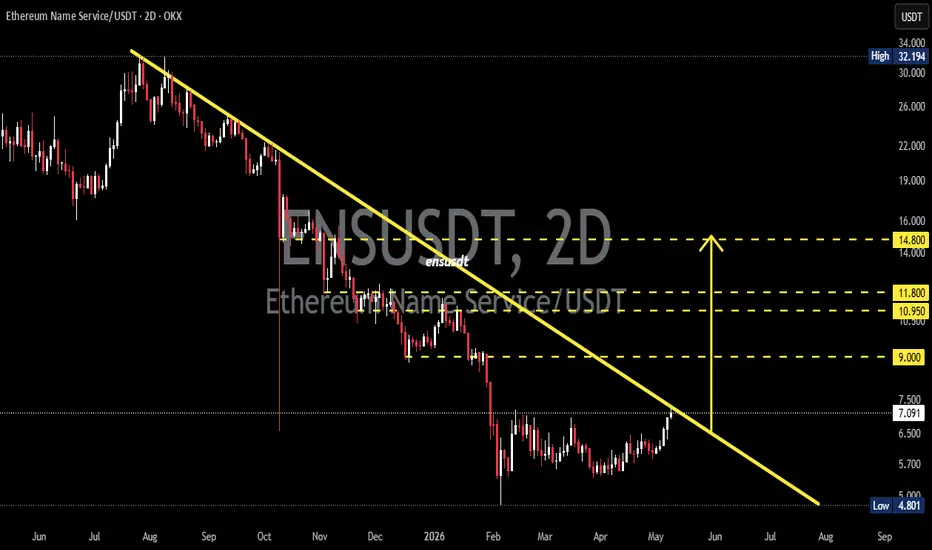
ENSUSDT Testing Key Resistance — Reversal Rally Loading?The Ethereum Name Service /USDT pair on the 2D timeframe is still trading within a mid-term bearish structure after experiencing a significant decline from the previous high around $32. However, price action is now showing early recovery signals and is approaching a crucial Descending TrendLine that has acted as strong resistance for months.
⚠️ Selling pressure is starting to weaken, while buyers are gradually building momentum from the $4.8–$5.0 low area.
If a valid breakout occurs, ENS could enter a major reversal phase and potentially start the next bullish rally.
---
📉 Pattern Explanation — Descending TrendLine
This chart forms a Descending TrendLine / Dynamic Resistance pattern, which is a downward resistance line connecting the lower highs since August 2025.
🔍 Pattern Characteristics:
✅ Price continues forming lower highs
✅ Sellers remain dominant while price stays below the trendline
✅ The more often resistance is tested, the bigger the breakout potential becomes
✅ Momentum is slowly shifting as price starts defending higher lows near the bottom range
🔥 Price is currently testing the main trendline resistance, making this a critical decision area for the market.
---
🎯 Key Levels
🚧 Major Resistance Levels
🔸 $7.0 — Trendline breakout area
🔸 $9.0 — First resistance after breakout
🔸 $10.95 – $11.8 — Important supply zone
🔸 $14.8 — Main bullish target
🛡️ Important Support Levels
🔹 $6.2 – $5.8 — Short-term support zone
🔹 $4.8 — Major low and strongest support
---
🚀 Bullish Scenario
If ENS successfully breaks out and closes strongly above the Descending TrendLine, the bullish continuation potential will increase significantly.
📈 Upside Targets:
🎯 $9.0
🎯 $10.95
🎯 $11.8
🎯 $14.8
✅ A confirmed breakout would signal:
- The end of the mid-term bearish pressure
- Momentum shifting from sellers to buyers
- Potential beginning of a larger trend reversal
📊 Increasing volume during the breakout would become an important confirmation for continued upside movement.
---
⚠️ Bearish Scenario
If price fails to break out and gets rejected again at the trendline resistance, ENS could continue its bearish trend.
📉 Possible Downside Targets:
🔻 Retest of the $5.8–$6.0 area
🔻 Potential drop back toward the major $4.8 support
As long as price remains below the Descending TrendLine, sellers technically still control the market structure.
---
🧠 Conclusion
ENS is currently trading at a very important technical area. The Descending TrendLine will become the key factor in determining whether the market enters a bullish reversal phase or continues its bearish trend.
🚨 A breakout above the trendline could become the first signal of a major market structure shift, while another rejection would maintain bearish dominance.
📌 Key things to watch:
✅ Valid breakout candle
✅ Trading volume
✅ Price reaction around the $7.0 level
Because this zone could become the starting point of the next major move.
#ENS #ENSUSDT #EthereumNameService #Crypto #Cryptocurrency #Altcoin #TradingView #TechnicalAnalysis #CryptoTrading #Bullish #Bearish #Breakout #Trendline #DescendingTrendline #Altseason #SupportResistance #PriceAction #ChartAnalysis
Ethereum Name Service (ENS): The Market Force—Up-We-Go!The bull market is already confirmed so our focus can go straight to the targets. There will be less need to look for reversal signals, confirmation signals, supporting signals and so on. People already know Crypto is going up.
In some ways, we might be ahead of the majority but this is only because we track the charts and market on a daily basis. The news is spreading really fast and you know how everything can change in a flash. Today the market is down, the next day everybody is commenting about long-term growth.
For Ethereum Name Service (ENSUSDT) we have mainly two targets, these are conservative targets and the ones to aim for. The market can certainly move higher especially long-term, but we focus on these two targets and we adapt as the bullish cycle unfolds.
ENSUSDT can find esistance around $10 as part of the recovery process, not the full recovery. This target can be ignored in favor of higher growth. Next comes $15.2 and this is the first level that is of relevance, much higher is still possible though.
A good level sits at $22 (first target). This price would cover much of the C wave from the late 2024 to Feb 2026 ABC correction. Once ENS reaches $22, all the loses all the way back to September 2025 would be recovered, but this wouldn't be all.
The main resistance is the December 2024 high that needs to be challenged around $50. Based on Fibonacci numbers, a target sits just below at $49 (second target). This is the main level on the move that is turning green just now. The move is turning green now but it started February 2026.
After the main target, $49, there can be a long pause or strong correction. It can happen sooner. If it happens here, then we can expect easily 1-2 months of a pause or consolidation, or a three months long correction. After this period, higher is possible and even a new all-time high long-term.
This is all assuming that the Cryptocurrency market will continue to grow. And this is the only thing we know will happen for sure.
Thanks a lot for your continued support. There is no stopping the market force. Up-we-go.
Namaste.
ELong
ENS Squeezing Into Major Resistance – Decision Zone AheadENS is moving inside a broad range with a descending top trendline, and recently formed a short-term ascending channel pushing price upward. Now that local structure is running straight into macro resistance, which is the key point here.
What’s happening:
Price respected the range low (~5.3–5.4) multiple times
Built a higher low structure → short-term bullish pressure
But now it’s hitting the descending trendline + horizontal resistance (~6.2–6.5)
So this is a classic trendline compression against HTF resistance.
Quick view on the USD and goldThe most important point right now is this: global news is affecting the USD and gold through four main channels — geopolitical tension, oil prices, inflation expectations, and the Fed’s interest-rate decisions. In other words, the market is not reacting only to “war headlines”; it reacts even more strongly to whether those headlines push oil higher, lift inflation, and force the Fed to keep rates higher for longer. Source Source
When the Middle East heats up, the USD often strengthens first, while gold does not always rise
On April 22, Reuters showed that the U.S. dollar rose as markets worried that the U.S.–Iran conflict could drag on and that risks around the Strait of Hormuz remained elevated. The dollar index climbed to 98.58, while markets increasingly believed that the Fed would not cut rates soon because the conflict could push energy prices and inflation higher. Source
This is where many people misunderstand the market: war does not automatically send gold higher immediately. If conflict strengthens the dollar and pushes U.S. Treasury yields up, gold can fall because it is a non-yielding asset. Reuters reported on April 21 that spot gold dropped 2.2% to $4,712.04/ounce, while the dollar rose and the U.S. 10-year Treasury yield moved higher. Source
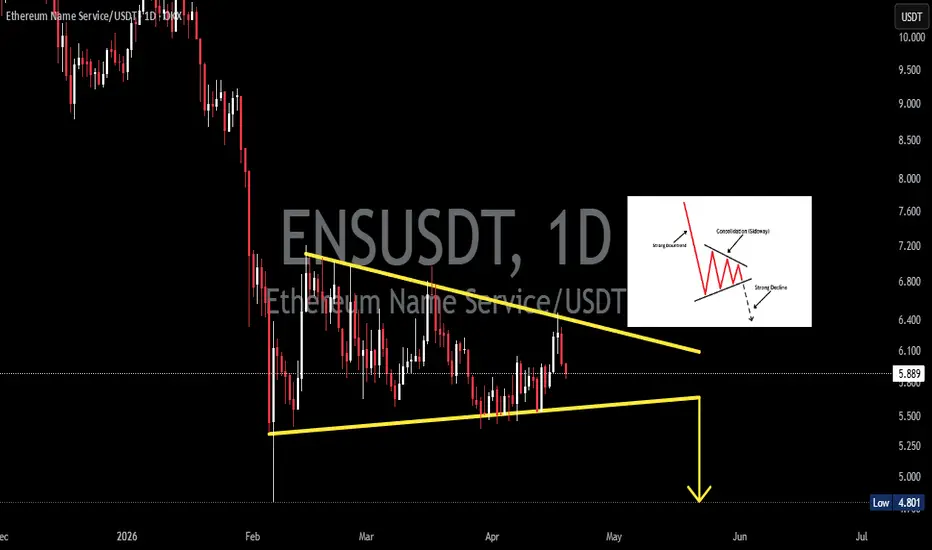
ENSUSDT Forms a Perfect Bearish Pennant – Strong Decline?The ENSUSDT daily chart clearly displays a classic and clean Bearish Pennant pattern. This pattern formed after:
- Strong Downtrend (Flagpole): A sharp and vertical decline from above 10,000 USDT down to the 5,500–5,800 zone in late February to early March 2026.
- Consolidation Phase (Pennant): After the strong flagpole, price entered a sideways consolidation with a gradually narrowing range. The two yellow trendlines drawn on the chart illustrate:
- Descending upper trendline (resistance) showing continued bearish pressure.
- Slightly ascending lower trendline (support) indicating weakening bullish attempts.
These two lines converge to form a symmetrical triangle (pennant), which is characteristic of this pattern.
A Bearish Pennant is a high-probability continuation pattern. It signals that after a brief pause in consolidation, price is likely to resume the previous trend direction — in this case, a Strong Decline.
The chart features a bold yellow arrow pointing downward, indicating the expected breakout to the downside. The critical level right now is around 5,892 (the dashed horizontal line). A daily candle close below this level with increasing volume would confirm the pattern activation.
Full Explanation of the Bearish Pennant Pattern
Bearish Pennant = Strong Downtrend Flagpole + Symmetrical Triangle Consolidation (Pennant) + Breakdown.
This pattern is highly reliable in crypto markets because it shows that sellers remain dominant — they are simply taking a short “breather” before continuing to sell. The downside target is typically measured by projecting the height of the flagpole downward from the breakdown point.
Bearish Scenario (Highest Probability)
- Price breaks down below 5,892 with rising volume.
- First target: 4,801 (the recorded Low).
- Extended targets: Potentially much lower (4,000–4,500 zone) as the overall downtrend remains intact.
- Stop Loss: Above the upper pennant trendline (around 6,200–6,400).
- Projected timeframe: 1–4 weeks ahead (May–June 2026).
Bullish Scenario (Pattern Invalidation – Low Probability)
- Price breaks out upward above the upper pennant trendline with a strong bullish candle and high volume.
- In this case, the pennant pattern would be invalidated, and price could rebound toward 6,800–7,200 (next resistance area).
- However, as long as price remains inside the pennant and the primary trend stays bearish, this scenario is unlikely.
Conclusion
This chart is strongly bearish. The perfectly formed Bearish Pennant combined with the clear decline arrow suggests sellers are still in control. As long as price does not break above the pennant, the bias remains Strong Decline. Traders should wait for confirmation of a breakdown below 5,892 before considering short entries.
#ENSUSDT #BearishPennant #CryptoAnalysis #ENS #EthereumNameService #BearishContinuation #CryptoChart #PennantPattern #Altcoin #TechnicalAnalysis #CryptoTrading #BearMarket #ENSPricePrediction
$ENS Just Lost A Critical Level And Nobody Is Talking About It.NYSE:ENS Just Lost A Critical Level And Nobody Is Talking About It.
Here's What The Chart Is Telling Me:
Trendline Support → Lost ❌
Bounce Attempt → Weak And Rejected ❌
Resistance → Holding Strong ❌
Buyer Momentum → Non-Existent ❌
$5.8 Was The Level To Hold. It's Not Holding. Next Downside Target: $3.43
Short Setup:
Entry: Below $5.8
SL: Above $6.10
TP: $4/$3.43
When A Bounce Can't Even Break Resistance... That's Not A Recovery. That's A Dead Cat Bounce.
Sellers Are In Full Control. Respect The Structure.
TA Only. Not Financial Advice. ALWAYS DYOR.
ENS is following a bearish structure (2H)We have a bearish CH after the formation of a swing high (SWH), followed by a well-respected bearish structure with multiple bearish BOS.
A large liquidity pool has formed below the current price for some time, and it is expected to be taken soon, leading to further downside.
We are looking for sell/short positions in the supply zone using a DCA approach.
Targets are marked on the chart.
A daily candle close above the invalidation level will invalidate this analysis.
If you would like us to analyze a coin or altcoin for you, first like this post, then comment the name of your altcoin below.
What is your opinion about ENS?
ENS: pullback or bounce? key levels to watch this weekENS
Anyone else watching ENS bleed back after that sharp run up? According to market chatter, interest in naming and identity plays picked up again with the latest crypto rotation, but today buyers clearly stepped aside and price reacted instantly. That makes this pullback pretty important: are we just cooling off, or is this the start of a deeper flush into the old demand zone?
On the 4H chart, price is rolling over from a red supply block with RSI dropping out of overbought, so I lean short term bearish. I’m watching the low volume “air pocket” under current price – if sellers keep pressing, the path of least resistance is down into the green demand area around the mid 5s, where we previously saw strong bids. With sentiment still broadly positive for ENS fundamentals, I see this more as a potential dip zone than a full trend break.
My base plan: I let it drift lower toward that green support, then look for a bounce setup with clear wicks and RSI curling up ✅. If bulls defend there, I’m hunting a move back toward the red supply zone above, where I’d start taking profit. If that green block snaps and we close 4H candles below it, the idea is invalid for me and I’d step aside – I might be wrong, but I’m not arguing with a clean breakdown.
ENS: dip to buy or trap? key levels to watch in the next daysENS. Dip to buy or trap before a bigger flush? Identity tokens have been in the spotlight again, and according to the market, the latest buzz around Ethereum ecosystem upgrades briefly pumped ENS, but the hype faded fast and price stalled right under local resistance.
On the 4H chart we’re stuck below a fat supply zone around 6.8–7 that already rejected the last spike. RSI is under 50 after a clear cool‑off from overbought, and VPVR shows the main volume node above current price, so bounces look more like exits than fresh longs. I’m leaning to the downside, expecting a sweep of the low‑volume pocket toward 6.1–5.8 in the next moves.
My play here: if we retest 6.8–7 with weak volume and wicky candles, I like shorts with targets at 6.1 first, then 5.8, and a hard stop above 7.2. If bulls break and hold 7.2, that kills the short idea and opens the door to a squeeze toward the 8.5–9 zone. I might be wrong, but for now I’d rather sell the rip than marry the narrative ✅
1. ENS Futures Squeeze Fires but Spot Stays Quiet
ENS Futures Squeeze Fires but Spot Stays Quiet — Trap or Trigger
ENS
Overview
ENS is printing 1.2286 with futures at 1.2241, showing a moderate bull reading at 27.92% intensity. Bulls hold 64% of signals against 36% bears with 42% clarity. The surface looks constructive, but underneath there is a critical divergence. A squeeze has fired on futures only, not on spot. That is a trap signature. Combine that with leverage sitting at the 98th percentile and spot volume running quiet, and this setup demands caution despite the bullish lean.
Price Context
Spot at 1.2286 against futures at 1.2241. Retrace is -0.8% with a 1.4% bounce at 1.8x in recovery mode. The bounce multiple is modest and the recovery tag means price is attempting to reclaim lost ground rather than breaking new territory. This is not a fresh impulse — it is a market trying to heal.
Bias
The multi-timeframe count reads 31 bull against 16 bear out of 112 signals. EMA structure favors bulls at 5 to 0. Candle structure is bullish at 7 to 5. Ichimoku TK is nearly balanced at 6 to 6, which is notable — the one indicator that typically confirms trend is sitting on the fence. Spread conviction at 31.9% is low. Pattern totals read 2 to 0 bullish with a star candle and a three soldiers signal adding weight. The count favors bulls but the conviction behind it is thin.
Volume Intelligence
Spot Z-score is -0.55, quiet. Futures Z-score is 0.57, active. Combined is also 0.57, active. The classification is normal with direct flow reading neutral. This tells you futures are doing the work while spot sits on the sideline.
The futures to spot ratio is 6.79x, elevated. Raw spot volume is 15.99M against 108.54M futures, or 19.64M against 133.36M in dollar terms. This ratio is not in ghost market territory but it is leaning heavily toward futures-driven action.
OBV Z-score is 0.64 but flagged as outflow, and OBV divergence is normal. Volume momentum is 0.05 and rising. No whale activity and liquidation levels are clear.
Leverage
This is the section that matters most right now. Current leverage is 6.87x, elevated. But the percentile is 98.6%, at the ceiling. The all-time max was 22.49x and the minimum was 2.49x. The 50-bar range is tight between 6.86x and 6.9x. The 200-bar range stretches from 4.62x to 6.9x.
Leverage is not just high — it is historically maxed relative to recent ranges. When leverage percentile is at the ceiling, the risk of a liquidation cascade increases sharply. Any sudden move against the dominant positioning could trigger forced closures that amplify the move well beyond what the underlying order flow supports.
Premium
Premium reads -0.37%, backward at a Z-score of -0.4. Yield shows -401% APY at -0.4 sigma, still leaning slightly bullish. Standard deviation of premium is 0.131%, volatile on both lookbacks. Mean reversion Z is at 1.43 sigma and rising. The backward premium means futures are trading at a discount to spot, which often signals hedging activity or short positioning in derivatives. The rising mean reversion Z suggests this premium dislocation is getting stretched.
Squeeze
Here is the critical signal. Spot squeeze is not active. Futures squeeze has fired. Squeeze divergence between spot and futures is flagged as futures only trap. This means the volatility compression and expansion is happening exclusively in derivatives, not in the actual market. Spot momentum is in expansion at 0% with bandwidth at 1.76% and bullish momentum. The ceiling reading is 15.78 sigma.
When a squeeze fires on futures but not spot, it typically means leveraged traders are forcing a move that does not have real market backing. These setups frequently reverse once the squeeze energy is exhausted because there is no spot flow to sustain the direction.
Scenarios
Scenario 1 — Futures Squeeze Traps Longs and Reverses (45%). Leverage at the 98th percentile combined with a futures-only squeeze is the classic setup for a trap. The move extends just enough to pull in breakout traders before reversing as the squeeze energy fades and spot never confirms. Watch for the bull bear Z to deepen below -1.0 and spot volume to remain quiet.
Scenario 2 — Spot Confirms and Squeeze Becomes Legitimate (30%). If spot Z-score rises above 0.5 and the futures to spot ratio drops below 5x, the squeeze could transition from a trap to a real move. The 64% bull signal dominance and favorable EMA structure provide a foundation for this. Premium normalizing from backward would add confidence.
Scenario 3 — Leverage Unwind Without Direction (25%). At the 98th percentile, leverage can simply deflate through time decay and position closures without a dramatic move. Price chops sideways while open interest bleeds out. The low spread conviction at 31.9% supports this outcome.
Watch List
1. Spot Z-score moving above 0.5 to confirm real participation behind the squeeze
2. Futures to spot ratio dropping below 5x for healthy market backing
3. Leverage percentile declining from the 98.6% ceiling — direction of the decline matters
4. Squeeze divergence clearing from futures only trap to aligned
5. Premium Z-score normalizing toward zero from the current -0.4 backward reading
6. Bull bear Z recovering above -0.87 for momentum confirmation
7. OBV outflow reversing to inflow — currently contradicting the bullish price action
Risk
The combination of a futures-only fired squeeze and leverage at the 98th percentile is a high-risk configuration regardless of the bullish signal count. The squeeze divergence flag exists specifically to warn about this type of setup. Position sizing should be reduced and entries should require spot confirmation before committing. If trading this from the long side, tight stops are essential because a leverage unwind from these levels can move price faster than the underlying trend suggests. The bull case is real but it needs spot to show up, and right now spot is not in the room.
More analysis on my profile.
Tags: ENSUSDT, ENS, ethereum, crypto, squeeze, leverage, volumeanalysis, premium, tradingview
Trendline Broken | ENS Bulls in Control! (4H)The price is currently trading at a critical Key Level, which serves as an important support/resistance zone. This level is where major market decisions are likely to occur, and price reactions here could determine the next directional move.
On the chart, we have a bullish CH pattern forming, signaling buying pressure and the potential for further upward movement. Additionally, the main trendline has been broken, indicating that short-term bearish momentum may have ended and buyers are regaining control. This trendline break reinforces the bullish scenario.
Our strategy focuses on buy positions during pullbacks. In other words, we are looking for opportunities to enter near key support zones where the probability of continued upward movement is higher. Entries are planned using a DCA (Dollar-Cost Averaging) approach, meaning we will gradually build positions at multiple predefined levels to reduce risk and optimize the average entry price.
All targets and potential exit points are clearly marked on the chart for traders to manage risk and set stop-loss levels accordingly.
A critical note: a daily candle close below the invalidation level would invalidate this analysis, indicating that the bullish scenario has failed. Proper risk management and stop-loss placement are therefore essential in this setup.
Overall, the current market conditions present a potential opportunity for buy positions, provided the price reacts positively to key support levels and the invalidation scenario does not trigger.
If you have a coin or altcoin you want analyzed, first hit the like button and then comment its name so I can review it for you.
This is not a trade setup, as it has no precise stop-loss, stop, or target. I do not publish my trade setups here
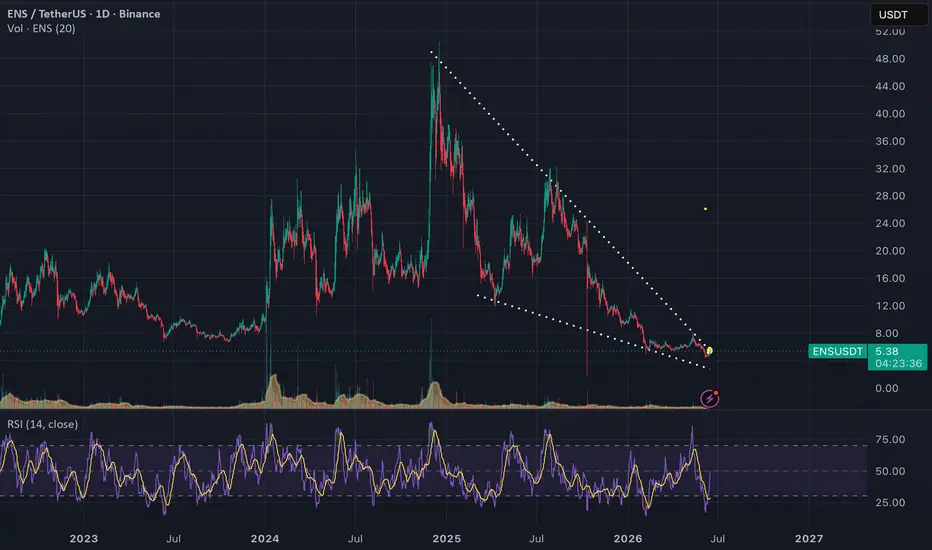
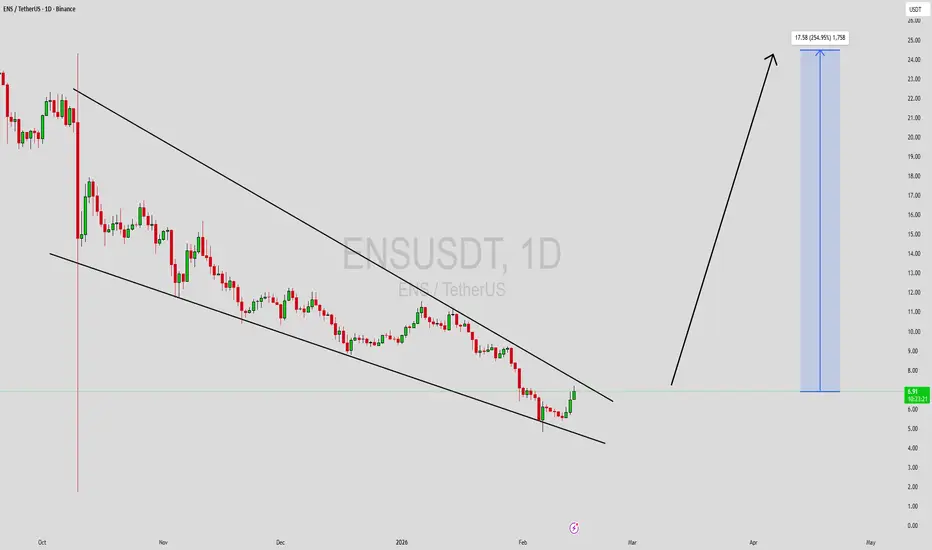
ENSUSDT Forming Falling WedgeENSUSDT is forming a clear falling wedge pattern, a classic bullish reversal signal that often indicates an upcoming breakout. The price has been consolidating within a narrowing range, suggesting that selling pressure is weakening while buyers are beginning to regain control. With consistent volume confirming accumulation at lower levels, the setup hints at a potential bullish breakout soon. The projected move could lead to an impressive gain of around 190% to 200% once the price breaks above the wedge resistance.
This falling wedge pattern is typically seen at the end of downtrends or corrective phases, and it represents a potential shift in market sentiment from bearish to bullish. Traders closely watching ENSUSDT are noting the strengthening momentum as it nears a breakout zone. The good trading volume adds confidence to this pattern, showing that market participants are positioning early in anticipation of a reversal.
Investors’ growing interest in ENSUSDT reflects rising confidence in the project’s long-term fundamentals and current technical strength. If the breakout confirms with sustained volume, this could mark the start of a fresh bullish leg. Traders might find this a valuable setup for medium-term gains, especially as the wedge pattern completes and buying momentum accelerates.
✅ Show your support by hitting the like button and
✅ Leaving a comment below! (What is your opinion about this Coin?)
Your feedback and engagement keep me inspired to share more insightful market analysis with you!
ENSUSDT – at Demand Zone, Reversal or Breakdown?ENS/USDT on the Weekly (1W) timeframe is currently in a medium-term downtrend after failing to hold the strong resistance area around 30–34. Selling pressure has continued, pushing price down toward a historical demand zone that previously acted as a strong accumulation area.
The highlighted yellow zone at 8.3 – 6.9 represents a major weekly demand, formed from a long consolidation base between mid-2023 and early-2024. This area is now a key decision zone for the next major move.
---
Price Structure & Trend
Market Structure: Lower High – Lower Low (bearish continuation)
Primary Trend: Bearish while price remains below 16.3 and 23.3
Volatility: High during distribution, decreasing as price approaches demand
The strong breakdown below mid-range supports confirms seller dominance, although selling momentum begins to slow near the weekly demand area.
---
Key Technical Levels
Resistance (Supply):
10.5 – minor resistance / breakdown level
13.1 – structural resistance
16.3 – key weekly resistance
23.3 – major supply zone
31.0 – large distribution area
Support (Demand):
8.3 – 6.9 (yellow zone) – major weekly demand
6.56 – weekly all-time low
---
Pattern Analysis
Descending market structure (bearish trend continuation)
Weekly distribution range between 23 – 31 prior to breakdown
Potential base formation / accumulation phase if price holds the 8.3 – 6.9 demand zone
A strong bullish reaction from this area could form a Weekly Higher Low, which would be an early reversal signal
No valid reversal pattern is confirmed yet without strong bullish weekly candle confirmation.
---
Bullish Scenario
The bullish scenario becomes valid if:
Price holds above the 8.3 – 6.9 demand zone
A bullish weekly rejection (long lower wick or bullish close) appears
Buying volume increases
Upside Targets:
10.5
13.1
16.3
Extension target if momentum strengthens: 23.3
This scenario suggests a re-accumulation phase after a prolonged correction.
---
Bearish Scenario
The bearish continuation scenario remains valid if:
A strong weekly close below 6.9 occurs
No meaningful buyer reaction appears at the demand zone
Implications:
Major support breakdown
Potential new lower lows / price discovery
Long-term bearish structure remains intact
In this case, long positions carry significantly higher risk without reversal confirmation.
---
Conclusion
ENS/USDT is currently trading at a critical weekly decision zone. The 8.3 – 6.9 area represents the last major demand that could trigger accumulation and reversal. Traders are advised to wait for clear weekly price action confirmation before making directional decisions.
#ENS #ENSUSDT #EthereumNameService #CryptoAnalysis #WeeklyChart #DemandZone #SupportResistance #BearishTrend #BullishReversal #AltcoinAnalysis
ENS/USDT at Critical Zone - Breakout or Continuation Downtrend?ENS/USDT on the Daily (1D) timeframe is still trading within a strong bearish trend, characterized by a clear structure of lower highs and lower lows. Since the previous peak, selling pressure has dominated the market, keeping price action firmly inside a well-defined descending structure.
Currently, price is moving around the mid–lower area of the channel, indicating a technical rebound rather than a confirmed trend reversal.
---
Pattern Explanation – Descending Channel
The primary pattern visible on this chart is a Descending Channel, which is commonly classified as a bearish continuation pattern.
Key characteristics observed:
The upper resistance line continues to press price lower, forming consistent lower highs.
The lower support line slopes downward, creating lower lows.
Price respects the channel structure with multiple reactions.
The channel’s median line acts as a dynamic support/resistance zone.
This pattern suggests that sellers remain in control, and as long as price stays inside the channel, the overall trend remains bearish.
---
Key Levels
Resistance Levels:
12.20 USDT (horizontal resistance & rejection zone)
14.75 USDT
16.60 USDT
19.50 USDT
21.80 USDT
Support Levels:
10.00 USDT (psychological & local support)
8.50 USDT
6.70 USDT (lower channel boundary & major support)
---
Bullish Scenario
The bullish scenario becomes valid only after a clear and confirmed breakout.
Bullish confirmation:
Daily candle closes above the upper boundary of the Descending Channel.
Market structure shifts into higher highs and higher lows.
Ideally supported by increasing volume.
Bullish targets (step-by-step):
12.20 USDT
14.75 USDT
16.60 USDT
19.50 USDT
A valid breakout from this channel may signal a trend reversal from bearish to bullish.
---
Bearish Scenario
The bearish scenario remains the primary bias.
Bearish confirmation:
Price fails to break the channel resistance.
Strong rejection occurs near 12.20 USDT or the upper channel line.
Breakdown below short-term support.
Bearish targets:
10.00 USDT
8.50 USDT
6.70 USDT
As long as price remains inside the Descending Channel, any upward move is likely to be a lower high.
---
Conclusion
ENS/USDT continues to trade within a clear bearish structure, supported by a well-respected Descending Channel pattern. The recent upward movement appears to be a technical pullback, not a confirmed trend reversal.
Traders should wait for strong breakout confirmation before shifting bias to bullish.
---
#ENSUSDT #ENS #CryptoAnalysis #TechnicalAnalysis #DescendingChannel #BearishTrend #Altcoin #CryptoMarket #PriceAction