EPICUSDT: First Target Reached, Then Reality HitA while ago, the thesis on EPIC was simple:
"If it gets attention, it can move hard."
The approach was never to go all-in. The idea was to accumulate during weakness, take profits into strength, and treat EPIC as a high-risk speculative position rather than a core holding.
The market rewarded that approach.
• Accumulation opportunities appeared around $0.20-$0.30
• The inverse Head & Shoulders structure developed successfully
• The neckline breakout triggered
• Price surged above $1.00
• The first major target zone was reached
• Heavy distribution followed immediately afterward
Today, EPIC sits more than 60% below the local high, and the chart is entering an important decision zone.
What Happened?
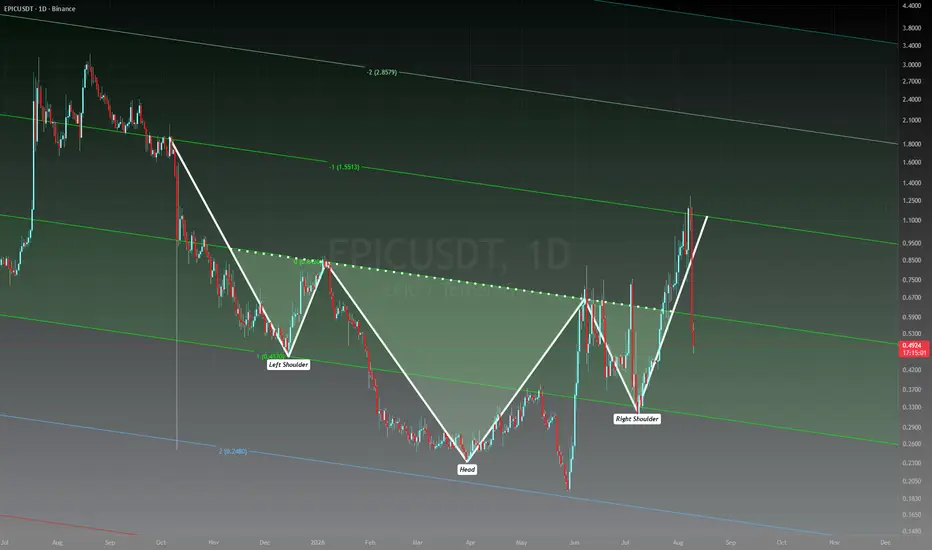
The daily chart formed a large inverse Head & Shoulders reversal pattern over several months.
• Left Shoulder near $0.45
• Head near $0.24
• Right Shoulder near $0.30
• Neckline around $0.65-$0.70
Once the neckline was broken, buyers stepped in aggressively and pushed price toward the first projected objective around the $1.10-$1.20 region.
That target zone was ultimately achieved.
From a technical standpoint, this is where many successful trades naturally come to an end. A pattern reaches its objective, early investors lock in gains, momentum traders begin taking profits, and fresh demand struggles to absorb supply.
That appears to be exactly what happened here.
The Market Delivered the Reward... Then Took Back the Euphoria
After reaching the target zone above $1.00, EPIC experienced an aggressive selloff.
In just a short period, more than 60% of the advance was erased.
While painful for late buyers, this behavior is not uncommon after explosive rallies.
Markets often reward patience during accumulation phases and punish emotional buying after a move becomes obvious.
Those who followed risk management plans had opportunities to realize substantial gains near target levels.
Those who entered after the breakout excitement are now facing the other side of volatility.
Current Technical Picture
Support Zone: $0.45-$0.50
This is currently the most important area on the chart.
There are several reasons why this region matters:
• Previous Left Shoulder formed here
• Historical buying activity is concentrated here
• Current market price is testing this area after the correction
As long as this zone remains intact, the larger bullish structure remains technically alive.
Secondary Support: $0.30-$0.35
If sellers break the current support area decisively, attention may shift toward the former Right Shoulder region.
This area would likely become the next major demand zone where buyers attempt to defend the broader recovery trend.
Resistance Zone: $0.75-$0.80
Any bounce from current levels will likely face resistance here.
This area previously acted as a breakout region and may now serve as the first significant obstacle for recovering bulls.
Major Resistance: $1.00-$1.20
The market has already identified this zone as a major supply area.
A future break above this region would signal that buyers have regained control and that the current correction may have merely been a pause within a larger trend.
Bullish Scenario
• Support around $0.45-$0.50 holds
• Selling pressure gradually weakens
• A higher low develops
• Buyers build a new accumulation range
• Price attempts a recovery toward $0.80 and eventually $1.00+
Bearish Scenario
• Current support fails
• Price loses the former Left Shoulder area
• Momentum shifts back to sellers
• EPIC revisits the $0.30-$0.35 region
• Extended consolidation becomes necessary before another meaningful advance
Final Thoughts
The original idea achieved its objective.
Accumulating during weakness and reducing exposure into strength proved far more effective than chasing momentum after the breakout.
The first chapter of this reversal story is now complete.
The target was reached.
The market celebrated.
Then the market corrected.
Now all eyes are on the $0.45-$0.50 region.
If bulls successfully defend this battlefield, EPIC may begin building the foundation for a second leg higher.
If not, a deeper reset may be required before the next major opportunity emerges.
As always, manage risk accordingly. Volatility works both ways.
In-depth trading ideas
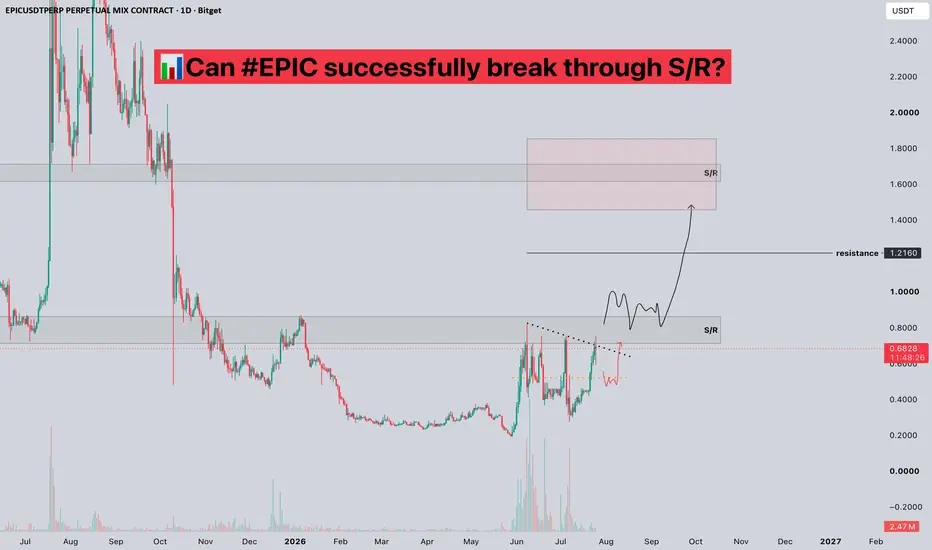
Can #EPIC successfully break through S/R?📊Can #EPIC successfully break through S/R?
🧠From a structural perspective, we are currently facing resistance near the S/R line, a densely packed area where multiple highs and lows have converged. If we can successfully break through this area, it will open up further upside potential.
➡️From a chart perspective, this appears to be forming a bullish flag pattern. Once a successful breakout is confirmed, a surge is highly probable!
🤜Follow me to stay informed about market changes. Remember to like💖 and share💬
BITGET:EPICUSDT.P
EPIC Chain — High Risk, High Reward Setup?I’ve been looking into EPIC lately and here’s my honest take — no hype, no shilling.
This is one of those coins that sits in a very uncomfortable zone…
👉 Either it’s a forgotten gem
👉 Or it slowly fades away
No middle ground here.
📉 First, the reality check
EPIC dropped from ~3.2$ to ~0.30$
That’s almost a 90% drawdown .
You don’t ignore that.
This kind of move usually means:
Hype is gone
Accumulation is starting
And right now… it’s not clear which one it is.
📊 Market position
We’re talking about ~10–15M market cap
That’s tiny when you compare it with:
ONDO → billions
LINK → billions
XLM → billions
So yes. EPIC is not a leader here and looks like a small bet in a big narrative (RWA).
🧩 But the idea itself?
Actually solid.
RWA (Real World Assets) is probably one of the biggest narratives going forward:
Tokenized assets
Real yield
Institutional interest
So the story is there. But story ≠ execution .
⚙️ So what is the problem hiding behind the curtain ?
Let’s be real:
When you go deep, adoption is weak; usage is limited and volume is not impressive .
It’s still early… or it’s just not catching on .
We don’t know yet.
📉 Technical view
Simple levels, nothing fancy:
0.20$ → major support
0.50$ → key breakout level
Right now price is just stuck in between.
🟡 If 0.50$ breaks → momentum comes back
🔴 If 0.20$ breaks → risk increases a lot
Until then?
👉 It’s just chopping.
🧠 My personal take
This is NOT a “safe investment ”. This is a speculative position. But also not complete trash. Why?
Low supply ✅
Small cap ✅
Strong narrative ✅
Which means:
👉 if it gets attention → it can move hard
🎯 if I play it, I wouldn’t go all-in here. What makes more sense to me:
Scale in around current levels
Add more near 0.25 / 0.20
Take profit around 0.50
Reduce risk heavily above 1$
Treat it like a high-risk side bet, not a core holding.
⚖️ Final thought
EPIC feels like one of those coins that:
⚡ rewards patience massively
or
🪦 disappears slowly
No guarantees here.
Just probabilities.
Curious to hear how others see it.
Would you take the risk here or stay with bigger RWA plays?
EPICUSDT Trading Strategy
Hello traders,
If you "follow" me, you’ll be able to get the latest updates faster.
Wishing everyone a great trading day.
***
EPIC is a project positioning itself around RWA (Real-World Asset Tokenization), entertainment, and AI-powered security & DRM solutions.
However, since the project has not yet been fully validated by the market, proper risk management remains essential.
***
The highest-probability trade setup is a breakout above the 0.8760–0.9546 resistance zone.
This area is currently acting as a major overhead supply zone, so the following conditions should be confirmed:
* Breakout above 0.9546
* Accompanied by strong volume
* Price holds above the breakout level
If all three conditions are met, the market may enter a strong trending phase.
In other words, the safest approach is a breakout entry after confirming a clean move through the 0.8760–0.9546 range.
***
## Key Levels to Watch
The strongest high-volume support zone is between 0.4230 and 0.5930.
As long as this area remains intact, the medium-to-long-term bullish scenario is still valid.
On the other hand, if 0.4230 breaks down, the current bullish structure could be compromised, making it better to stay on the sidelines.
***
## Short-Term Trend Analysis
Right now, the most important area is the 0.5372–0.7060 range.
A successful breakout and acceptance above this zone would open the door to the next target area of 0.7250–0.8760.
***
## Indicator Check
① Stoch RSI
Stoch RSI is currently in an overbought region, suggesting some short-term exhaustion.
However, if the market experiences:
* Sideways consolidation or a minor pullback
* Followed by renewed buying pressure
the indicator could quickly reset and provide room for another leg higher.
***
② OBV (On-Balance Volume)
OBV remains above its High Line and continues to trend higher.
This suggests that real buying pressure is flowing into the market.
At the moment, the ongoing price strength appears to be supported by solid accumulation reflected in OBV.
***
③ BSSC
As long as BSSC stays above the zero line, the bullish trend can be considered intact.
***
## Swing Long Strategy
For swing traders and medium-term investors:
### Entry Conditions
A more favorable setup would be:
* Price pulls back
* A rebound develops
* Support is confirmed within the 0.5372–0.7060 zone
The key point is that you should not blindly buy near 0.5372.
✅ What you want to see is:
Pullback → Rebound → Support Confirmation
before entering a position.
***
## Long Entry Checklist
Consider entering only when the following conditions align:
* Stoch RSI is not overbought
* OBV remains above the High Line
* BSSC stays above the zero line
* Price maintains its uptrend within the 0.5372–0.8760 range
From a risk/reward perspective, entries below 0.8760 offer a more attractive setup.
***
## Stop Loss & Risk Management
### Critical Support Level
If price breaks below 0.4230:
* Reassess the bullish thesis
* Avoid new long positions
* Shift into a wait-and-see mode
Once the lower boundary of a major volume profile is lost, it can turn into significant resistance, potentially delaying any meaningful recovery.
***
## Conclusion
### Bullish Scenario
* Support holds in the 0.5372–0.7060 zone
* Price breaks above 0.7250–0.8760
* Eventually clears 0.8760–0.9546 resistance
→ A strong bullish trend expansion becomes possible.
### Preferred Trading Plans
🥇 Breakout Trade
* Enter after a confirmed breakout above 0.8760–0.9546
🥈 Swing Long
* Enter on a pullback once support is confirmed within 0.5372–0.7060
### Invalidated Scenario
* Breakdown below 0.4230
* Stop trading the setup and remain sidelined
Ultimately, the key factor for EPIC is whether it can successfully break and hold above the 0.8760–0.9546 resistance zone.
If this resistance is cleared, the market could gain significant momentum and transition into a strong bullish trend.
***
Thank you for reading.
Wishing you profitable trades and successful risk management. 🚀📈
📌 Investment Disclaimer: This idea is for investment reference purposes only, and the final judgment and responsibility for investment lie solely with the investor.
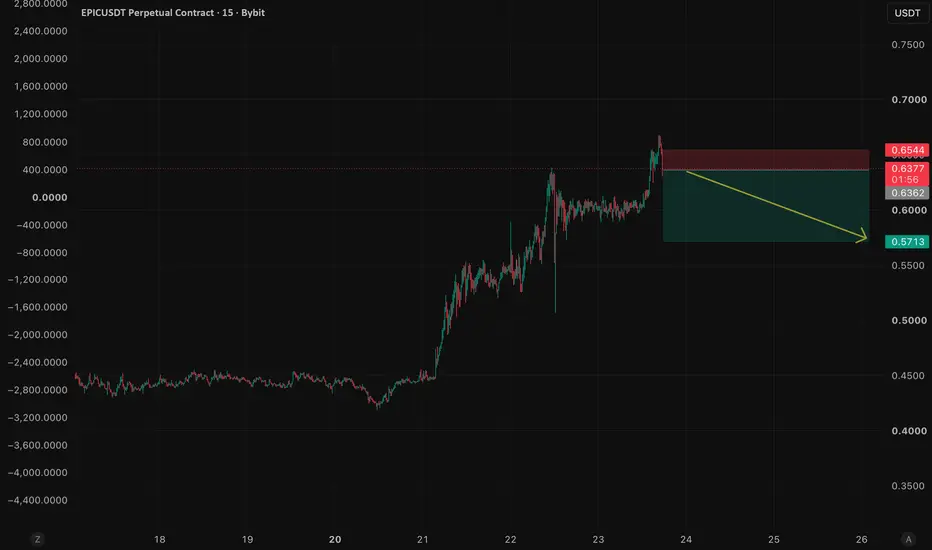
EPICUSDT: Bearish Breakdown Signals Further DownsideEPICUSDT remains under strong bearish pressure after failing to reclaim the resistance zone. The rejection from higher levels reinforces the prevailing downtrend, with sellers continuing to control the short-term market structure.
As long as 0.6544 holds as resistance, the bearish outlook remains intact. Sustained selling pressure could extend the decline toward 0.5713, while a decisive breakout above resistance would invalidate the current bearish setup.
Trade Setup
Entry: 0.6362
Target: 0.5713
Stop Loss: 0.6544
I'll wait for continued weakness below the resistance zone before expecting the next move lower. A confirmed break above 0.6544 would invalidate this bearish scenario.
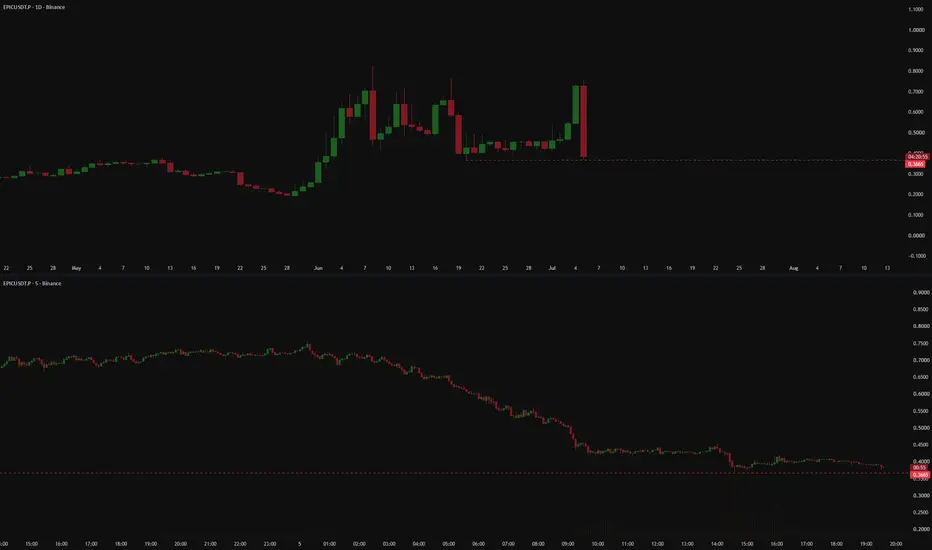
EPICUSDT.P: short setup from daily support at 0.3665BINANCE:EPICUSDT.P dropped sharply in a single day, and the fall stopped exactly at the level of a false breakout from a previous long consolidation. So, we take this level as a baseline. After all, the price doesn't hit the exact same spot days later for no reason.
The nature of the drop itself also says a lot: dropped hard, paused, dropped further, and now we are pausing again right above the level, having recently confirmed it. I expect a short here.
On the downside, we must consider that the asset has already moved a lot, and it might lack the strength to break the level. But if my entry point forms, I will try it anyway. Taking a stop loss here wouldn't be a big deal, because if the breakout happens, it could be strong enough to catch a 5 to 10 R trade.
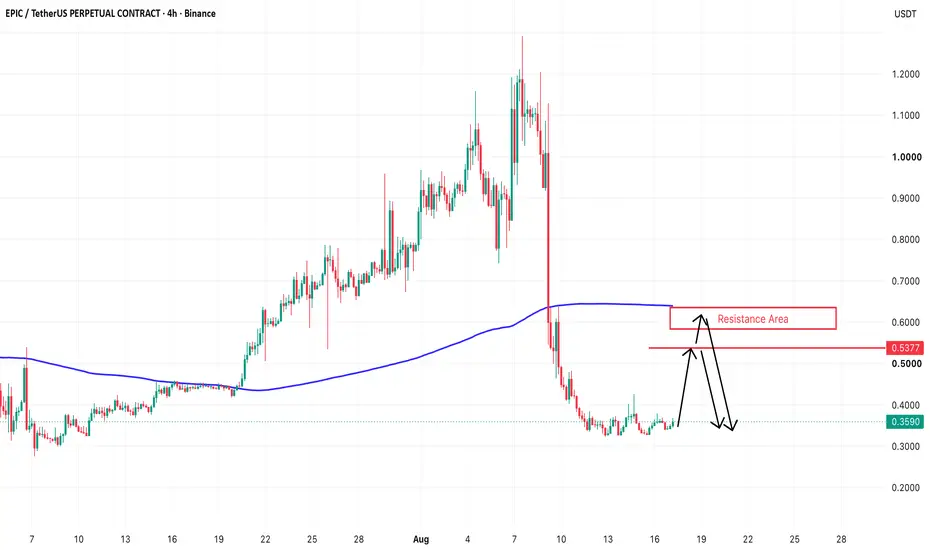
EPIC's Bullish Momentum Is Over (4H)Throughout its bullish trend, EPIC has never experienced a correction as significant as the recent one.
This deeper pullback suggests that strong sellers may have entered the market.
The bullish wave started from the point marked as "Start" on the chart. This initial wave can be considered Wave A, followed by an expected Wave B formation.
The red zone represents an area where the price may encounter bearish resistance and react to the downside.
Targets are marked on the chart. Consider moving your stop loss to breakeven once the first target is reached.
A daily candle close above the invalidation level will invalidate this analysis.
If you have a symbol you want analyzed, first hit the like button and then comment its name so I can review it for you.
Do you also think EPIC is bearish?
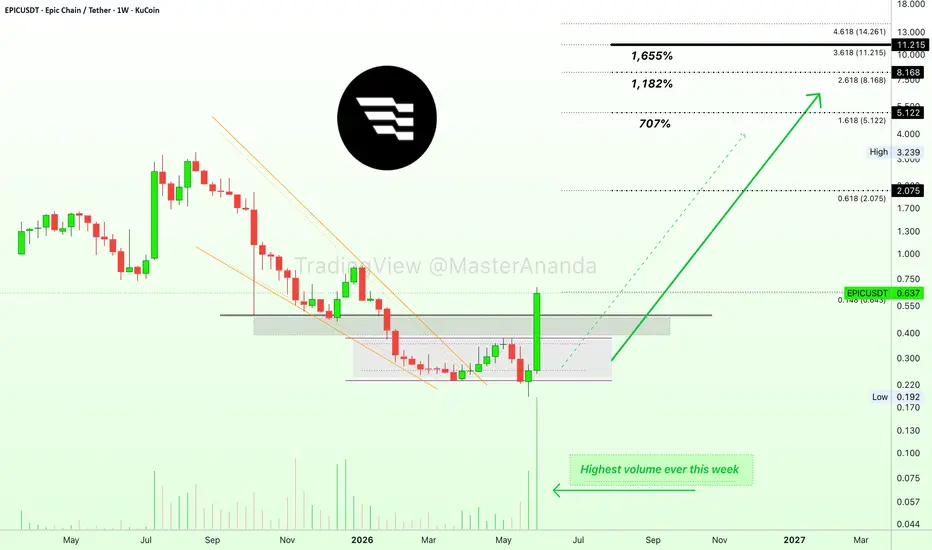
Epic Chain: The Cryptocurrency Will Grow, Make No MistakeEpic Chain (EPICUSDT) is up more than 250% in the past two weeks, recovering above the October 2025 low coupled with the highest volume ever. We can easily say that a bottom recovery is now complete and a new uptrend can be expected to form on this chart... And, I am still wondering, will just a few projects move while the rest of the market crashes?
Why are some projects moving while others are not?
Yes, it is a big market, but there is still a bigger picture, a broader sentiment and cycle. These projects are revealing something that has been bubbling up behind the scenes. People want Crypto and want to see the market grow. Unfortunately, a few whales control the market and any type of organic growth gets nullified immediately, we must wait but here we have proof that something is happening.
A period of easy money is upon us and this will be just one of many factors that will support a very strong bullish market for Crypto, but there is more.
We know the cycles, we've been here many times before. 2024-2025 were bullish years; 2026 is a bear market year just as 2022 was a bear market year and 2018 was a bear market year, pretty simple. After 2026, we get sustained long-term growth. But it gets better.
After 2026 things will really speed up but it all starts this same year, maybe even this same month or, in the worst case scenario, in one or two months. But know, the best is yet come.
Namaste.
Epic Chain · I sold too early, what now? I want more...Very strong activity once this project hits bottom. This chart has a limited amount of data but I chose it because of the volume. Trading volume here seems really high and this reveals what is coming next. I think outstanding growth is possible.
EPICUSDT. The first Fibonacci extension level has been conquered. There is a full bottom and reversal process on the chart. By now, we all know how that works.
The last candle is a full green candle. It recovers the entire liquidity hunt event, conquers Fib. 0.382 and also EMA55 on the daily timeframe. All in one day. And volume has been rising for months, since 6-FEB.
That's it. These are easy signals, an easy chart and the next move easy to predict. A major advance. The start of a new bull market.
Now, the targets are limited on the chart, it shows only 120%. This project can grow at least 1,000% in the coming months. This chart here reveals the bottom process and with the bottom confirmed, the only place left to go is up.
This chart can work as a friendly reminder to buy and hold. Nothing more can be done. When prices are high, collect profits then find a new chart.
The most important part is securing profits. We tend to enter at the right time, buying now when prices are low. When the action starts, we hold and keep on holding waiting for more. This is a mistake.
It is better to secure a trade at 200% or 300% rather than waiting for 1,000% that might never come. Some people reach 900% profits and continue to wait for 1,010%, then the market turns and on day one prices are down 50%. So the 900% turns into 450% and then it is too late.
It also happens that we get stuck and keep holding forever. The bullish wave comes and goes, then comes the bearish wave and nothing happens. Buy and hold now, but later you have to sell when prices are up.
I will be here reminding you but it is better to be mentally prepared. You can write on your digital device or you can use paper. It is a mental exercise. If you can visualize yourself taking profits, you will be happy with the results. If you cannot decide to take profits at some point, then you will keep on holding to never take action. It might sound innocent but that is greed. "But what if it keeps on rising?" That's greed. We don't know. We don't know how high prices are going to go, so we have to make a choice. If it keeps on rising, good; take the profits, be grateful and move on. Opportunities are endless anyways. You cannot feel bad for securing a win on a trade. When the market is bearish, we are happy even with 20-30%. When the market turns bullish, make sure to accept what the market gives you. There is no hurry and we grow step by step.
At first we might have to secure wins that aren't the best possible, that's ok. Overtime, we gain confidence and experience and this will allow for better results.
You should be able to value $100 to be able to collect $10,000. You have to appreciate and accept the value of $10,000 to secure $1,000,000 and so on. There is no hurry, we go step by step. The market is young and is here to stay.
Thank you for reading.
Namaste.
HEIUSDT Forming Bullish MomentumHEIUSDT is forming a clear bullish momentum pattern, a classic bullish wave signal that often indicates an upcoming breakout. The price has been consolidating within a narrowing range, suggesting that selling pressure is weakening while buyers are beginning to regain control. With consistent volume confirming accumulation at lower levels, the setup hints at a potential bullish breakout soon. The projected move could lead to an impressive gain of around 140% to 150% once the price breaks above the key resistance zone.
This bullish momentum pattern is typically seen at the end of downtrends or corrective phases, and it represents a potential shift in market sentiment from bearish to bullish. Traders closely watching HEIUSDT are noting the strengthening momentum as it approaches a critical breakout area. The healthy trading volume adds confidence to this setup, indicating that market participants may be positioning themselves early in anticipation of a strong upward move.
Investors’ growing interest in HEIUSDT reflects increasing confidence in the project’s long-term potential and current technical strength. As accumulation continues and bullish pressure builds, the probability of a breakout becomes more significant. If the breakout is confirmed with sustained volume, it could signal the beginning of a powerful new bullish trend.
Traders may find this setup particularly attractive for medium-term opportunities, especially as the pattern matures and buying momentum continues to strengthen. A successful breakout could unlock substantial upside potential, making HEIUSDT a coin worth keeping on the watchlist in the coming sessions.
✅ Show your support by hitting the like button!
✅ Leave a comment below! (What is your opinion about this coin?)
Your feedback and engagement keep me inspired to share more insightful market analysis with you! 📈🚀
EPICUSDT - Descending Channel? A Strong Bounce, Major Reversal?Based on the chart, EPICUSDT is still trading within a Descending Channel that has been developing since August 2025. This structure reflects a consistent downtrend characterized by a series of Lower Highs (LH) and Lower Lows (LL).
⚠️ However, recent price action shows a strong reaction from the lower support boundary of the channel, triggering a significant bounce. Price is currently testing the dynamic resistance represented by the upper channel trendline (red line), which will likely determine the next major move.
━━━━━━━━━━━━━━━━━━
🔍 Pattern Formation: Descending Channel
📉 A Descending Channel is a technical pattern formed when price moves between two parallel downward-sloping trendlines.
✨ Key Characteristics on This Chart:
✅ Lower Highs continue to form along the upper resistance trendline.
✅ Lower Lows are gradually developing near the lower support boundary.
✅ Price has recently bounced from channel support after reaching a low around 0.19 USDT.
✅ A bullish impulse move has emerged, indicating increasing buying interest at discounted levels.
📚 Pattern Interpretation:
🔸 As long as price remains inside the channel, the primary trend remains bearish.
🔸 A breakout above the channel would serve as an early signal of trend reversal.
🔸 The longer the channel develops, the stronger the potential move following a breakout.
━━━━━━━━━━━━━━━━━━
🟢 Bullish Scenario
For a bullish confirmation, price must break and hold above the channel resistance currently located around 0.33 – 0.36 USDT.
🎯 Bullish Targets:
🚀 Target 1: 0.360 USDT
🚀 Target 2: 0.475 USDT
🚀 Target 3: 0.650 USDT
🚀 Target 4: 0.850 USDT
🔥 If a breakout occurs with strong volume and candles close above the channel resistance, the medium-term bearish structure could be invalidated, opening the door for a stronger recovery phase.
💪 Bullish Supporting Factors:
✅ Strong rebound from the lower channel support.
✅ Bullish impulse formed after touching the recent low.
✅ Potential short-covering rally if channel resistance is successfully broken.
✅ Attractive risk-to-reward ratio due to price trading near historical support levels.
━━━━━━━━━━━━━━━━━━
🔴 Bearish Scenario
The bearish outlook remains valid as long as price fails to break above channel resistance.
⚠️ Bearish Confirmation:
❌ Strong rejection around the 0.33 – 0.36 USDT resistance zone.
❌ Price re-enters the channel and forms another Lower High.
❌ Buying volume begins to weaken after the recent bounce.
If rejection occurs, price could revisit the lower boundary of the channel.
🎯 Bearish Targets:
🔻 First Support: 0.240 USDT
🔻 Major Support: 0.190 USDT
⚠️ If the 0.190 USDT support level breaks, further downside risk may emerge since there is limited historical support below this area.
━━━━━━━━━━━━━━━━━━
📈 Conclusion
EPICUSDT is currently at a critical decision point after bouncing from the lower support of the Descending Channel. The 0.33 – 0.36 USDT resistance zone remains the key level that bulls must overcome to confirm a breakout and unlock upside potential toward 0.475 – 0.850 USDT.
📌 Until a confirmed breakout occurs, the market structure remains bearish in the medium term. Traders should closely monitor price action around the channel resistance trendline, as it will likely determine the next directional move.
💡 A breakout from the Descending Channel could signal the beginning of a trend reversal, while a rejection at resistance may bring renewed bearish pressure toward the channel's lower support zone.
━━━━━━━━━━━━━━━━━━
#EPICUSDT #EPIC #Crypto #Cryptocurrency #Altcoin #Binance #TradingView #TechnicalAnalysis #ChartAnalysis #PriceAction #DescendingChannel #Breakout #Bullish #Bearish #SupportAndResistance #Trendline #CryptoTrading #SwingTrading #AltcoinSeason #MarketAnalysis #CryptoSignals #RiskManagement #TradingSetup #BullRun #CryptoMarket
EPICUSDT Forming Falling WedgeEPICUSDT is forming a clear falling wedge pattern, a classic bullish wave signal that often indicates an upcoming breakout. The price has been consolidating within a narrowing range, suggesting that selling pressure is weakening while buyers are beginning to regain control. With consistent volume confirming accumulation at lower levels, the setup hints at a potential bullish breakout soon.
The projected move could lead to an impressive gain of around **190% to 200%** once the price breaks above the wedge resistance. This falling wedge pattern is typically seen at the end of downtrends or corrective phases, and it represents a potential shift in market sentiment from bearish to bullish.
Traders closely watching EPICUSDT are noting the strengthening momentum as it approaches a key breakout zone. Healthy trading volume adds confidence to this setup, showing that market participants are positioning early in anticipation of a potential reversal and a strong upward move.
Investors’ growing interest in EPICUSDT reflects increasing confidence in the project's long-term fundamentals and current technical strength. If the breakout confirms with sustained volume, this could mark the beginning of a powerful new bullish leg. Traders may find this a compelling setup for medium-term gains, especially as the falling wedge pattern nears completion and buying momentum continues to build.
With bullish sentiment gradually strengthening and accumulation remaining evident, EPICUSDT could emerge as a standout opportunity among traders seeking high-growth potential. A successful breakout above resistance may attract further market attention and pave the way for substantial upside expansion.
✅ Show your support by hitting the like button!
✅ Leave a comment below! (What is your opinion about this coin?)
Your feedback and engagement keep me inspired to share more insightful market analysis with you!
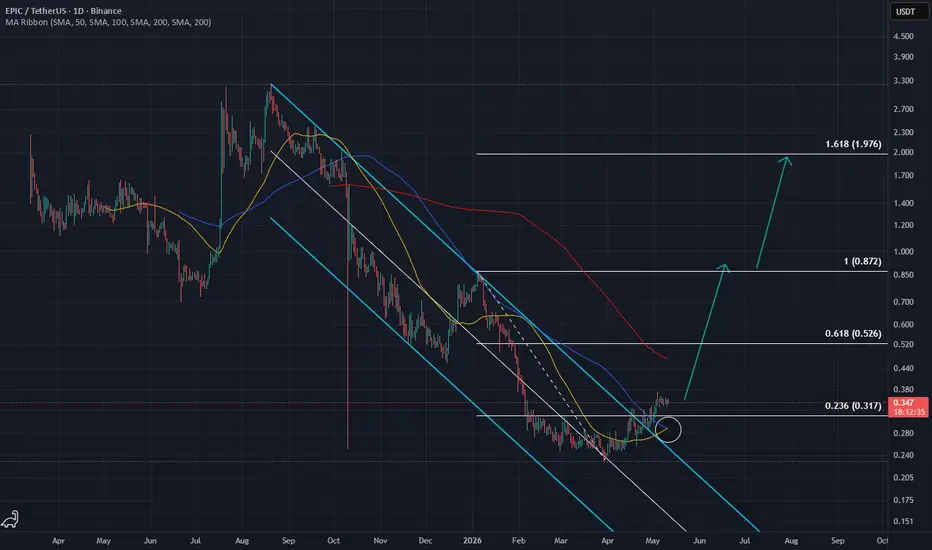
A beautiful intersection between the averages of this small coinThe chart clearly shows that the currency has broken out of its historical downward channel, meaning the decline is over. The upcoming downward waves are merely corrective, aimed at adjusting the indicators from overbought conditions.
The currency is currently crossing its 50-day moving average with the 100-day moving average. This indicates that momentum is inevitable. A drop to 32 cents is possible now before the upward movement.
This is a very, very small currency—only 33 million coins.
We'll see it reach double digits soon.
EPIC/USDT — Rebound or Further Breakdown?The EPIC/USDT 2D timeframe chart shows a clear strong downtrend structure formed since its previous peak. Price continues to move below a descending trendline (yellow line), indicating that sellers are still in control.
Currently, price is testing a key dynamic resistance (trendline) along with horizontal resistance around 0.31 – 0.33.
---
📉 Pattern: Descending Trendline (Bearish Structure)
Main pattern: Descending Trendline
Characteristics:
Consistent Lower Highs
Continuous Lower Lows
Repeated rejections at the trendline
This confirms that every upward move is still considered a pullback within a downtrend.
However, there are early signs of:
Small base / accumulation forming around the lows (0.23 – 0.28)
Potential early reversal if a breakout occurs
---
📌 Key Levels
Resistance:
0.33 (nearest resistance & current rejection zone)
0.47
0.55
0.65
0.75 – 0.85 (strong supply zone)
Support:
0.28
0.23 (major low / strong demand zone)
---
🚀 Bullish Scenario
Bullish momentum is valid only if price achieves a convincing breakout above both the trendline and 0.33 resistance.
Confirmation:
Break & close above 0.33
Successful retest (turning resistance into support)
Upside Targets:
1. 0.47
2. 0.55
3. 0.65
4. 0.75 – 0.85 (major resistance zone)
Narrative: A breakout could signal the beginning of a trend reversal or at least a strong relief rally after a prolonged downtrend.
---
🐻 Bearish Scenario
If price fails to break out and gets rejected at the trendline:
Confirmation:
Strong rejection around 0.31–0.33
Breakdown below minor support
Downside Targets:
1. 0.28
2. 0.23 (previous low)
3. If broken → potential continuation to new lows
Narrative: This would confirm a bearish continuation, where the current upward move is merely a dead cat bounce / pullback.
---
⚠️ Conclusion
Primary trend: Bearish
Price is at a critical decision zone
Breakout = potential reversal
Rejection = continuation of the downtrend
This is a key moment between a structure break or further downside continuation.
#EPICUSDT #CryptoAnalysis #TechnicalAnalysis #TradingView #Altcoin #BearishTrend #BullishBreakout #SupportResistance #Trendline #CryptoTrading #PriceAction #MarketStructure
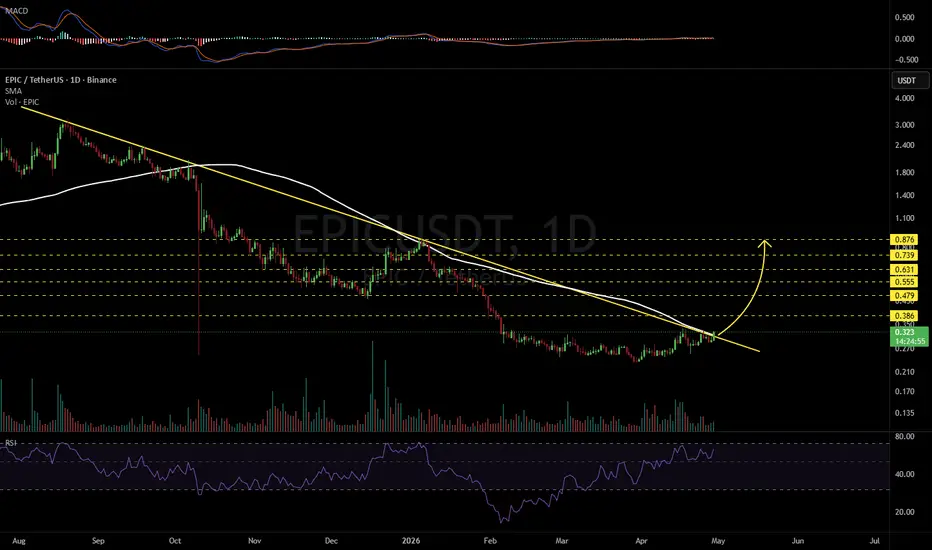
EPICUSDT 1D#EPIC is breaking out above the descending resistance and the daily SMA100. If the daily candle closes above these levels, we could reach the following targets:
🎯 $0.386
🎯 $0.479
🎯 $0.555
🎯 $0.631
🎯 $0.739
🎯 $0.876
⚠️ Always remember to use a tight stop-loss and maintain proper risk management.
EPICUSDT Forming Falling WedgeEPICUSDT is forming a clear falling wedge pattern, a classic bullish reversal signal that often indicates an upcoming breakout. The price has been consolidating within a narrowing range, suggesting that selling pressure is weakening while buyers are beginning to regain control. With consistent volume confirming accumulation at lower levels, the setup hints at a potential bullish breakout soon. The projected move could lead to an impressive gain of around 90% to 100% once the price breaks above the wedge resistance.
This falling wedge pattern is typically seen at the end of downtrends or corrective phases, and it represents a potential shift in market sentiment from bearish to bullish. Traders closely watching EPICUSDT are noting the strengthening momentum as it nears a breakout zone. The good trading volume adds confidence to this pattern, showing that market participants are positioning early in anticipation of a reversal.
Investors’ growing interest in EPICUSDT reflects rising confidence in the project’s long-term fundamentals and current technical strength. If the breakout confirms with sustained volume, this could mark the start of a fresh bullish leg. Traders might find this a valuable setup for medium-term gains, especially as the wedge pattern completes and buying momentum accelerates.
✅ Show your support by hitting the like button and
✅ Leaving a comment below! (What is your opinion about this Coin?)
Your feedback and engagement keep me inspired to share more insightful market analysis with you!
Up to 400% on EPICThe market remains extremely low–volatility for now, but we are gradually approaching the strongest seasonal growth cycle of the year - April. Starting next week, the probability of large growth waves for individual coins will begin to increase. Against this background, you can make additional purchases using coins. To date, EPIC has come to extremely strong long-term support and a reversal is already forming. A hike below 0.250 is highly unlikely due to full emissions. In the nearest wave, you can count on a retest of 0.750, and in the event of a breakdown above it, there is a chance of going straight to 1.5.
TURTLE SHELL BMT VIC MITO NFP also has the greatest potential today. There is a high probability of large exit pumps on NTRN and HOOK, which unfortunately will be delisted, despite the fact that the projects are quite new.
EPICUSDT UPDATE#EPIC
UPDATE
EPIC Technical Setup
Pattern: Falling Wedge Pattern
Current Price: $0.707
Target Price: $1.438
Target % Gain: 220.66%
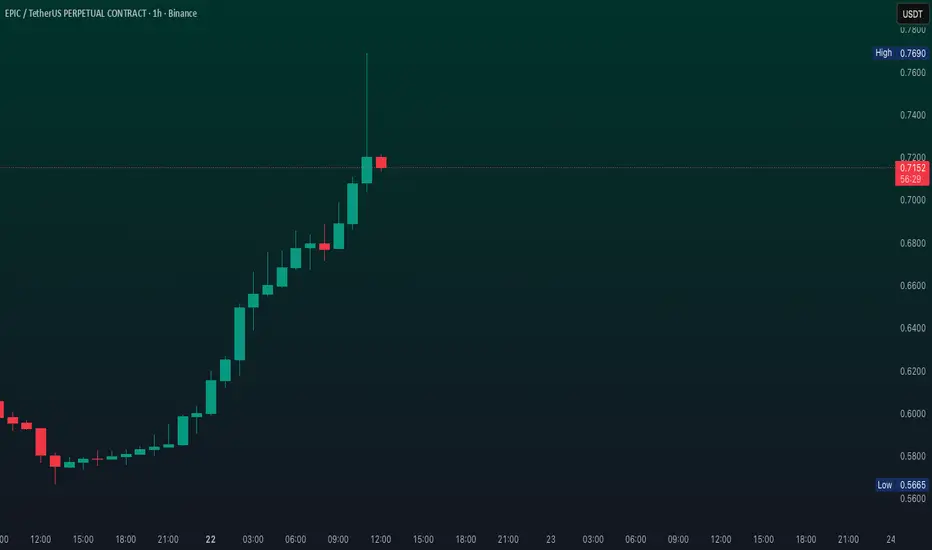
Technical Analysis: EPIC is breaking out of a falling wedge pattern on the 1D chart, indicating strong bullish potential. The price has recently surged above the resistance trendline, supported by an increase in volume. This setup is validated as the price approaches key resistance levels.
Time Frame: 1D
Risk Management Tip: Always use proper risk management.
EPIC READY FOR LEGENDARY PLAYFortune AI Quant has detected upcoming potential in EPIC, with technicals looking bullish here.
$1.25M buyback (Nov 2025) bolsters liquidity for holders as RWA scales, plus fiat pairs rollout in Asia/West for bank-to-token ramps targeting 1B+ users. RWA superstructure expands tokenizing real estate/credit/commodities with compliance tools and deeper XRP Ledger ties. Solid execution pending
EPICUSDT Forming Falling WedgeEPICUSDT is forming a clear falling wedge pattern, a classic bullish reversal signal that often indicates an upcoming breakout. The price has been consolidating within a narrowing range, suggesting that selling pressure is weakening while buyers are beginning to regain control. With consistent volume confirming accumulation at lower levels, the setup hints at a potential bullish breakout soon. The projected move could lead to an impressive gain of around 140% to 150% once the price breaks above the wedge resistance.
This falling wedge pattern is typically seen at the end of downtrends or corrective phases, and it represents a potential shift in market sentiment from bearish to bullish. Traders closely watching EPICUSDT are noting the strengthening momentum as it nears a breakout zone. The good trading volume adds confidence to this pattern, showing that market participants are positioning early in anticipation of a reversal.
Investors’ growing interest in EPICUSDT reflects rising confidence in the project’s long-term fundamentals and current technical strength. If the breakout confirms with sustained volume, this could mark the start of a fresh bullish leg. Traders might find this a valuable setup for medium-term gains, especially as the wedge pattern completes and buying momentum accelerates.
✅ Show your support by hitting the like button and
✅ Leaving a comment below! (What is your opinion about this Coin?)
Your feedback and engagement keep me inspired to share more insightful market analysis with you!