Caldera [ERA] AnalysisCaldera is still moving inside a clear downtrend, but early signs of a possible base are starting to show.
The main level to watch is the reclaim zone on the chart. It lines up with previous support, local resistance, and the lower edge of the larger volume profile value area. Until EURONEXT:ERA gets back above that zone, this is still a relief bounce attempt, not a confirmed reversal.
Momentum is improving. The Synergy Signal Oscillator is rotating up from a weaker zone, giving bulls a chance if price structure follows.
Bullish confirmation:
Reclaim the key horizontal level
Hold it as support
Push into the higher volume pocket
Form a higher low
Bearish risk:
Rejection at resistance
Loss of current consolidation
Continuation inside the descending trend
For now, EURONEXT:ERA is a recovery attempt inside a larger downtrend. The setup gets cleaner if price reclaims the marked level and holds it.
In-depth trading ideas
ERAUSDT Forming Bullish MomentumERAUSDT is forming a clear bullish momentum pattern, a classic bullish wave signal that often indicates an upcoming breakout. The price has been consolidating within a narrowing range, suggesting that selling pressure is weakening while buyers are beginning to regain control. With consistent volume confirming accumulation at lower levels, the setup hints at a potential bullish breakout soon. The projected move could lead to an impressive gain of around 90% to 100% once the price breaks above the wedge resistance.
This bullish momentum pattern is typically seen at the end of downtrends or corrective phases, and it represents a potential shift in market sentiment from bearish to bullish. Traders closely watching ERAUSDT are noting the strengthening momentum as it nears a breakout zone. Strong trading volume adds confidence to this pattern, showing that market participants are positioning early in anticipation of a reversal.
Investors’ growing interest in ERAUSDT reflects rising confidence in the project’s long-term fundamentals and current technical strength. If the breakout confirms with sustained volume, this could mark the start of a fresh bullish leg. Traders may find this a valuable setup for medium-term gains, especially as the pattern completes and buying momentum accelerates.
✅ Show your support by hitting the like button
✅ Leaving a comment below! (What is your opinion about this coin?)
Your feedback and engagement keep me inspired to share more insightful market analysis with you!
ERAUSDT UPDATEERAUSDT Technical Setup
Pattern: Falling Wedge Breakout
Current Price: $0.1560
Target Price: $0.2319
Target % Gain: 52.35%
Technical Analysis: ERAUSDT has broken out from a long-term falling wedge pattern on the 1D timeframe with a strong bullish candle and sharp momentum expansion. The breakout above the descending resistance trendline indicates increasing buyer strength, while the projected move suggests a potential rally toward the $0.2319 target zone if volume sustains.
Time Frame: 1D
#ERAUSDT #1D (Bitget Futures) Descending channel on support LONGCaldera just printed a morning star on daily with good bounce back volume, bottom seems likely.
⚡️⚡️ #ERA/USDT ⚡️⚡️
Exchanges: Bitget Futures
Signal Type: Regular (Long)
Leverage: Isolated (1.3X)
Amount: 4.8%
Current Price:
0.2508
Entry Zone:
0.2503 - 0.2187
Take-Profit Targets:
1) 0.3245
2) 0.3921
3) 0.4598
Stop Targets:
1) 0.1593
Published By: @Zblaba
EURONEXT:ERA BITGET:ERAUSDT.P #1D #Caldera #RaaS #Rollups #DeFi caldera.xyz
Risk/Reward= 1:1.2 | 1:2.1 | 1:3.0
Expected Profit= +49.9% | +87.4% | +124.9%
Possible Loss= -41.7%
Estimated Gaintime= 1-2 months
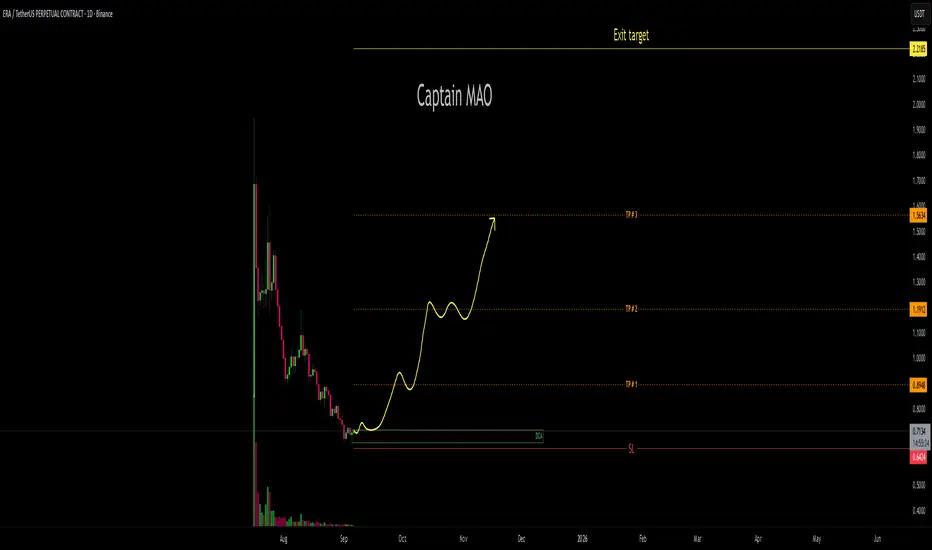
ERA/USDT – Base Support Formed & Reversal Setup
After a prolonged correction, ERA/USDT is finally showing signs of stability as price begins to form a solid base support. This consolidation zone is creating a favorable area for DCA entries inside the green box, offering excellent risk-to-reward positioning.
Price action is now signaling early signs of reversal, with buyers stepping in to defend support and gradually building bullish momentum. If this structure continues to hold, the next leg up could target the previous top, with an extended move potentially reaching the $2.0–$2.2 zone.
Unveiling the $ERA Reversal A Deep Dive into the Chart OpportuniBINANCE:ERAUSDT
Unveiling the EURONEXT:ERA Reversal: A Deep Dive into the Chart Opportunity
Price Action Description
Historical Trend: The price began around 1.20 USDT in late July, with initial choppy movement. A sharp decline in early August dropped it to 0.50-0.60 USDT, followed by a brief recovery to 0.80-1.00 USDT in mid-August. Another steep fall occurred in late August/early September.
Recent Movement: A massive red candlestick around September 1 marks a vertical drop from 1.00-1.10 USDT to 0.60-0.70 USDT, suggesting a capitulation event or flash crash. The price has stabilized around 0.682 USDT as of 11:03 PM CEST, with smaller candles indicating reduced volatility or exhaustion.
Current Price: Approximately 0.682 USDT, down 40-50% from July highs, hinting at potential oversold conditions.
Volatility: High, evident from long wicks and large candle bodies, especially during drops, though volume data is absent.
Key Technical Levels
Entry: Set at 0.6750 USDT, the suggested point to enter a long position, slightly below the current price of 0.682 USDT, anticipating a small pullback before confirming the trade.
TP (Take Profit): Targets are 0.7858 USDT for the first profit take, followed by 0.8727 USDT, 0.9338 USDT, and the highest goal at 1.1925 USDT, offering a range of exit points for potential gains.
DCA: Positioned at 0.6051 USDT, a level to add to the trade if the price drops further, helping to average down the entry cost.
SL (Stop Loss): Placed at 0.5342 USDT, the cutoff to exit the trade if the price falls, limiting losses and protecting the position.
Fibonacci Context: These levels appear derived from a downward Fibonacci extension (e.g., -0.618, -0.786) based on the recent drop from 1.20 to 0.50 USDT, suggesting a potential reversal zone. The setup implies a long trade anticipating a bounce.
Risk-Reward: Risk from 0.6750 to 0.5342 is 0.1408 USDT, with rewards to 0.7858 (0.1108, RR 0.8:1) and up to 1.1925 (0.5175, RR ~3.7:1), indicating a favorable setup if the reversal occurs.
Indicators Analysis
RSI (Relative Strength Index): Current value is 17.87, well below 30, signaling oversold conditions and a potential rebound. The line has trended down sharply with the price drop, showing waning momentum without visible bullish divergence yet. The RSI scale (0-100) marks overbought above 70, irrelevant here.
Potential Trading Implications and Risks
Bullish Case: The marked levels suggest a bottom-fishing opportunity post-crash, supported by oversold RSI. A rebound to take-profit levels is plausible if the broader crypto market stabilizes (e.g., Bitcoin trends) or if positive news emerges for ERA (e.g., gaming ecosystem updates).
Bearish Case: The dominant downtrend and recent sharp drop indicate strong selling pressure. Breaking below 0.6051 (DCA) or 0.5342 (SL) could lead to further declines toward 0.40-0.50 USDT.
Market Context: As of 11:03 PM CEST on September 1, 2025, check for recent events—token unlocks, hacks, or macro factors like interest rate changes affecting risk assets.
Risks: High altcoin volatility, lack of volume data (limiting liquidity insight), and subjective Fib levels. Use risk management (e.g., 1-2% account risk).
Suggestions: Confirm with bullish patterns (e.g., hammer or engulfing) at 0.6750 or RSI crossing above 30.
ERA : Risky but profitableHello friends🙌
Given the high that has been made and the price has returned, there is a possibility that the price will correct to the middle of the move, which is why we have provided two buying levels for you, which you can buy with risk and capital management and move towards the specified goals.
🔥Follow us for more signals🔥
*Trade safely with us*
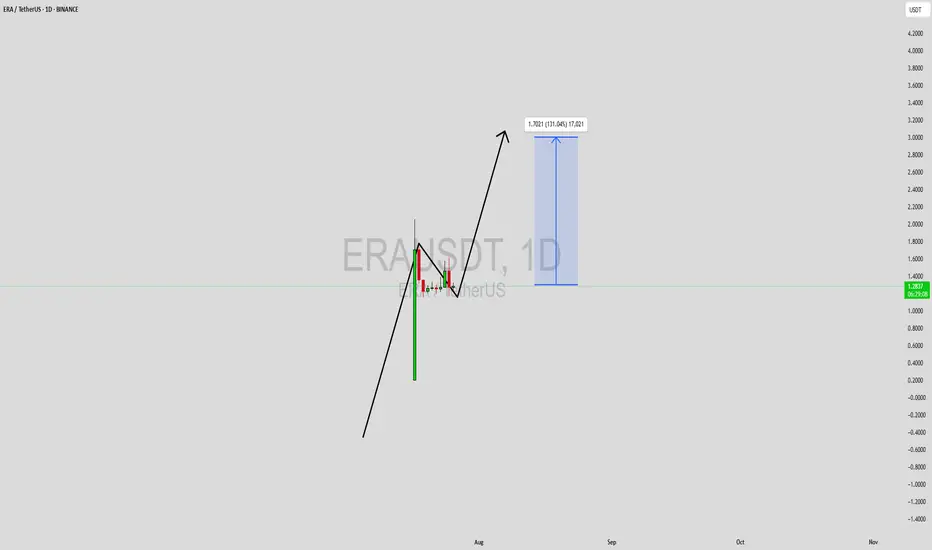
ERAUSDT Forming Bullish WaveERAUSDT is currently showcasing a strong bullish wave pattern, a powerful continuation signal that indicates the potential for significant upside momentum. This wave formation suggests that the recent corrective phase has completed, and the asset is preparing for the next impulsive leg upward. The market structure is aligning with common Elliott Wave principles, highlighting early accumulation followed by an expected breakout phase.
The trading volume around key support and resistance levels has remained healthy, confirming the strength of current price action. ERA’s steady volume profile supports the view that smart money may be positioning ahead of the next bullish breakout. Historically, bullish wave patterns combined with consistent volume inflows have led to sharp price accelerations, especially in altcoins with strong technical bases.
With an expected gain of 90% to 100%+, ERAUSDT appears well-positioned for a mid-term rally. Traders are closely watching this pair for confirmation of the breakout from its current structure. If the next wave holds and follows through on momentum, this coin could deliver significant returns for both swing traders and position holders. The technical outlook is further boosted by increased investor attention and social buzz surrounding the project.
This setup offers a favorable risk-reward ratio, especially if entries are managed with breakout confirmation and appropriate stop levels. As always, it's essential to monitor volume spikes and resistance reactions as the price moves upward.
✅ Show your support by hitting the like button and
✅ Leaving a comment below! (What is You opinion about this Coin)
Your feedback and engagement keep me inspired to share more insightful market analysis with you!
ERAUSDT Forming Bullish FlagERAUSDT has caught the attention of traders after a strong impulsive move that has laid the foundation for a possible continuation of its bullish trend. The current structure appears to be forming a classic bullish flag/pennant formation, a pattern often observed in strong uptrends, where price consolidates in a narrow range before breaking out higher. With volume supporting the recent breakout and price action showing resilience near consolidation support, this setup presents an exciting upside potential.
The projected gain of 90% to 100%+ aligns well with the technical structure seen on the chart, especially considering the momentum-driven environment ERAUSDT is trading in. As price continues to coil within a tight range, it builds the energy necessary for a decisive breakout. The bullish sentiment surrounding the ERA ecosystem, coupled with increasing interest from speculative and long-term investors, could be the fuel needed to push this pair into a significant rally.
Fundamentally, ERA is beginning to draw more eyes from across the crypto community, possibly due to developments or partnerships that are elevating its profile. This blend of technical readiness and rising investor interest makes it a coin to watch in the short to mid-term. If bullish confirmation holds, the next leg could be sharp and aggressive, potentially achieving or even exceeding the projected 100% target.
This is a moment where traders who rely on high-reward momentum setups could benefit by monitoring this pair closely. With risk well-defined below recent lows and the structure signaling strength, ERAUSDT deserves a spot on every active trader's radar.
✅ Show your support by hitting the like button and
✅ Leaving a comment below! (What is You opinion about this Coin)
Your feedback and engagement keep me inspired to share more insightful market analysis with you!
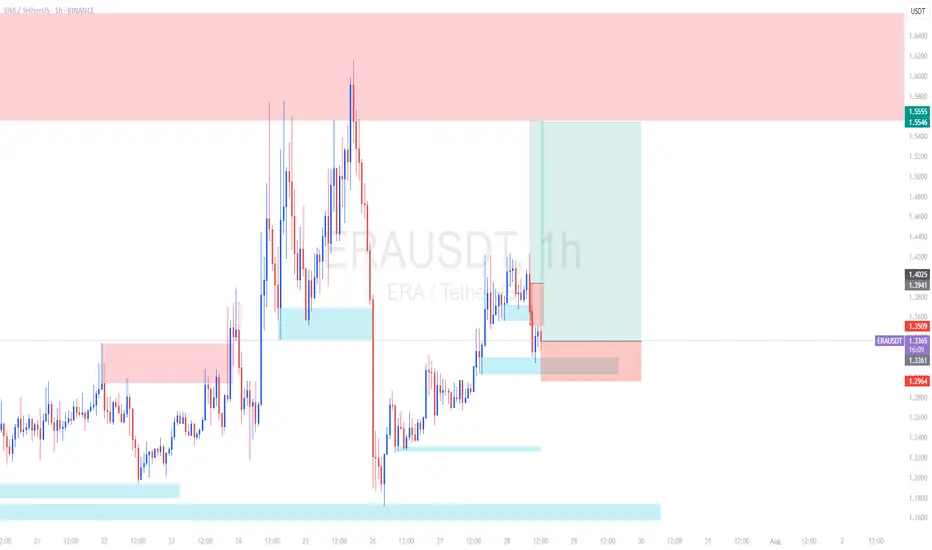
ERA/USDTKey Level Zone: 1.4050 - 1.4400
LMT v2.0 detected.
The setup looks promising—price previously trended upward with rising volume and momentum, then retested this zone cleanly. This presents an excellent reward-to-risk opportunity if momentum continues to align.
Introducing LMT (Levels & Momentum Trading)
- Over the past 3 years, I’ve refined my approach to focus more sharply on the single most important element in any trade: the KEY LEVEL.
- While HMT (High Momentum Trading) served me well—combining trend, momentum, volume, and structure across multiple timeframes—I realized that consistently identifying and respecting these critical price zones is what truly separates good trades from great ones.
- That insight led to the evolution of HMT into LMT – Levels & Momentum Trading.
Why the Change? (From HMT to LMT)
Switching from High Momentum Trading (HMT) to Levels & Momentum Trading (LMT) improves precision, risk control, and confidence by:
- Clearer Entries & Stops: Defined key levels make it easier to plan entries, stop-losses, and position sizing—no more guesswork.
- Better Signal Quality: Momentum is now always checked against a support or resistance zone—if it aligns, it's a stronger setup.
- Improved Reward-to-Risk: All trades are anchored to key levels, making it easier to calculate and manage risk effectively.
- Stronger Confidence: With clear invalidation points beyond key levels, it's easier to trust the plan and stay disciplined—even in tough markets.
Whenever I share a signal, it’s because:
- A high‐probability key level has been identified on a higher timeframe.
- Lower‐timeframe momentum, market structure and volume suggest continuation or reversal is imminent.
- The reward‐to‐risk (based on that key level) meets my criteria for a disciplined entry.
***Please note that conducting a comprehensive analysis on a single timeframe chart can be quite challenging and sometimes confusing. I appreciate your understanding of the effort involved.
Important Note: The Role of Key Levels
- Holding a key level zone: If price respects the key level zone, momentum often carries the trend in the expected direction. That’s when we look to enter, with stop-loss placed just beyond the zone with some buffer.
- Breaking a key level zone: A definitive break signals a potential stop‐out for trend traders. For reversal traders, it’s a cue to consider switching direction—price often retests broken zones as new support or resistance.
My Trading Rules (Unchanged)
Risk Management
- Maximum risk per trade: 2.5%
- Leverage: 5x
Exit Strategy / Profit Taking
- Sell at least 70% on the 3rd wave up (LTF Wave 5).
- Typically sell 50% during a high‐volume spike.
- Move stop‐loss to breakeven once the trade achieves a 1.5:1 R:R.
- Exit at breakeven if momentum fades or divergence appears.
The market is highly dynamic and constantly changing. LMT signals and target profit (TP) levels are based on the current price and movement, but market conditions can shift instantly, so it is crucial to remain adaptable and follow the market's movement.
If you find this signal/analysis meaningful, kindly like and share it.
Thank you for your support~
Sharing this with love!
From HMT to LMT: A Brief Version History
HM Signal :
Date: 17/08/2023
- Early concept identifying high momentum pullbacks within strong uptrends
- Triggered after a prior wave up with rising volume and momentum
- Focused on healthy retracements into support for optimal reward-to-risk setups
HMT v1.0:
Date: 18/10/2024
- Initial release of the High Momentum Trading framework
- Combined multi-timeframe trend, volume, and momentum analysis.
- Focused on identifying strong trending moves high momentum
HMT v2.0:
Date: 17/12/2024
- Major update to the Momentum indicator
- Reduced false signals from inaccurate momentum detection
- New screener with improved accuracy and fewer signals
HMT v3.0:
Date: 23/12/2024
- Added liquidity factor to enhance trend continuation
- Improved potential for momentum-based plays
- Increased winning probability by reducing entries during peaks
HMT v3.1:
Date: 31/12/2024
- Enhanced entry confirmation for improved reward-to-risk ratios
HMT v4.0:
Date: 05/01/2025
- Incorporated buying and selling pressure in lower timeframes to enhance the probability of trending moves while optimizing entry timing and scaling
HMT v4.1:
Date: 06/01/2025
- Enhanced take-profit (TP) target by incorporating market structure analysis
HMT v5 :
Date: 23/01/2025
- Refined wave analysis for trending conditions
- Incorporated lower timeframe (LTF) momentum to strengthen trend reliability
- Re-aligned and re-balanced entry conditions for improved accuracy
HMT v6 :
Date : 15/02/2025
- Integrated strong accumulation activity into in-depth wave analysis
HMT v7 :
Date : 20/03/2025
- Refined wave analysis along with accumulation and market sentiment
HMT v8 :
Date : 16/04/2025
- Fully restructured strategy logic
HMT v8.1 :
Date : 18/04/2025
- Refined Take Profit (TP) logic to be more conservative for improved win consistency
LMT v1.0 :
Date : 06/06/2025
- Rebranded to emphasize key levels + momentum as the core framework
LMT v2.0
Date: 11/06/2025
- Fully restructured lower timeframe (LTF) momentum logic
ERA/USDT - new ATH!!a newly listed coin on major exchanges, has dropped nearly 40% from its initial peak and is now trading around $1.25. After the sharp sell-off, the price is beginning to stabilize and form a strong support base, signaling a potential trend reversal setup.
This zone offers a solid opportunity for early positioning as buyers begin to step in and absorb selling pressure.