France 40 Index - Signs of downside continuation (H4)The France 40 Index shows signs of downside continuation after a daily correction that followed the first downside impulse of this bearish move.
In fact, the index has broken below the previous month's low which per se doesn't mean anything, but as long as you don't have macd divergence on the way d
FRA40 — H4 potential bullish reversalTriple bottom forming with bullish RSI divergence.
Daily bullish trend — added confluence.
Daily retracement into the golden pocket zone.
H1 execution: wait for neckline breakout.
Stop loss below the Alligator crossing channel.
Risk/reward: 1:2.
Potential bullish reversal with daily-chart confluenc
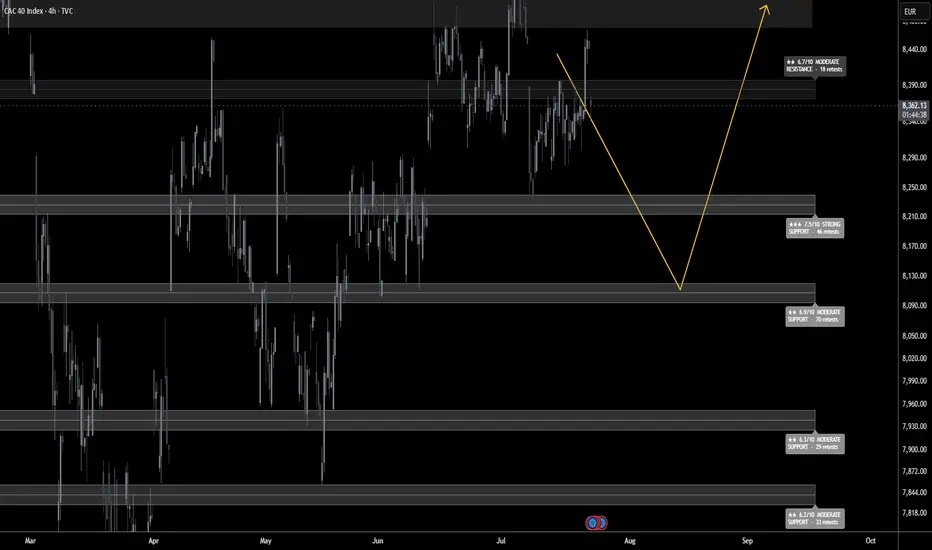
CAC 40 — Bullish Setup | Pullback Before UpsideThe CAC 40 is developing a potential bullish setup, with the current structure suggesting that the market may first experience a moderate move lower before the next upside phase takes shape.
From a technical perspective, the initial decline would represent a corrective phase within the broader setu
France 40 Near ATH — Short-Term Sell SetupFrance 40 is currently trading near its all-time high levels, where the market appears to be facing increased selling pressure after an extended bullish move. At these elevated levels, price is showing signs that a short-term downside move could develop as sellers begin to step in and take control.
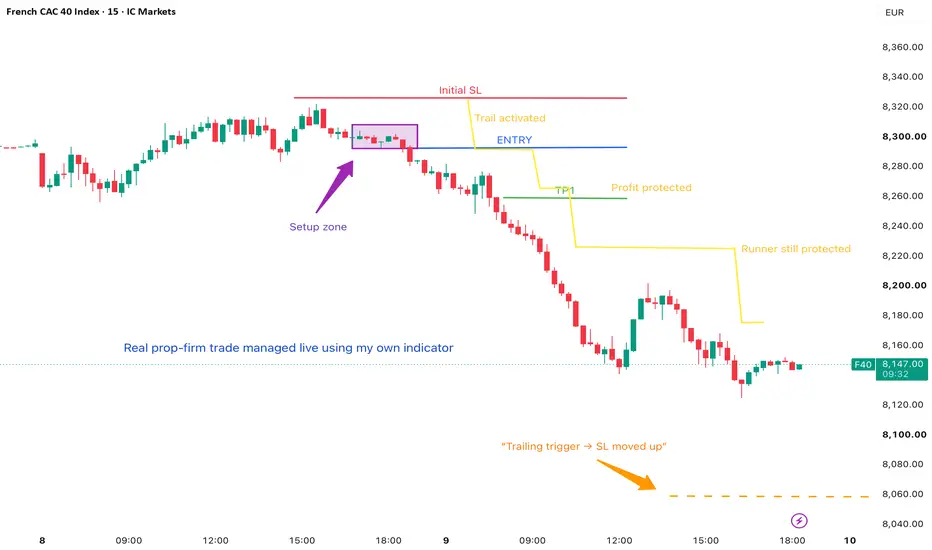
Smart Trailing Stop: Protect Profits, Let Winners RunA trailing stop should not simply follow price candle after candle.
If it is too aggressive, it can close a good position during a normal market pullback.
If it is too slow, a large part of the unrealized profit can be given back.
The goal of a smart trailing stop is therefore to find the right ba
CAC 40 Holds Support After Extended SelloffThe CAC has fallen just under 6% from its record high in around one month, and mostly in a straight line. The fact that August was a bearish outside month coupled with a bearish divergence suggests this pullback could have further to go.
However, perhaps it can bounce over the near term, given it
France 40 Breaks to a Record: Fundamental and Technical ViewEducation / Technical and Fundamental Analysis
Market: France 40 Cash
Timeframe: Daily
Bias: Constructive above 8,648, with confirmation required beyond 8,762
The France 40 has broken above a multi-month triangle and moved beyond its previous year-to-date record. At first glance, the message appear
CAC40 H4: Why 8,456 Is the Only Level That Matters▪️ CAC40 H4 SNAPSHOT — EXECUTIVE SUMMARY
▪️ the CAC has rolled over to 8,408 after failing at 8,551. The pullback is orderly so far, with price rotating back toward the middle of its range.
▪️ Primary outlook is bearish-to-cautious — 8,456 now caps the tape. Sellers own the near term unless it is
CAC40 H1: Why 8,385 Is the Only Level That Matters▪️ CAC40 H1 SNAPSHOT — EXECUTIVE SUMMARY
▪️ the CAC40 is coiling near 8,367 just under the highs, building energy against resistance after a clean run off support.
▪️ Primary outlook is neutral-to-constructive — 8,385 is the trigger; a decisive break and hold flips the tape into continuation.
▪️
CAC 40 March 2024 high of 8,253.39 was retested a year later in March '25 and this level of resistance has been broken converting it to a support level which is in the process of being tested. I believe this support level will hold for the remainder of July and as we move deeper into the 2nd half of the ye
See all ideas
Displays a symbol's value movements over previous years to identify recurring trends.
Frequently asked questions
FRANCE 40 CASH reached its highest quote on Aug 7, 2026 — 8,754.55 EUR. See more data on the FRANCE 40 CASH chart.
The lowest ever quote of FRANCE 40 CASH is 6,386.30 EUR. It was reached on Dec 20, 2022. See more data on the FRANCE 40 CASH chart.
FRANCE 40 CASH is just a number that lets you track performance of the instruments comprising the index, so you can't invest in it directly. But you can buy FRANCE 40 CASH futures or funds or invest in its components.