Espresso | Bulls Ordered a Double Shot of $ESPSomeone Put Rocket Fuel in the Coffee Machine
While most altcoins were busy taking another onchain nap, Espresso woke up and chose absolute violence! Bulls didn't just buy the dip... they bought the entire coffee shop!
☕ Why is COINBASE:ESPUSD pumpin ?
The biggest catalyst is major exchange listings, especially on Upbit and Bithumb, which opened the door to one of crypto's most active trading communities.. Fresh liquidity, new buyers, and FOMO combined into a perfect espresso shot, sending the token into a vertical rally
Mainnet glow up just hit, Epoch Rewards upgrade went live too.. Fixed throughput bottlenecks, hardened security, better networking, lower node costs. Validators are happy, the chain feels snappier
But this isn't just another random "number go up" meme
Espresso is building critical infrastructure for Ethereum's Layer2 ecosystem. Its network provides fast finality, decentralized consensus, and cross rollup interoperability, helping different L2s communicate securely and settle transactions in seconds instead of waiting much longer. As Ethereum scales through multiple rollups, infrastructure projects like Espresso become increasingly important
The recipe looked something like this
☕ Korean exchange listings = massive visibility
🚀 Liquidity explosion = more buyers than sellers
🔥 FOMO enters the chat
💥 Shorts become exit liquidity
🦍 Degens decide sleep is optional
Once momentum kicked in, traders piled in faster than someone buying the top after tweeting ' I'm waiting for a pullback '
What to watch next
The hype is real, but sustainability depends on whether Espresso can continue expanding integrations across Ethereum's Layer2 ecosystem and maintain strong network adoption not just price momentum.long term value usually comes from actual protocol usage and staking demand..
At this point ESP listed on all top exchanges so from now on, the pumps depends on the dev team and holders so watch them closely
Moral of the story ?
Never underestimate a token named after something that already keeps degens awake until 4 AM
ESP / TetherUS
No trades
No trades
In-depth trading ideas
ESP: Testing Heavy Overhead Resistance After Vertical SurgeESP: Testing Heavy Overhead Resistance After Vertical Surge – Technical Cooling-Off Scenario
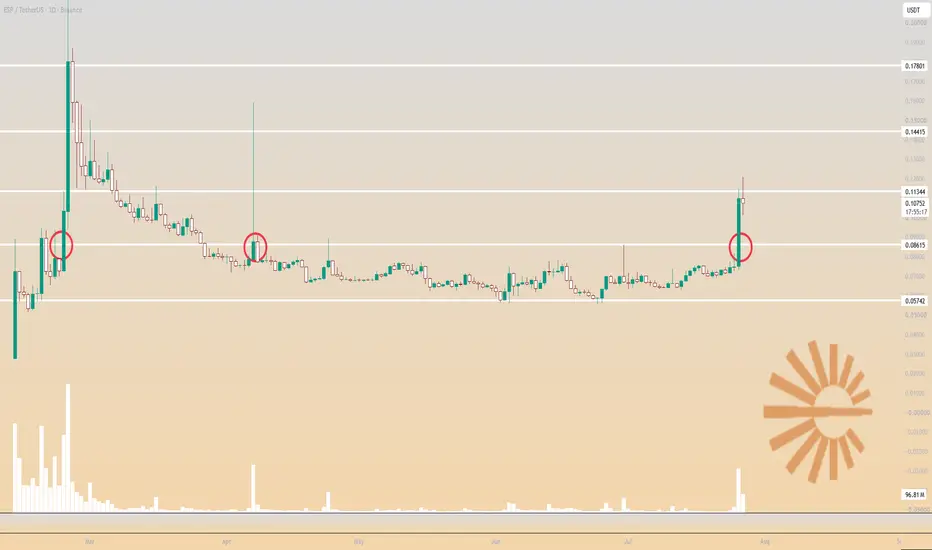
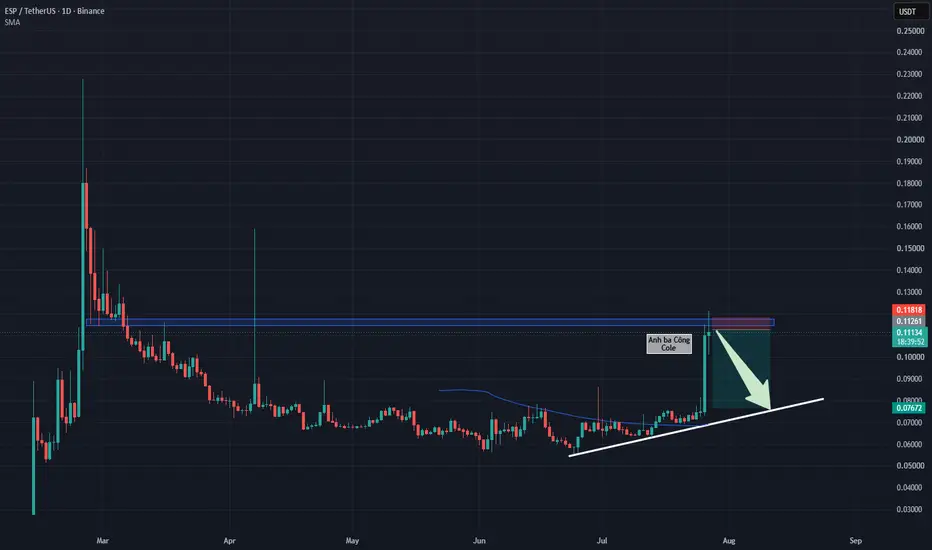
ESP has just logged a massive volatility expansion, printing a vertical daily gain exceeding 50% that officially establishes an uptrend structure featuring sequential higher lows. However, this bullish momentum swiftly encountered a major ceiling as intense profit-taking emerged, leaving a long upper wick right at the pivotal $0.114–$0.118 resistance zone.
Observing the visual data from the daily chart , this specific resistance cluster decisively rejected bullish expansion attempts twice before in March and April. The repeated price suppression indicates that heavy supply continues to defend this level. In market structure theory, a sustainable trend expansion requires healthy corrective pullbacks to flush out FOMO buyers and re-accumulate momentum for the next expansion leg.
Consequently, the highest-probability scenario is a technical pullback toward the $0.075–$0.077 support zone (confluent with the ascending trendline floor) to sweep for fresh bottom liquidity. The optimal strategy is to avoid chasing entries at overhead resistance, remaining patient for the price action to retest structural support before executing secure buy orders with optimized risk parameters.
Disclaimer: This is not financial advice, DYOR.
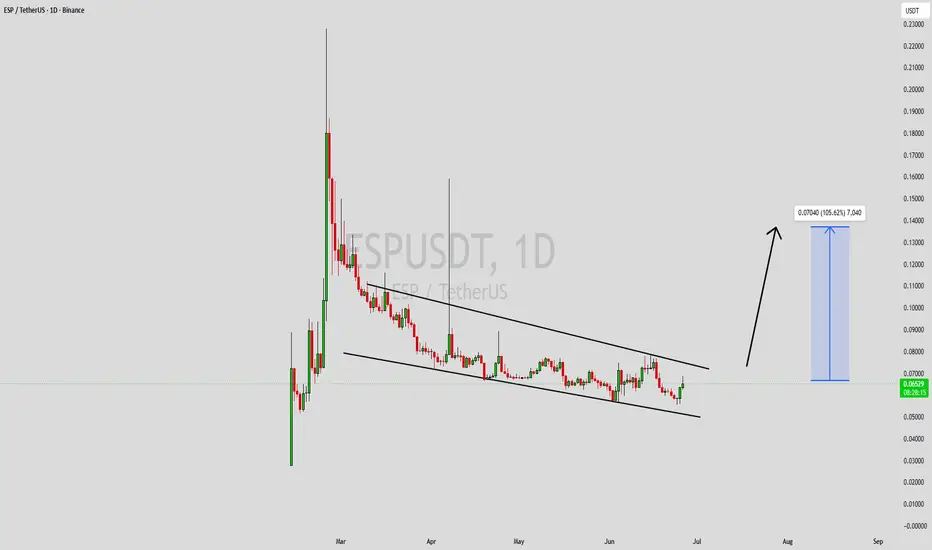
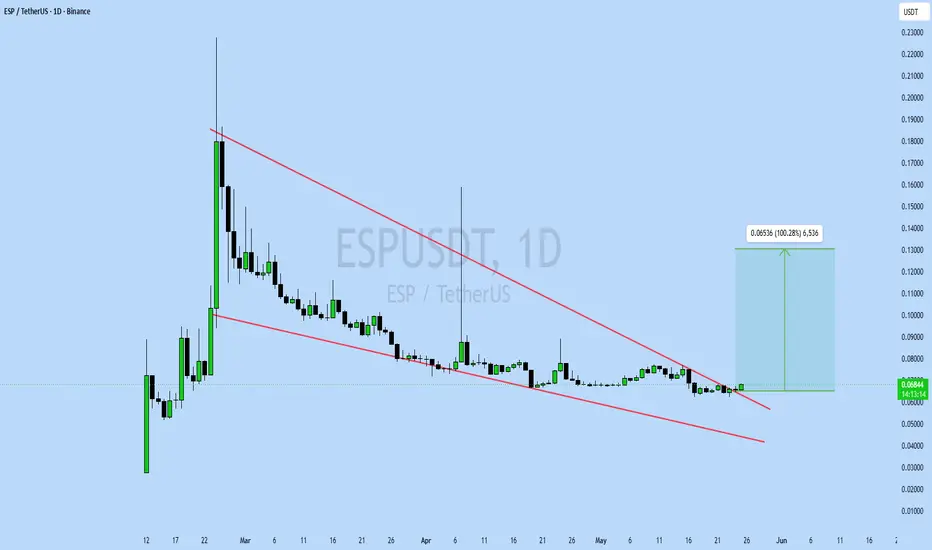
ESPUSDT Forming Falling WedgeESPUSDT is forming a clear falling wedge pattern, a classic bullish wave signal that often indicates an upcoming breakout. The price has been consolidating within a narrowing range, suggesting that selling pressure is gradually weakening while buyers are beginning to regain control. With consistent trading volume confirming accumulation at lower levels, the current setup hints at a potential bullish breakout in the near future. If the breakout is confirmed, the projected move could lead to an impressive gain of around 90% to 100%.
This falling wedge pattern is commonly seen at the end of downtrends or corrective phases, signaling a potential shift in market sentiment from bearish to bullish. Traders closely watching ESPUSDT are noticing strengthening momentum as the price approaches a key breakout zone. Healthy trading volume further reinforces this setup, indicating that market participants are positioning early in anticipation of a sustained upward move.
Growing investor interest in ESPUSDT reflects increasing confidence in the project's long-term potential and its current technical structure. If buyers successfully push the price above the wedge resistance with sustained volume, it could mark the beginning of a fresh bullish leg. The ongoing consolidation phase suggests steady accumulation, creating favorable conditions for a strong continuation rally once the breakout is confirmed.
Traders may find this an attractive medium-term opportunity, especially as the falling wedge pattern nears completion and buying pressure continues to build. A confirmed breakout could attract additional market participation and accelerate the move toward the projected upside target.
✅ Show your support by hitting the like button.
✅ Leaving a comment below! (What is You opinion about this Coin)
Your feedback and engagement keep me inspired to share more insightful market analysis with you!
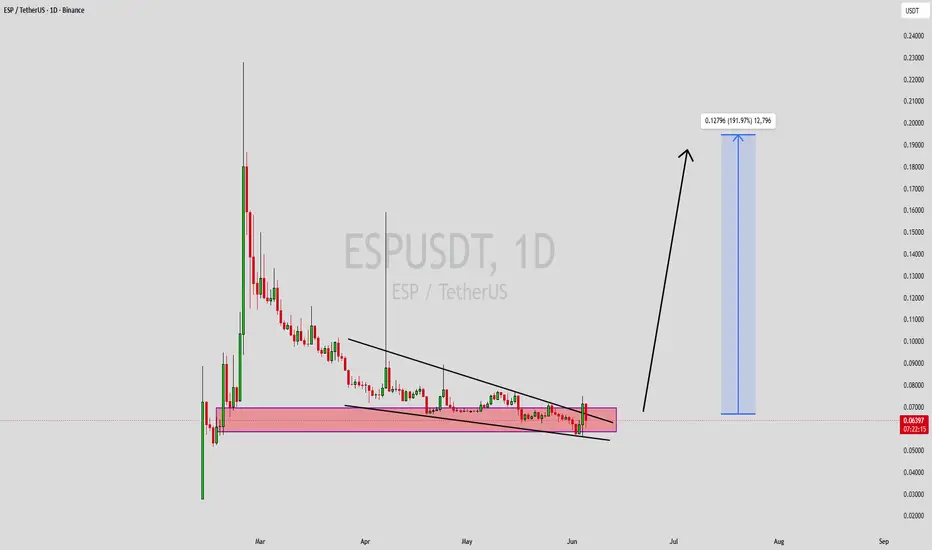
ESPUSDT Forming Falling WedgeESPUSDT is forming a clear falling wedge pattern, a classic bullish wave signal that often indicates an upcoming breakout. The price has been consolidating within a narrowing range, suggesting that selling pressure is weakening while buyers are beginning to regain control. With consistent volume confirming accumulation at lower levels, the setup hints at a potential bullish breakout soon. The projected move could lead to an impressive gain of around 90% to 100% once the price breaks above the wedge resistance.
This falling wedge pattern is typically seen at the end of downtrends or corrective phases, and it represents a potential shift in market sentiment from bearish to bullish. Traders closely watching ESPUSDT are noting the strengthening momentum as it nears a breakout zone. Good trading volume adds confidence to this pattern, showing that market participants are positioning early in anticipation of a reversal.
Investors’ growing interest in ESPUSDT reflects rising confidence in the project's long-term fundamentals and current technical strength. If the breakout confirms with sustained volume, this could mark the start of a fresh bullish leg. The ongoing consolidation suggests that buyers are steadily accumulating positions while bearish pressure continues to fade, creating favorable conditions for a potential upside move.
Traders might find this a valuable setup for medium-term gains, especially as the falling wedge pattern approaches completion and buying momentum continues to build. A successful breakout above resistance could attract additional market participation and potentially drive the price toward its projected upside target over the coming weeks.
✅ Show your support by hitting the like button!
✅ Leave a comment below! (What is your opinion about this coin?)
Your feedback and engagement keep me inspired to share more insightful market analysis with you!
ESPUSDT Forming Falling WedgeESPUSDT is forming a clear falling wedge pattern, a classic bullish wave signal that often indicates an upcoming breakout. The price has been consolidating within a narrowing range, suggesting that selling pressure is weakening while buyers are beginning to regain control. With consistent volume confirming accumulation at lower levels, the setup hints at a potential bullish breakout soon. The projected move could lead to an impressive gain of around 90% to 100% once the price breaks above the wedge resistance.
This falling wedge pattern is typically seen at the end of downtrends or corrective phases, and it represents a potential shift in market sentiment from bearish to bullish. Traders closely watching ESPUSDT are noting the strengthening momentum as it nears a breakout zone. Strong trading volume adds confidence to this pattern, showing that market participants are positioning early in anticipation of a reversal.
Investors’ growing interest in ESPUSDT reflects rising confidence in the project's long-term fundamentals and current technical strength. If the breakout confirms with sustained volume, this could mark the start of a fresh bullish leg. The current market structure suggests that buyers are steadily gaining control while bearish pressure continues to weaken.
Traders might find this a valuable setup for medium-term gains, especially as the falling wedge pattern nears completion and buying momentum accelerates. A confirmed breakout could attract additional buying interest and potentially drive the price toward significantly higher levels in the coming weeks.
✅ Show your support by hitting the like button!
✅ Leave a comment below! (What is your opinion about this coin?)
Your feedback and engagement keep me inspired to share more insightful market analysis with you!
ESPUSDT Forming Bullish MomentumESPUSDT is forming a clear bullish momentum pattern, a classic bullish wave signal that often indicates an upcoming breakout. The price has been consolidating within a narrowing range, suggesting that selling pressure is weakening while buyers are beginning to regain control. With consistent volume confirming accumulation at lower levels, the setup hints at a potential bullish breakout soon. The projected move could lead to an impressive gain of around 140% to 150% once the price breaks above the key resistance zone.
This bullish momentum pattern is typically seen at the end of downtrends or corrective phases, and it represents a potential shift in market sentiment from bearish to bullish. Traders closely watching ESPUSDT are noting the strengthening momentum as it approaches a critical breakout area. The healthy trading volume adds confidence to the setup, indicating that market participants may be positioning themselves early in anticipation of a strong upward move.
Investors’ growing interest in ESPUSDT reflects increasing confidence in the project's long-term potential and current technical strength. As accumulation continues and bullish pressure builds, the probability of a breakout becomes more significant. The tightening price structure suggests that a decisive move could be approaching, making this an important chart to watch.
If the breakout is confirmed with sustained volume, it could signal the beginning of a powerful new bullish trend. Traders may find this setup particularly attractive for medium-term opportunities, especially as the pattern matures and buying momentum continues to strengthen. A successful breakout could unlock substantial upside potential and attract further market attention.
✅ Show your support by hitting the like button!
✅ Leave a comment below! (What is your opinion about this coin?)
Your feedback and engagement keep me inspired to share more insightful market analysis with you! 📈🚀
Espresso: Bullish vs bearish mentalityHere we can see how ESPUSDT (Espresso) went up 330% in just a matter of days, eight days.
The market has many projects and many choices. You can choose from crashing projects or rising projects. I prefer the rising projects because they are easier and growth potential is unlimited truly, while the drop is limited to 100% and everything is already down 80-90% from ATH, which means that there isn't much room to move lower anyway.
When you decide to be a bear, you are calling for suffering even if inadvertently. In order for you to win, to make money and celebrate, whatever you are trading, buying, must crash and burn, and this puts us in a very uncomfortable situation. Each time we buy something, invariably we are wishing for suffering to fall upon people and the market. Being bullish is a different story though.
When you are bullish, you want to see expansion and growth, you want prosperity and evolution to continue its process of unfoldment. Even the colors have a strong story to tell.
Red is the color of survival, war, fight and emergency, it can signal to your subconscious that something is going badly, something is wrong. Green is the color of the trees, relaxation, nature, the heart. When you see green, immediately you relax and become calmed. This has been studied frequently, the effect green has on the human physiology and mind.
So I go with bullish and I go with green and I go with up. The market is big now so there are always many choices, and, incredibly enough, even while Bitcoin is crashing hundreds of altcoins continue to grow. Perfect, we can choose to go long.
Energy go where attention flows. It all depends on where you want to put your energy and mind. I want my mind and my energy focused on the good, on expansion, on growth. I want the best for all of us... Hold on, let me show you this chart.
ESPUSDT. The same range that produced the 300% jump within days is active again and the project is moving with volume. It can always happen that weak bullish action gets nullified and the market moves lower, but we are always focused on the long-term.
Here we can buy and hold. The chart looks good and there is potential for growth.
I will be showing you more bullish altcoins, there are plenty of those. It is not about one project and guessing/saying what will happen to the rest of the market because of what is happening over there, it is about building a plan and using it to trade and win long-term.
Thank you for reading.
Namaste.
ESPUSDT UPDATEESPUSDT Technical Setup
Pattern: Falling Wedge Breakout
Current Price: $0.06845
Target Price: $0.13381
Target % Gain: 100.28%
Technical Analysis: ESPUSDT is showing a bullish falling wedge breakout on the 1D timeframe after a prolonged downtrend compression. Price is attempting to break above the descending resistance with improving momentum, while the projected move targets the $0.13381 resistance zone if buyers maintain control and volume continues to increase.
Time Frame: 1D
ESP / USDT — Early Breakout & Expansion Setuphey there , how are you all?
February 23, 2026
ESP is currently showing a classic early breakout structure after a short consolidation and accumulation phase.
Price has compressed inside a tight range and is now attempting to transition into a new impulsive leg, supported by increasing volume and strong market participation.
This type of setup often appears at the start of a momentum-driven trend.
🔍 Technical Overview
Current price: ~$0.110
After an initial impulsive move, ESP entered a brief consolidation phase around the $0.07–0.10 area, where buyers defended price aggressively.
The recent breakout above this base suggests that the market is preparing for trend continuation.
📊 Market Structure Breakdown
1. Accumulation & Base Formation
ESP formed a compact base between:
Support: ~$0.07–0.08
Resistance: ~$0.10
This range acted as a re-accumulation zone, where supply was absorbed and volatility declined.
Strong volume spikes during this phase indicate institutional or whale participation.
2. Breakout Confirmation Phase
Price recently:
Broke above the consolidation range
Closed above resistance
Held the breakout level
This confirms a valid breakout attempt rather than a false move.
The blue demand zone now acts as dynamic support.
3. Early Expansion Structure
Following the breakout, price is starting to build a stair-step pattern — a typical sign of controlled bullish expansion.
This suggests continuation rather than exhaustion.
🧱 Key Levels
Major Support Zones
$0.095–0.100 → breakout retest zone
$0.075–0.080 → base support
As long as price holds above $0.095, the bullish structure remains intact.
Resistance & Upside Targets
$0.166 → first expansion target
$0.240 → mid-term resistance
$0.314 → macro target zone
These levels correspond to previous supply zones and projected extensions.
📈 Volume Analysis
Volume expanded significantly during the breakout, confirming:
✔ Strong demand
✔ Healthy participation
✔ Reduced fakeout risk
Sustained volume during pullbacks would further validate trend strength.
🎯 Outlook & Scenarios
✅ Bullish Continuation Scenario
If ESP:
Holds above $0.095
Builds support above $0.11
Breaks $0.166 with volume
Then price could enter a strong expansion phase toward $0.24 → $0.31+.
This represents a potential 2x–3x move from the current range.
In a favorable market environment, higher extensions are possible.
⚠️ Bearish / Invalidated Scenario
If price loses $0.095:
Risk of return to consolidation
Possible move back to $0.08
Delay in trend development
This would neutralize the current bullish setup.
🧠 Market Psychology Perspective
ESP is currently in an early discovery phase:
✔ Fresh breakout
✔ Low historical resistance
✔ Rising participation
✔ Growing momentum
These phases often attract rotational capital looking for high-beta opportunities.
Latecomers usually enter after the first major impulse — early participants benefit most.
🚀 Final Thought
ESP is displaying:
✔ Tight accumulation
✔ Clean breakout
✔ Volume confirmation
✔ Clear upside structure
This is a textbook early-stage momentum setup.
If price continues to build above $0.11 and holds support, ESP has strong potential to evolve into a trending asset over the coming weeks.
good trading!!
Both Squeezes at High With Bulls Leading but Volume SilentESPUSDT trades at 0.08969 with futures at 0.08944, printing an 81.4% bullish structural score across 112 signals classified as deep. The supply-demand split reads 79.5% to 20.5% with buyers dominating at 3.89x intensity with only 38% clarity. Price has retraced -2.8% with a 15.4% bounce at 5.6x strength, classified as BO+. Both spot and futures squeezes are building at high compression for 13 and 12 bars respectively. Price sits at 90.5% of its range. The bullish framework is robust but the volume landscape is uniformly quiet and clarity remains below 40%, putting a question mark on the signal quality driving the conviction.
Price and Bias
Price sits at 90.5% of its measured range between 0.09197 and 0.06543, classified as upper. The -2.8% retrace is shallow and the 15.4% bounce at 5.6x strength is a strong recovery impulse with confirmed BO+ breakout status. The extreme breakout tag on the structural panel confirms the move has exceeded standard thresholds.
EMA alignment runs a clean 6:0 bullish sweep. Ichimoku prints 9:1 heavily favoring buyers with near-complete structural confirmation. Candle patterns read 10:3 bullish. The counter-trend score at 8:3 shows reversal signals firmly supporting the trend rather than challenging it. The spread metric at 62.8% reads deep structural conviction. Star at 1:0, engulfing at 1:0, DD/SS at 4:1, Harami at 0:1, and pattern total at 1:1. The pattern total at 1:1 and Harami at 0:1 introduce marginal hesitation but do not challenge the dominant bullish read.
The premium sits at -0.26% in mild backwardation with a Z-score of 0.2. The yield curve implies -281% annualized at 0.2 sigma on the bullish side. Standard deviation reads a volatile 0.323% and the mean Z at -1.43 sigma is falling. Futures continue to lag spot, consistent with the pattern seen across timeframes in this pair where spot leads price discovery.
Volume and the Silence
All three volume Z-scores are quiet. Spot reads -0.51, futures -0.8, and the combined at -0.79. Dollar flows show 26.69M spot against 179.7M in futures. The futures-to-spot ratio at 6.73x is classified as elevated but within normal bounds. The spot-to-futures volume split of 298.4M to 2.01B confirms derivatives hold the larger share.
Directional flow reads neutral. The bull-bear volume Z split at 0.24 versus -0.86 provides a mild bullish lean, with bear volume notably more suppressed than bull participation. Volume momentum is rising at 0.03, barely positive but directionally improving from a suppressed base. The 1-to-5 timeframe volume Z range of -0.51 to -0.54 shows uniform quiet across all measured timeframes with no improvement anywhere.
No whale activity is detected and liquidation reads clear. OBV Z-score reads -0.44, classified as inflow. Despite the negative Z-score, the inflow classification confirms cumulative flow is trending upward. The longer-term picture remains below its mean but the direction has shifted positive. OBV divergence reads normal.
Squeeze and Both Compressed
The spot squeeze is building at high compression for 13 bars. The futures squeeze sits at high for 12 bars. Squeeze divergence reads both compressed, confirming synchronized compression across markets. Squeeze momentum expansion reads 0% with no release yet triggered. The dual high compression with 0% expansion means both squeezes are fully loaded and awaiting the catalyst for release.
The one-bar gap between spot at 13 and futures at 12 is insignificant. The both-compressed classification means the stored energy will release in a coordinated fashion when triggered. The 0% expansion confirms the compression phase is still active with no early leakage in either direction.
Momentum reads bullish but declining with Bollinger bandwidth at 15.55%. The declining momentum during active squeeze compression is expected and does not signal weakness. When the squeezes release, momentum should reaccelerate in the direction of the expansion.
Leverage and Context
Leverage reads 6.72x, classified as elevated, with a percentile of 7.5%, tagged as floor. The all-time max of 15.17x sits 186 bars back and the minimum of 1.39x was 527 bars ago. The leverage percentile at the floor means speculative positioning has almost entirely cleared. The path for a breakout is unobstructed by forced liquidation risk on either side.
Scenarios
The bullish squeeze release is backed by the full structural framework. An 81.4% bull score with 6:0 EMAs, 9:1 Ichimoku, 10:3 candles, 8:3 counter-trend, 5.6x bounce strength at BO+, OBV inflow, and leverage at the floor percentile with both squeezes synchronized at high compression. If the squeezes release upward with volume Z recovering above -0.3 and expansion moving past 20%, the 0.09197 range high becomes the immediate target from the 90.5% price position. The bull-bear Z split at 0.24 versus -0.86 provides a mild directional lean favoring the bullish resolution. The premium converging from -0.26% toward zero as futures close the gap to spot would confirm participation broadening.
The dissipation scenario is grounded in the volume reality. Quiet volume across all timeframes with 0% squeeze expansion and 38% clarity creates the conditions for the compression to simply fade without a directional release. If volume remains suppressed through the next several bars with no expansion trigger, the squeezes lose energy and price drifts back from the 90.5% ceiling. Below 0.086 on continued quiet volume with OBV rolling from inflow to outflow confirms the compression has dissolved and the BO+ classification was a structural artifact without market participation to validate it.
The clarity reading at 38% deserves repeated emphasis. When more than 60% of the signal set is producing ambiguous reads, even an 81.4% bull score carries reduced reliability. The structure is bullish but the system is telling you it is not confident in the quality of the inputs generating that assessment.
Watch Levels
Above 0.092 with both squeezes firing, volume Z recovering above -0.3, and expansion accelerating past 20% confirms the breakout into new territory. The leverage floor means the release faces no positioning headwinds. Below 0.086 on stalling expansion and fading OBV confirms dissipation and opens a retrace toward 0.080. The synchronized high compression at 13 and 12 bars is mature enough that the outcome is imminent. Volume response on the first expansion bar is the confirmation signal.
Risk Note
This is the perpetual futures view of the same pair analyzed on the spot chart, and the readings are consistent. Both timeframes show deep bullish structure with synchronized squeeze compression, floor leverage percentile, quiet volume, and 38% clarity. The consistency across spot and perp is constructive because it means the signals are not diverging between markets. The risk is identical on both. Quiet volume at 0% squeeze expansion near a price ceiling means the breakout is a loaded spring without a trigger. The trigger comes from volume. Until it arrives, the compression is potential energy, not kinetic. The 38% clarity applies to both instruments. Trade the release, not the anticipation.
More analysis on my profile.
Tags: ESPUSDT, ESP, futures, perpetual, squeeze, volume, leverage, OBV, breakout, compression
ESP Bearish Breakdown – Support Lost, Downside Momentum Building#ESP has officially shifted into a short-term downtrend after confirming a bearish divergence, signaling weakening bullish momentum. Price failed to sustain higher levels and has now broken a key support zone, adding further confirmation to the bearish bias.
What’s happening on the chart?
Clear bearish divergence on the indicator (momentum fading)
Structure shift from higher highs to lower highs
Strong support level broken with downside pressure
Sellers currently in control
Trade Plan:
I am looking to enter a short position at CMP after the confirmed breakdown.
Risk management will remain the top priority.
Targets:
First target: Previous minor demand zone
Second target: Next strong support area
Invalidation:
If price reclaims the broken support and holds above it, the bearish setup will be invalid.
Always manage your risk properly. No trade is guaranteed.
If you agree with this setup or see something different, drop your thoughts in the comments
Don’t forget to like & follow for more high-probability trade setups!
#ESP #CryptoTrading #BearishSetup #TechnicalAnalysis #ShortTrade #PriceAction #RiskManagement #TradingView #Divergence #Breakdown