In-depth trading ideas
ETC time to be bullish!ETC ranging after +90% correction from the top. We have seen same pattern in 2020 after we drop +90% from the top. You can also see ETC and ETH having same pattern so if you are bullish on ETH you have to be bullish on ETC...
I expect push out of the accumulation range opening strong impulse to new ATH. Likely target is fibb 1.272 extension but wick to fibb 1.618 is also possible. In any case once in new ATH range start slowly securing profits.
Ethereum Classic at $9: Support Test Could Spark a Bounce:Current Price: 9.04
Direction: LONG
Confidence level: 56%(Professional trader insights are mixed but lean toward support holding rather than breakdown, volume shows accumulation near current levels, and price is trading close to a widely watched support zone. Limited real-time social data keeps confidence moderate.)
Targets
Target 1: 9.40
Target 2: 9.85
Stop Levels
Stop 1: 8.55
Stop 2: 8.00
Wisdom of Professional Traders:
This analysis pulls together the collective insight of professional traders discussing Ethereum Classic across multiple market updates. The wisdom of professional traders shows a pattern: while ETC hasn’t been a market leader, several traders continue to flag it as a support‑driven setup rather than a breakdown candidate. When trader consensus leans toward “holding key levels” instead of “clear downside,” that usually tells me risk is skewed toward a bounce rather than a flush.
Key Insights:
Here’s what’s driving this setup. Multiple professional traders mentioned Ethereum Classic rotating with the broader altcoin group, sometimes catching short bursts of strength when Bitcoin stabilizes. At the same time, traders were honest about ETC underperforming during periods of BTC weakness. That mix matters, but what stands out is where price is now: right above a widely watched support zone around the low‑$8 to $9 area.
What’s interesting is the on‑chain and volume commentary layered on top of that. Traders pointed out rising transaction activity and noticeable volume clustering between roughly $8.70 and $8.90. That usually shows larger players absorbing supply. It doesn’t guarantee upside, but it often limits downside unless a major market shock hits.
Recent Performance:
ETC has pulled back roughly 1–2% over the last 24 hours, trading around $9 after failing to hold above $9.50 earlier in the week. The pullback hasn’t come with collapsing volume. Instead, price has been grinding lower into support, which fits a consolidation‑near‑support pattern rather than panic selling.
Expert Analysis:
Several professional traders I tracked described ETC as vulnerable if Bitcoin loses support, but they also stressed that current levels are where buyers typically step in. Momentum indicators like RSI are sitting in the low‑40s, which traders often see as “early oversold” rather than exhausted. MACD is still negative, so this isn’t a momentum chase — it’s a support play.
From a chart perspective, traders are watching $8.00 as the line that changes the story. As long as ETC holds above that zone, the path of least resistance over the next week looks sideways to higher, with $9.40 and then the $9.80–$10 area acting as logical upside checkpoints.
News Impact:
Recent headlines around new PoW‑focused mining hardware and an upcoming Ethereum Classic network upgrade have quietly improved sentiment among long‑term holders. None of this is explosive on its own, but traders often price these developments in gradually. On the flip side, broader crypto market swings driven by Bitcoin remain the main risk — a sharp BTC drop would likely drag ETC lower regardless of its own news.
Trading Recommendation:
Here’s my take. I’m going LONG on Ethereum Classic near $9 because price is hovering just above a clearly defined support zone that multiple professional traders are watching. I’m keeping targets realistic for this week, aiming first for $9.40 and then $9.85 if momentum improves. Risk is tightly managed with stops at $8.55 and a hard invalidation near $8.00. This isn’t a high‑conviction breakout trade — it’s a support‑based bounce attempt with controlled risk. Size accordingly.
Ethereum Classic breaks down as downside pressure builds:Current Price: 9.75
Direction: SHORT
Confidence level: 62%(Several professional traders describe ETC as an underperforming altcoin with expectations of further downside before a broader market bottom. Price action confirms weakness and there is no strong social or news-driven support.)
Targets
Target 1: 9.20
Target 2: 8.80
Stop Levels
Stop 1: 10.20
Stop 2: 10.80
Wisdom of Professional Traders:
This analysis pulls together the collective wisdom of professional traders and market experts tracked across long-form market commentary. When multiple traders independently flag the same asset as weak or vulnerable, that crowd insight often matters more than any single indicator. For Ethereum Classic, several traders consistently grouped ETC with underperforming altcoins and warned of further downside before a broader market bottom forms.
Key Insights:
Here’s what’s driving this setup. Across the professional trader snippets, the language around Ethereum Classic is clearly bearish in the short term. Several traders highlighted ETC as one of the weaker large-cap altcoins, expecting it to break prior lows before any meaningful recovery attempt. The repeated comparison to other lagging coins like Litecoin and Dogecoin reinforces the idea that capital is rotating away from ETC rather than into it.
What’s interesting is that no traders stepped in to defend current levels aggressively. Instead, the dominant narrative is patience on the downside, with expectations of lower prices before buyers show up. That lack of bullish conviction is often a warning sign, especially when the broader crypto market is already showing selling pressure.
Recent Performance:
You can see this play out in the price action. ETC has slid toward the $9.75 area after failing to hold higher levels earlier in January. Recent sessions show lower highs and fading bounce attempts, which tells me sellers are still in control. Momentum hasn’t flipped yet, and each small rally has been sold into quickly.
Expert Analysis:
Several professional traders I tracked described ETC as an underperformer relative to stronger crypto assets. The consensus view is that ETC is likely to push below recent lows before finding a meaningful base, with some traders pointing to a potential cyclical bottom window later in the spring. For this week, that translates into downside risk toward the high-$8 to low-$9 zone rather than an upside breakout.
From a technical angle, the inability to reclaim the $10–$10.20 zone is key. As long as price stays below that area, rallies look corrective rather than impulsive. That’s why I’m treating any bounce into resistance as a selling opportunity.
News Impact:
On the news front, there’s no strong catalyst lifting Ethereum Classic right now. Broader crypto headlines are focused on larger ecosystems and macro themes, leaving ETC without a narrative tailwind. In markets like this, assets without fresh stories often drift lower as traders redeploy capital elsewhere.
Trading Recommendation:
Putting it all together, here’s my take. I’m positioned SHORT on Ethereum Classic with a focus on a move toward $9.20 first and potentially $8.80 if selling accelerates this week. I’d keep risk tight above $10.20, with a hard invalidation above $10.80. Confidence isn’t extreme because crypto can turn fast, but the trader consensus and price structure both lean bearish right now.
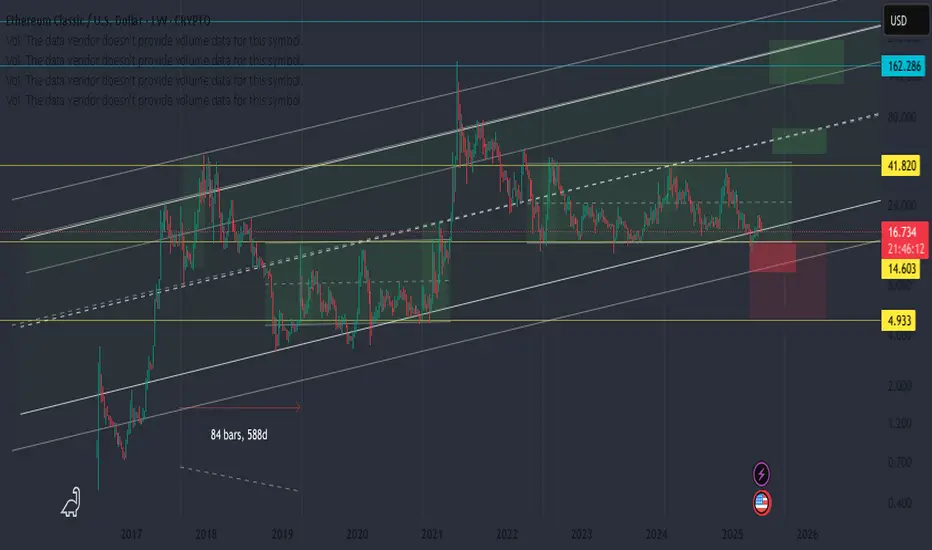
ETC Main Trend. Ascending Channel (all time) 10 2025Time frame: 1 week. Logarithm.
🔵Main trend: ascending, rising channel, since the inception of cryptocurrency.
🟡Secondary trend: descending, transitioning to a sideways trend (#accumulation), and forming a 4.9-year symmetrical triangle.
🟣Local trend: descending, trapped in the corner of a large triangle and “tension” consolidation before exiting.
Manage your risks and stick to your trading plan, don't get caught up in market and news noise, which creates dominant opinions and illogical actions by the majority, who are doomed to lose in the future.
Everything will be as it usually is with assets (stocks, less so cryptocurrencies. These are just a few examples of how these aren't real assets, but imitations of usefulness, i.e., a complete scam market). These assets have maintained an upward primary trend for a long time (from the very beginning), and huge, multi-year patterns form near dynamic support. That is, an upward breakout may initially throw passengers under the market , or some fictitious cryptocurrency events before a price rise (on a large time frame) don't be alarmed; ignore them, or use this opportunity to reduce the average price of the overall position. Or rather, before a dominant trend change, the "point of no return."
A striking example of this is XRP with its huge triangle and its exit (the first wave +600%, which is a capitulation on profits, or, in slang, a "hamster pump"). Then there will be 2-3 waves of price growth pumps, with each consolidation in the trend being "buried" and the cry "all is lost." In the final wave, possibly with spikes as before, a full-fledged #distribution zone will form.
XRP/USD Main Trend 07 2022
The market is simple at its core, but complex due to the interactions between people and their capital. The combination of simplicity and complexity creates many variations that you can exploit to profit from it. Your success and understanding of this determines your profit or loss in speculative markets.
You can complicate things without understanding their simplicity, which looks ridiculous from the outside. Playing smart. Or, conversely, simplifying complex, often false, concepts so that everything becomes clear and understandable. Simplicity is the essence of complexity.
In any activity, you should not pursue complexity to achieve the desired result, but rather simplification and optimization, so that you can achieve the same or better results with less effort and risk.
The entire secondary trend and this triangle with a local denouement zone in it.
Your trading plan and risk management eliminate all worries, indecision, emotional outbursts, predictions, and other people's right and wrong opinions.
ETC (Long Term)ETC is forming a large flat, with waves A and B completed, and now It's forming wave C of this flat, which is an accelerating terminal wave, with waves 1, 2, and 3 completed, and It is completing wave 4 of this terminal, which cannot go above the top of wave 2, which is $26.5, and will be completed around $20 to $24.Then, wave 5 of this terminal must be completed, which must go below $12.7, the bottom of wave 1, until wave 5 of the terminal is completed, and after that, the new main market wave begins, which can raise ETC to the ATH $180.In addition, because ETC is forming a triangle in the long term that started in 2016 and it's waves A, B, and C were completed by 2021, and since 2021, the large wave D of this triangle is forming and completing, it cannot have more than the first three waves, so the end of this wave correction and the start of a new market wave cannot be later than April 2026.And this corrective wave should end sooner than this time and the new big wave should begin. So this wave should begin within the next 5 months.
Largest PoW smart-contract blockchainEthereum Classic (ETC) is often considered a top-5 Proof-of-Work chain because it retained PoW while major platforms such as Ethereum migrated to Proof-of-Stake, leaving ETC as the largest PoW smart-contract blockchain. After the Ethereum Merge, a significant amount of the Mining power shifted to ETC, raising its baseline hashrate and strengthening its security profile.
Its EVM-compatible Smart-Contract capability differentiates it from the remaining PoW networks, which are mainly currency-only!
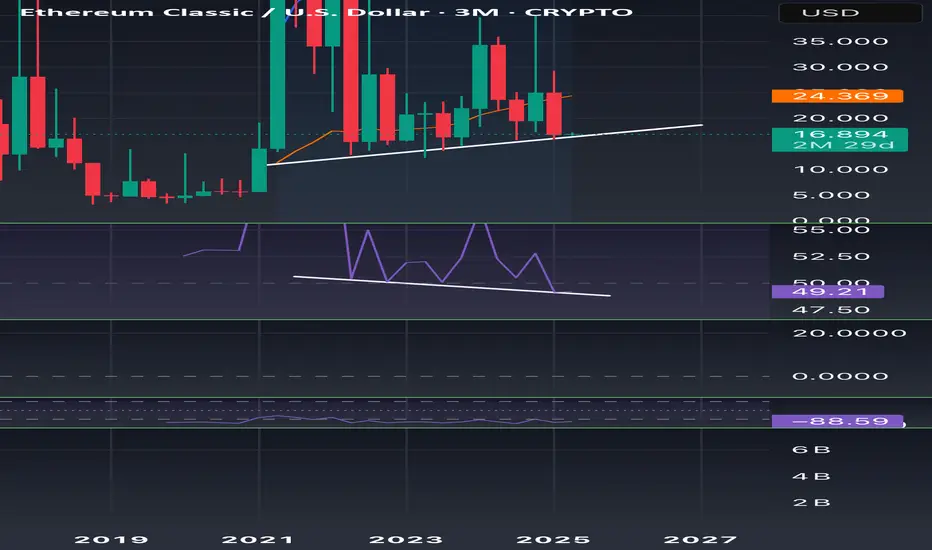
ETC its now or neverA lot of speculation that these dino coins are dead and its just hype on peoples minds i will give you my bullish look so you can choose .we clearly have bullish divergence on the rsi and macd but are seeing lower lows so which is it? i believe after 5 year of consolidation in a triangle pattern its more probable we will see a test to to highs breakout of the 5 year triangle
Accumulation in Action: Preparing for the Breakout📎 Accumulation Observed
Highlighted zones show phases of accumulation — nothing unusual, just the market doing its thing.
Opportunities exist while most focus on noise.
While many chase short-term volatility, bigger players quietly build positions — turning cheap assets into expensive ones.
📋 Some Principles Instead of Advice:
🖇️ Risk isn’t found on the chart — it’s in your mind.
If you’re still hunting for “will it dump or hold” zones, it’s time to tighten your money management.
🖇️ Structure favors the buyer.
The market is cheap. And as always: cheap eventually becomes expensive — it’s not a question of “if,” but “when.”
🖇️ Drawdowns aren’t a tragedy.
If losses break your system — the problem isn’t the chart, it’s the lack of one. Management and strategy are the only indicators you fully control.
🔔 Like the idea if you find it useful. Share your thoughts in comments — strong zones aren’t debated, they’re confirmed by action.
ETH Beta & Decaying returnsAs it becomes clearer and clearer that alt-coin relevance is being dampened, I expect a couple of things:
1) The ETC fractal will play out again as with 2020-2021. Reaching it's conclusion by end of Q4 2025, and starting a year's long bear market thereafter.
2) The return for said fractal will not exceed the previous cycle high. (See altcoin return decay in legacy altcoins like CRYPTOCAP:LTC , CRYPTOCAP:XRP , etc. in 2021).
Target = $80-$100
This entire rally is dependent upon BTC not entering a bear-market this month or in October, which is still TBD.
If a bear market happens, the entire structure of the altcoin market will be permanently compromised, heralding in a much needed but painful wipeout of projects not named 'Bitcoin'
ETH survivorship however, would bode well for ETC in future cycles.
ETC/USD – Weekly Chart Overview Ethereum Classic is trading at a key long-term support zone, bouncing from the lower bound of a multi-year ascending channel. Historically, this zone has triggered large rallies (2019, 2020, 2021).
Major resistance levels are stacked at $24, $42, $77, and $103. If the price holds above $22–24 and breaks out with volume, it could retest the mid/high zones of the channel.
Structure remains bullish above $20. Break and hold above $26–27 may signal the start of a new macro wave.
ETCUSD – Pump Then PauseEthereum Classic was stuck in a sideways grind around the $16.00–$16.50 region for several days, forming a broad base with minor fakeouts. That pattern resolved in a sharp vertical pump to $17.20, followed by an immediate fade. Currently, price is retracing back toward the old base zone. Watch the $16.50 level: holding it suggests bulls may re-accumulate, but further breakdown puts $16.10–$16.20 back in play.