ETC — Daily Coil / 1H Reclaim Setup⚛️ ETC is one of the more interesting compression structures on my radar right now.
After the sharp June selloff, price has spent the last several weeks building a symmetrical daily coil: lower highs pressing down into rising support, volume contracting, and price gradually being squeezed toward the apex. That is exactly the type of structure I want to see before a larger expansion.
The important part is that ETC is no longer just sitting at the bottom of the coil. On the 1H, it swept the lows near 6.85, reclaimed the faster EMAs, and is now pushing back through the high-volume area around 7.00–7.05.
HTF Context 🔭
Daily structure is still beneath the declining 50 EMA and larger trend resistance, so this is not a “buy and forget it” trend chart yet. But that is what makes the compression important: a confirmed break can force a move through a lot of trapped positioning.
The first major overhead test is the declining daily 50 EMA / resistance cluster around 7.32–7.35.
What I Want To See 🧱
Continued acceptance above 7.05
Continued by pressure
A tight LTF base or flag above 7.05
Expansion volume as price challenges the upper coil boundary
If ETC can break and accept above the upper daily trendline, the structure shifts from a compression watch into a legitimate squeeze/continuation setup.
Failure Scenario 🔴
This idea fails if price loses the reclaim and accepts back below 7.00, especially if it breaks back beneath the 1H EMA structure. A loss of 6.94–6.90 would put price back inside the lower portion of the coil and remove the immediate bullish thesis.
This is not about predicting which way the coil resolves. It is about recognizing that the range has tightened, the location is defined, and the risk can stay clean if price fails.
Location → Compression → Confirmation.
Not a signal. Just how I’m reading structure and participation.
In-depth trading ideas
ETCUSDT.P: short setup from support at 6.501SETUP CONTEXT:
BINANCE:ETCUSDT.P has been in consolidation for a very long time and has accumulated enough energy for a strong move. I have several factors pointing to a short, so I am looking at a short scenario. Although, as you know, the market can do exactly the opposite of what you expect.
Why am I actively watching this asset right now? We tapped a very old, strong level pixel-perfect, after which the asset went into consolidation above it and is slowly approaching it again—meaning it's going for a close retest. Yesterday's daily close near the low of the bar and right at the level clearly indicates buyer weakness.
LEVEL PROFILE:
Price: 6.501
Timeframe: D1
Level validations:
round number
exact price taps (pixel-perfect)
false break
impulse halt at the level WHAT I WANT TO SEE:
trend alignment
clear path beyond level
prolonged base (consolidation)
volatility contraction on approach
no pullback after strong momentum
close retest
at-level close Do you see this setup differently? Let me know your thoughts in the comments.
If this logic aligns with your trading plan, support the idea with a boost! Disclaimer: This publication is part of my public trading journal. The material is strictly for educational purposes, reflects my market perspective, and is not financial advice. Trading facts, not expectations.
ETC: local squeeze with $7.80 destinationThe Macro Picture 🗺️
ETC unwound its May $10.10 highs through a sharp descent that bottomed at $6.40 in early June. Since then, price has settled into a broad $6.40–7.80 base — a volatility playground where the lows keep getting defended and the rallies faded back toward the middle. Price now sits in the lower third of that range near $6.95, pressing against the support that has held every test this cycle, with RSI balanced around 44. Buying into a defended floor rather than chasing strength is the higher-confluence play, and the path of least resistance from here leans back toward the range top.
The Setup ⚙️
The Buy Area: The $6.40–6.60 band is where demand has repeatedly stepped in. Bulls are defending this floor, and as marked on the chart, price is holding just above it with room to rotate higher.
The Ceiling: The $7.80 decision line caps the range. A clean reclaim flips the local structure bullish and opens the path toward the $8.50 macro resistance above.
The Range Play: The zone between $6.60 and $7.80 creates a structural playground for grid-based accumulation — staggered entries across the range capture the chop while the market decides its next macro leg.
The Roadmap: Primary target sits at $7.80 — the green roadmap points there as price works up from the support toward the range top. Invalidation: a clean daily close below $6.40 would invalidate this bullish thesis and signal a structural breakdown out of the range.
More setups in profile.
#ETC #CRYPTO #EthereumClassic #Altcoins #TechnicalAnalysis
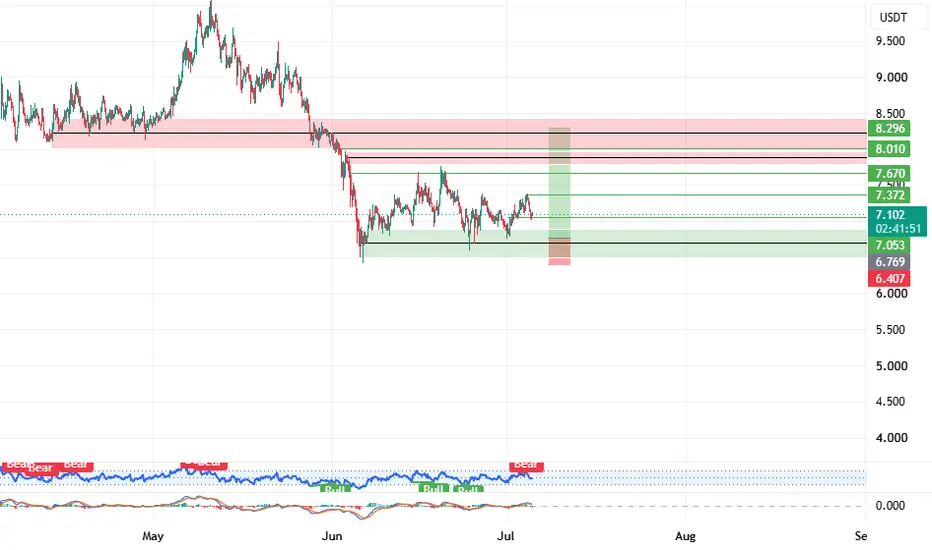
ETC USDT LONG SIGNAL#46. ETC/USDT – Trade Setup (LONG)
📈 Position Type: LONG
🕒 Timeframe: 1 H
📊 Market: Futures
💰 Entry Zone:
7,087
6.962
🛑 Stop-Loss:
6.790
🎯 Take-Profit Targets:
• TP1: 7.199
• TP2: 7.326
• TP3: 7.476
• TP4: 7.673
TP5:
TP6:
⚙️ Leverage:
5- 10
⚠️ After reaching TP1, move Stop-Loss to Entry Price.
📌 Risk Management:
Risk only 1–2% of your capital per trade.
Always confirm the setup on your chart before entry
#ETCUSDT#ETC
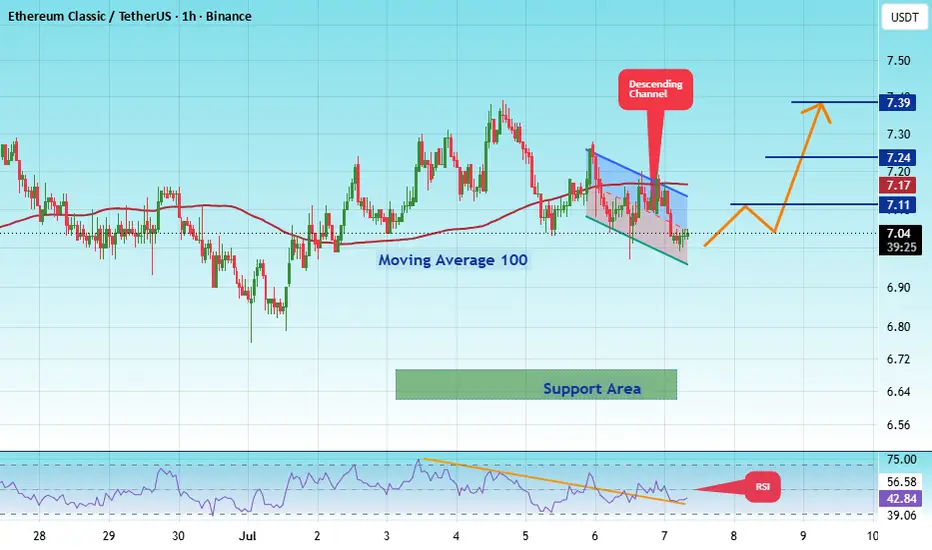
The price is moving within a descending channel on the 1-hour timeframe and has reached the lower boundary. It is now poised for a bounce and is expected to retest this boundary.
The Relative Strength Index (RSI) indicates a downward trend, which is likely to continue given the overbought conditions.
There is a key support zone (in green) at 6.62, and the price has bounced off this zone several times, making it a strong support level.
The price is trending towards the 100-period moving average, which we are approaching. This trend supports an upward move.
Entry Price: 7.04
Target 1: 7.11
Target 2: 7.24
Target 3: 7.39
Stop Loss: At the resistance zone (in green)
Remember this simple rule: Money Management.
Any questions? Please leave a comment.
Thank you.
ETC 4H – Symmetrical Triangle at Decision PointETC on the 4H timeframe is currently trading around 8.21 after ranging inside a symmetrical triangle since late May, with the two converging trendlines now pressing price into the apex as the structure approaches a resolution.
The chart shows a symmetrical triangle formed by a descending upper trendline originating from the May high near 8.40 and a rising lower trendline connecting the June 6 low near 6.43 through the June 25 low near 6.66 and the July 2 low near 6.82. Price has oscillated between both boundaries across the entire visible structure, with the upper trendline rejecting recoveries near 7.70–7.80 in mid-June and again near 7.60–7.70 in late June, while the lower trendline has caught each significant low with higher touches confirming its upward slope. Two horizontal reference levels sit inside the triangle — one near 7.20–7.25 and a second near 7.00–7.05 — both of which have acted as consistent pivots throughout the compression. The upper trendline is now declining into the 7.30–7.40 area while the lower trendline rises toward 6.90, leaving very little room remaining before a breakout is forced.
Price is currently sitting in the upper half of the triangle near 7.12, pressing toward the descending upper trendline with both lines converging rapidly into the apex.
Key Levels To Watch
→ 8.30–8.40 – May high, major resistance above
→ 7.90–8.00 – Prior consolidation zone, resistance
→ 7.60–7.70 – Prior recovery high, upper trendline rejection zone
→ 7.30–7.40 – Descending upper trendline, current overhead resistance (dynamic)
→ 7.20–7.25 – Horizontal pivot, inside triangle
→ 7.00–7.05 – Horizontal support, lower reference
→ 6.82–6.90 – Rising lower trendline, dynamic support (climbing)
→ Below 6.43 – Triangle breakdown, extended downside
A confirmed break above the descending upper trendline near 7.30–7.40 and a close above 7.60–7.70 would signal a bullish resolution out of the triangle, opening a move toward 7.90–8.00 and potentially a retest of the May high near 8.30–8.40.
A confirmed break below the rising lower trendline near 6.82–6.90 and a close beneath 7.00–7.05 would signal a bearish resolution, removing the only upward structure in place since the June low and opening downside toward 6.43 and potentially below.
Triangle apex approaching, breakout direction will define the next significant move. Break above 7.30–7.40 trendline → bullish resolution, eyes on 7.90–8.30. Break below 6.82–6.90 → bearish resolution, downside toward 6.43 and below. Bias neutral inside compression. Direction confirmed only on a decisive close outside either trendline.
#ETCUSDT The price is moving within an ascending channel#ETC
The price is moving within a descending channel on the 1-hour timeframe and has reached the lower boundary. It is now poised for a bounce and is expected to retest this boundary.
The Relative Strength Index (RSI) indicates a downward trend, which is likely to continue given the overbought conditions.
There is a key support zone (in green) at 6.57, and the price has bounced off this zone several times, making it a strong support level.
The price is trending towards the 100-period moving average, which we are approaching. This trend supports an upward move.
Entry Price: 7.03
Target 1: 7.10
Target 2: 7.25
Target 3: 7.42
Stop Loss: At the resistance zone (in green)
Remember this simple rule: Money Management.
Any questions? Please leave a comment.
Thank you.
ETC USDT LONG SIGNALETC/USDT – Trade Setup (LONG)
📈 Position Type: LONG
🕒 Timeframe: 1 H
📊 Market: Futures
💰 Entry Zone:
6.772
🛑 Stop-Loss:
6.400
🎯 Take-Profit Targets:
• TP1: 7.057
• TP2: 7.370
• TP3: 7.670
• TP4: 8
TP5: 8.300
TP6:
⚙️ Leverage:
5- 10
⚠️ After reaching TP1, move Stop-Loss to Entry Price.
📌 Risk Management:
Risk only 1–2% of your capital per trade.
Always confirm the setup on your chart before entry
etcusdt longInstructions:
Entry point: yellow
Stop loss: red
Take profit: green
👉Leverage x 5-10-20 for crypto
👉Leverage x 20-50-100 for commodities, stocks, indices, and forex
👉Margin 1-5% max.
Always practice risk and money management.
Invest a maximum of 5% on any trade or across all your trades.
Invest only what you can afford to lose, as no one is in control of the market.
👉Our analyses are primarily based on:
breakouts: two trend lines (ascending and descending) and a line indicating a horizontal breakout.
chart patterns: shoulders and head, triangle parttern, elliott impulse, etc etc.
We don't always have the time to track them at all times or to represent them visibly, given the numerous signals, the number of channels to manage, and especially because of the often rapid pace of market movements.
indicators: We associate at least two indicators with this technique.
👉Depending on the circumstances, we use specific indicators, often setting 3 or more take profit levels.
👉Indeed, there are good days in trading and also bad days. No one can promise to win every trade, and like all traders worldwide, we also experience stop-loss orders. However, we win more than we lose and remain positive.
👉You can close the position before or after the take profit orders indicated by the green lines if you are personally satisfied; the same applies to stop loss orders.
👉We must stay positive, clear-headed, and humble.
we cannot provide all instructions or all trades here on this channel.
Good luck to us all, and may God guide us. Amen.
ETC / ETCUSDT Bullish Setup | Futures Trade IdeaMARKET ANALYSIS
ETC is currently reacting from a key technical area highlighted on the chart.
As long as the protected support zone remains intact, the bullish market structure remains valid and higher liquidity targets may continue to attract price action.
A breakdown below the invalidation level would weaken the current bullish scenario and require a reassessment of market conditions.
📍 Entry, Stop Loss and Take Profit levels are marked directly on the chart.
━━━━━━━━━━━━━━
⚠️ DISCLAIMER
This publication is provided solely for educational and market observation purposes.
Nothing contained in this analysis should be considered financial advice, investment advice, or a recommendation to buy or sell any financial instrument.
All trading and investment decisions remain solely the responsibility of the individual trader.
Always conduct your own research and apply proper risk management before entering any position.
━━━━━━━━━━━━━━
🎯 PARALOG
▪️Crypto Market Analysis
▪️BTC Futures Signals
▪️Bitcoin & Altcoin Market Analysis
Precision • Momentum • Timing
━━━━━━━━━━━━━━
Exchange: #MEXC Futures
#bitcoin #btc #crypto #futures #technicalanalysis
Ethereum Classic—ETCUSDT 4X LONG with 1,656% profits potential Ethereum Classic for traders. I am sharing the numbers on all these setups because we are looking at true bottom prices and also very close to a trend reversal, making the current market conditions highly desirable.
This extreme buy-opportunity was made available only once before now, February 2026. So we get two chances to buy at true bottom prices, Feb & June 2026 then never again.
Good afternoon my fellow Cryptocurrency trader, I hope you are having a wonderful day.
If you are reading this now, you have great timing. If you've been reading non-stop for months, then your level of commitment, persistence and resistance is very strong. We are starting a new bullish cycle, Bitcoin and the Altcoins.
ETCUSDT hit bottom and is now turning green—you have to trust me.
Full trade-numbers below:
_____
LONG ETCUSDT
Leverage: 4X
Potential: 1656%
Allocation: 5%
Entry zone: $6.45 - $7.90
Targets:
1) $9.37
2) $11.1
3) $14.1
4) $16.2
5) $18.9
6) $22.2
7) $26.6
8) $31.3
9) $34.7
10) $39.1
Stop: Close weekly below $6.20
_____
Strategy and trading tips: There is no need to rush but neither any need to buy and rebuy on this trade. Rather than going all-in on one trade, it is better to open multiple positions following a sound plan focused on the long-term. Not all projects move and some grow more than others. Since there is never any rush and the market offers endless opportunities, let's go step by step.
We get to win one, then another one and another one, and so on. In order to win big, we start by winning small.
Develop the habit of winning first. That is, buy and hold, the market takes care of the rest. When a win is secured, do it again, and again and again and again. When we get the feeling of winning as a normal part of our trading days, then we can consider more advanced strategies for higher gains. After buying, just hold.
Thank you for reading, your continued support is highly appreciated.
Namaste.
ETC/USDT — Long at Breakout Retest, Recovery [Quantum Algo]ETCUSDT Perpetual
Context:
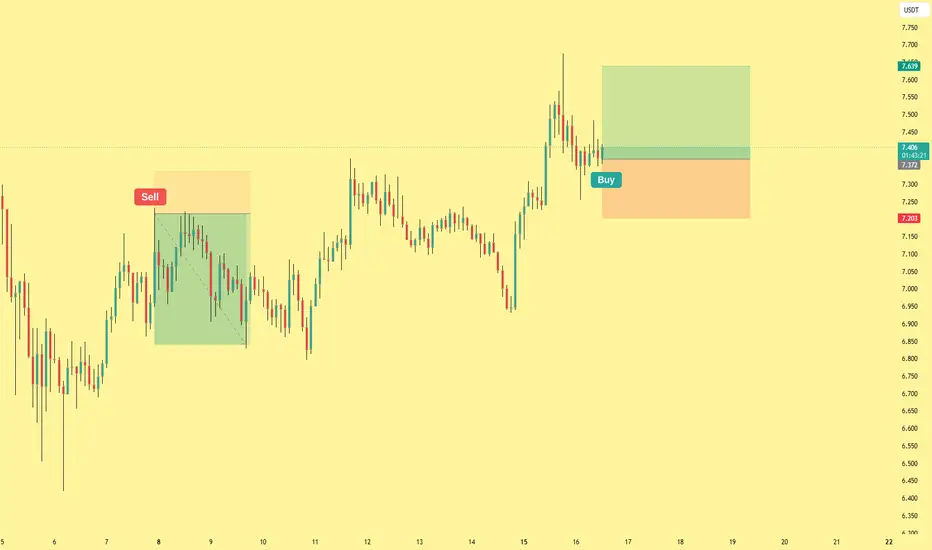
ETC has been recovering since the early-June lows around 6.70. The previous Sell signal at 7.20 already played out cleanly to the downside, reaching 6.80 before the bottom formed. Since then, price has built a strong recovery — pushing through resistance up to 7.65 — and is now pulling back to retest the breakout zone at 7.38, where a fresh Buy signal has fired.
Why this setup works — three confluences:
Previous Sell signal completed, counter-direction firing — the prior Sell delivered its full move. Now after the bottoming and recovery rally, a Buy signal is firing at the pullback. When directional signals complete and counter-signals trigger at structural zones, the cycle has rotated
Breakout retest of mid-range — price broke above the 7.30 resistance during the rally to 7.65. The current pullback is testing that same level from above. Old resistance flipping to support during a retest is one of the cleanest continuation patterns in price action
Higher low structure intact — the recovery from 6.80 has built a clear sequence of higher lows. The current pullback to 7.38 is the next higher low in that ascending structure. Until that pattern breaks, the bullish bias remains valid
A Buy signal fired at 7.384. We took it.
Trade management:
Entry: 7.384
Stop Loss: 7.203 — below the demand zone and recent structure
TP1: 7.500 — mid-range resistance, 50% off, stop to breakeven
TP2: 7.639 — extended target at the recent high for 100% exit
R:R: ~1:0.6 to TP1, ~1:1.4 to TP2.
Invalidation: Close below 7.203 — the higher low breaks and the recovery thesis fails.
The lesson:
The cleanest re-entries in a recovering market come on the first retest of a breakout level. Most traders chase the breakout itself, get filled at the top of the move, and stop out on the pullback. The smarter play is letting the breakout happen, waiting for the retest of the broken level, and entering when the signal confirms support. You give up the rush of the initial breakout in exchange for tighter risk and confirmed structure.
Signal fired. We took it. Update coming.
⚠️ Disclaimer: This is not financial advice. Trade ideas shared here are for educational and informational purposes only. All trading involves risk — past performance does not guarantee future results. Always do your own research and manage your risk accordingly.
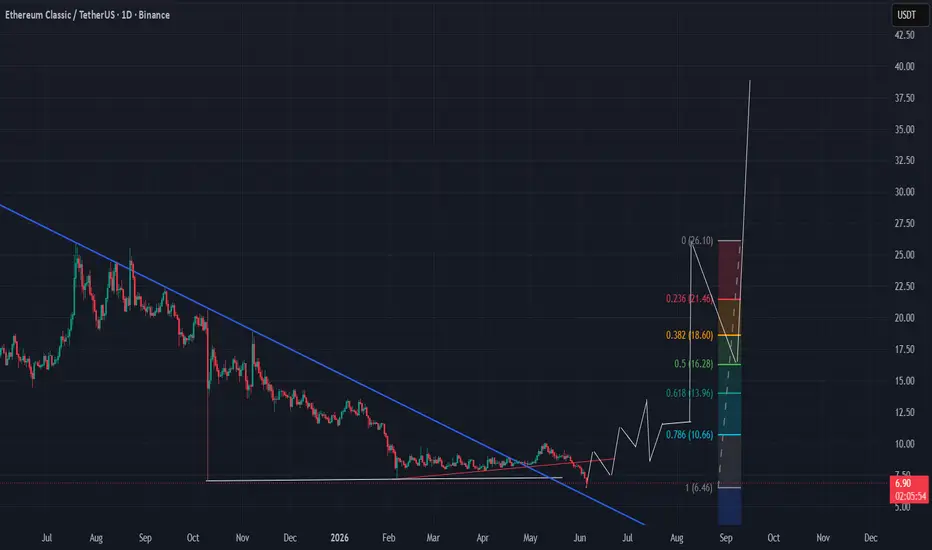
Ethereum Classic, a Trade for GloryThis asset is going to be a fast 5x return and even 7x is plausible.
Like BCH, ADA, XRP, ZEC;
Those dinausaur coins dont really spend time strolling around.
Once they have a go ahead, they really rumble the engine.
the Top for this asset in the Short - Medium term; +/- 4 months ; is going to be around 38 39 40 $
until then it will be a volatile ride with lots of long fast wicks creating springs
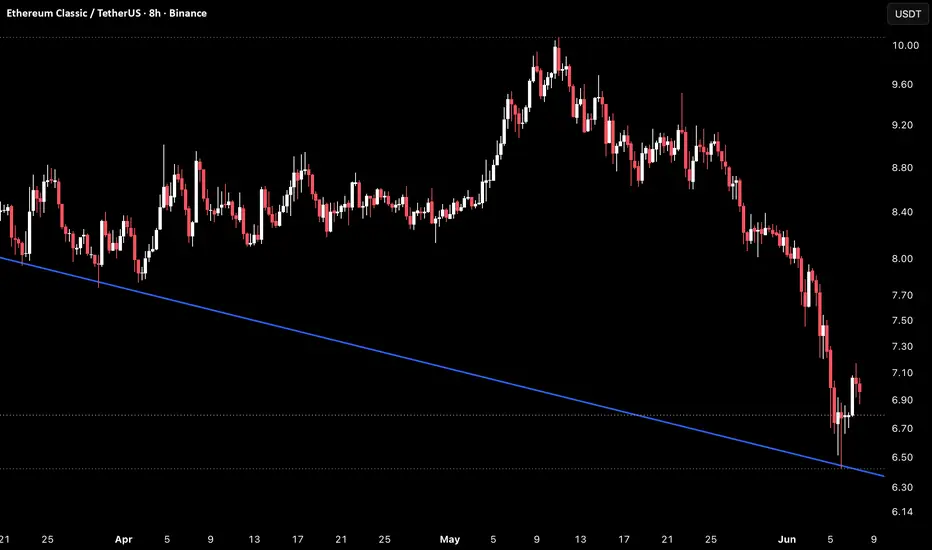
ETC 8H – Breakdown Below Trendline & Horizontal SupportETC on the 8H timeframe is currently trading around 6.98 after a sharp sell-off from the May high near 10.00 that accelerated in June, breaking through both the descending trendline from the March highs and the horizontal support floor near 6.90–7.10 in a fast and aggressive move.
Price briefly undercut the trendline near 6.50 before recovering slightly back to current levels, but is now sitting directly beneath the broken horizontal support at 6.90–7.10 which has flipped to resistance.
The descending trendline that had been acting as a macro ceiling throughout this chart continues to press down from above near 6.60–6.70 and is now also below current price, creating a squeeze from both sides.
Key Levels To Watch
10.00 → Prior high, major resistance above
8.80–9.20 → Prior range highs, key resistance
8.00–8.40 → Prior support zone, now resistance
7.30–7.50 → Prior support zone, now resistance
6.90–7.10 → Broken horizontal floor, now resistance
6.50–6.60 → Descending trendline, current area
Below 6.30 → No visible support, new lows likely
The structure is fully bearish. Both the descending trendline and the horizontal support floor have been broken and are now acting as overhead resistance, leaving price with no clear structural support below current levels.
A recovery back above 6.90–7.10 and the broken horizontal floor would be the minimum requirement for any shift toward stabilization.
Continued rejection below 7.10 keeps the path of least resistance toward 6.30 and new lows with no structure below.
Structure fully bearish below broken trendline and horizontal support.
Recovery only on reclaim of 6.90–7.10.
Below 6.30 opens room toward new lows with no structure below.
Ethereum Classic | Daily Range at a Critical Support ZoneEthereum Classic (ETCUSDT) | Daily Range at a Critical Support Zone ⚡📊
Hello to all TradingView traders and followers! 👋🌍
I hope you're having a profitable week in the markets. Today, we're taking a look at Ethereum Classic (ETC), one of the oldest and most recognized cryptocurrencies in the market. 🚀
Ethereum Classic is the original version of the Ethereum blockchain and continues to attract investors due to its decentralized nature, fixed monetary policy, and strong historical presence within the crypto ecosystem. While it may not receive as much attention as newer projects, ETC remains a respected asset that often experiences strong volatility during major market cycles. 💎⚡
📈 Technical Analysis
Looking at the Daily timeframe, price has been trading inside a clearly defined range structure for an extended period. 📦
The key support and resistance zones of this range are highlighted on the chart, and currently, price is trading very close to the lower boundary of the range, making this a critical decision area for the next major move. 🎯
🟢 Bullish Scenario
At the moment, buyers have an opportunity to defend the lower boundary of the range. If demand enters the market and price successfully holds this support zone, we could see a recovery move back toward the upper boundary of the daily range. 📈🔥
Bullish confirmation may include:
✅ Strong bullish reactions from support
✅ Higher lows forming on lower timeframes
✅ Increasing buying volume
✅ Successful defense of the range low
In this scenario, the first objective would be a move toward the top of the range, and if the upper resistance zone is eventually broken, the market could target the next major resistance area shown on the chart. 🚀
⚠️ Liquidity Sweep / Fake Breakdown Scenario
One important factor to consider is the possibility of a false break below support. 👀
Markets often sweep liquidity beneath major support levels before reversing higher. Therefore, even if price briefly breaks below the current support zone, it does not automatically invalidate the bullish outlook.
If a fake breakdown occurs and price quickly reclaims the range support, the focus would remain on long opportunities after confirmation. 📊💪
🔴 Bearish Scenario
The bearish case only becomes stronger if the daily support zone is decisively broken and accepted below. 📉
Key bearish confirmations:
🔻 Daily candle closes below support
🔻 Failure to reclaim the range low
🔻 Increased selling pressure and bearish structure formation
Only after a confirmed daily breakdown would short-selling opportunities become more attractive from a technical perspective. ⚠️
🎯 Trading Outlook
📌 Current location: Daily range support.
📌 Preferred scenario: Support holds and price rotates toward the range high.
📌 Aggressive buyers may look for lower-timeframe confirmation around current levels.
📌 A confirmed daily breakdown would shift the bias toward short positions.
Patience and confirmation remain the most important factors before entering any trade. ⏳
📊 Community Poll
What do you expect from ETC next?
🔘 Bullish bounce from support and move toward range highs 📈
🔘 Breakdown of daily support and continuation lower 📉
Share your opinion in the comments! 👇
⚠️ Disclaimer
This analysis reflects my personal opinion and is provided solely for educational purposes. It should not be considered financial advice. Always perform your own research, wait for proper confirmation, and manage risk appropriately before entering any position.
🏷️ Tags
#ETC #ETCUSDT #EthereumClassic #Crypto #Cryptocurrency #TradingView #TechnicalAnalysis #PriceAction #SupportAndResistance #DailyChart #RangeTrading #CryptoTrading #Altcoins #MarketAnalysis #SwingTrading #LongTrade #ShortTrade #RiskManagement #Blockchain #TradingIdeas 🚀📊⚡
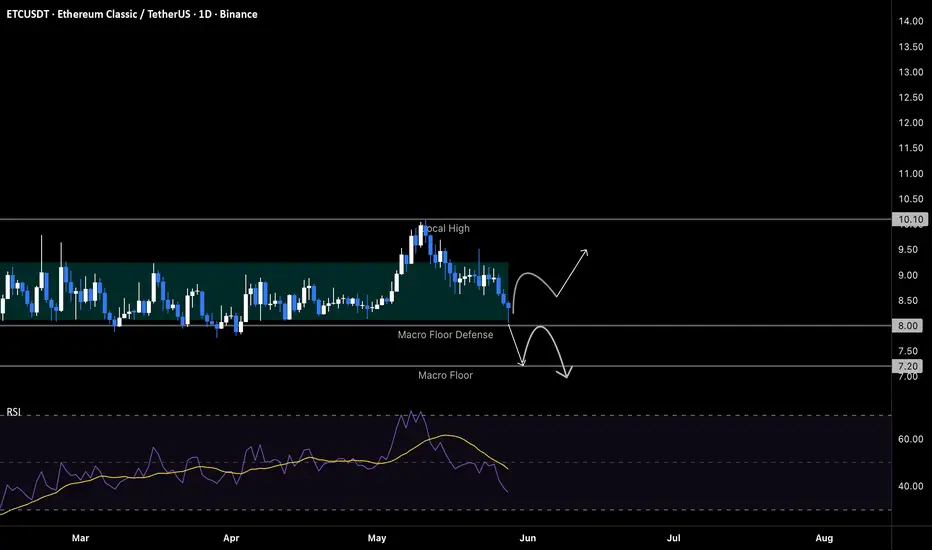
ETCUSDT at macro floor: $8.00 defense decides the next legThe Macro Picture 🗺️
ETCUSDT has spent four months carving an accumulation base between $8.00 and $9.30 after the January flush into the $7.20 macro floor. The May rejection at $10.10 sent price back to the lower boundary of that base, and now the $8.00 line sits as the defining decision zone — the level that determines whether the four-month structural reset holds or breaks into a deeper structural unwind. RSI in the low 30s mirrors February's capitulation conditions, but momentum has stalled rather than reversed. The next move out of this pocket sets the tone for the entire summer range.
The Setup ⚙️
The Floor: The $8.00 line marks the lower boundary of the four-month accumulation base and the level bulls have defended through repeated tests since February. Price sits at $8.30 pressing into this defense, with RSI confirming the stretched conditions.
The Buy Area: If $8.00 holds on a daily close basis, the $8.00–$8.50 pocket becomes a high-confluence reaction area where bulls reload and target a retest of the $9.30 mid-band on the way back toward the $10.10 local high.
The Sell Area: A clean breakdown through $8.00 triggers sell stops parked below the base and exposes the $7.20 macro floor. A sustained close below $7.20 turns the structural retest into a full unwind toward deeper macro support.
The Roadmap: Two paths sit on the table — bulls reclaim $8.50 and push toward $9.50+, or bears break $8.00 and drive into the $7.20 macro floor with continuation risk below. Invalidation of the bullish path: a sustained 1D close below $8.00. Invalidation of the bearish path: a reclaim of $8.50 on solid volume that flips the floor defense back into trend support.
ETC Showing Bearish SignalsThere is clear selling pressure on the chart, and after the bearish CH, price has continuously formed lower highs and lower lows across both internal and external structures.
We also have liquidity pools resting below the current price action, acting like magnets that attract price toward them. For this liquidity draw to happen, the market first needed to shift bearish — and now it has.
Price is expected to drop soon in order to sweep those liquidity pools.
We have two entry zones and will enter the position using a DCA strategy.
Targets are marked on the chart.
A daily candle close below the invalidation level will invalidate this analysis.
If you would like us to analyze a coin or altcoin for you, first like this post, then comment the name of your altcoin below.
What is your opinion about ETC?
#ETCUSDT The price is moving within an ascending channel#ETC
The price is moving within a descending channel on the hourly timeframe. It has reached the lower boundary and is trending towards a bounce. A retest of this boundary is expected.
The Relative Strength Index (RSI) indicates a downward trend, and this trend is likely to continue due to the overbought condition.
A key support zone (in green) was found at 8.30. The price has bounced off this zone several times, making it a strong support level.
The price is trending towards the 100-period moving average, which we are approaching. This trend supports an upward move.
Entry Price: 8.60
First Target: 8.71
Second Target: 8.86
Third Target: 9.06
You can close at the second target or wait for the third target to be reached. The choice is yours.
Stop Loss: At the resistance zone (in green).
Remember this simple rule: Money Management.
Any questions? Please leave a comment.
Thank you.