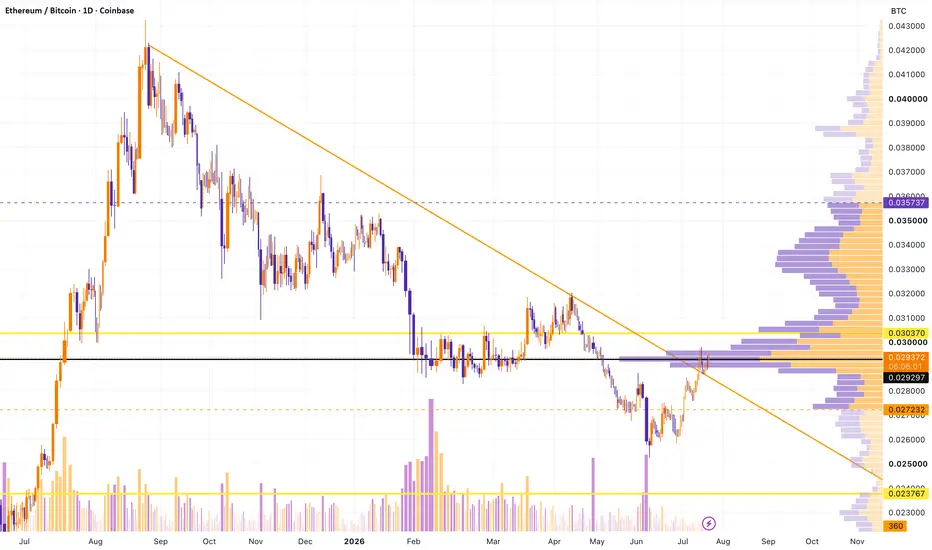
(ETHBTC) Altcoins Market Bullish Reversal Setup: A New CycleThis is a pretty interesting chart. ETHBTC almost works like an index for us. It peaked August 2025. Very strong reversal signals are present on this chart, signaling the end of the correction. Actually, the long-term correction already ended based on technical analysis. When ETHBTC grows, the altco
Compare with ETH/BTC
ETH/BTC - Important Retest Taking PlaceOne other chart for ETH worth examining is ETH/BTC. It is currently poised to start gaining strength against BTC, as long as the 200 MA on the daily continues to hold.
Through December 2025 and most of January 2026, the ETH/BTC ratio held the 200 SMA as a level of demand (green arrows). However, on
ETH/BTC - Predictive Target #1 Reached Here is an update to my last weekly ETH/BTC post:
Since that post, ETH has gone up 11% against Bitcoin. This is a strong development and follows closely with what I have been predicting for ETH over the past couple of weeks. For more context, go through the description linked above and review the
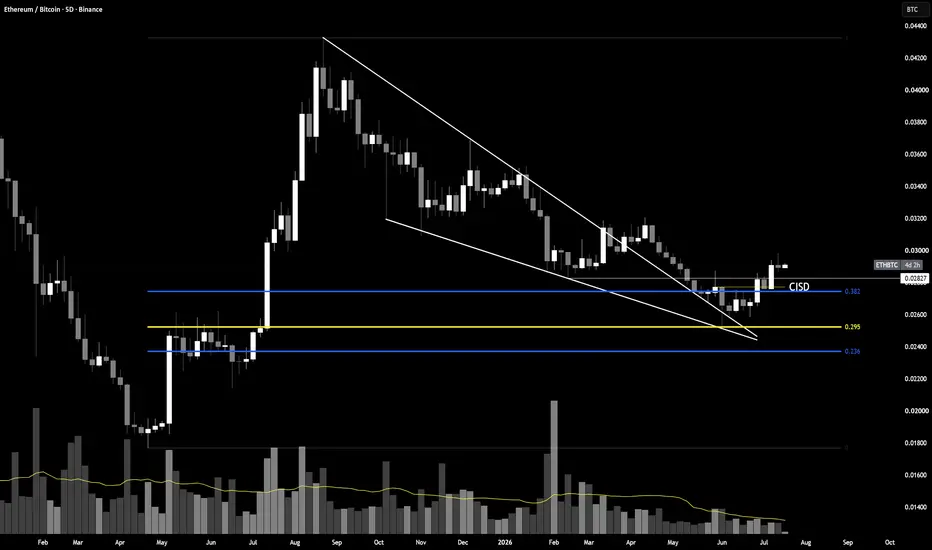
ETHBTC: Wedge Break Extends, Holding Above CISDThis is the same descending wedge from the earlier ETHBTC idea, worth revisiting now that price has moved further from the reclaim.
The wedge itself hasn't changed, ten-plus months of lower highs off the September peak, compressing into the same apex near the 0.295 to 0.382 OTE zone that's marked t
ETH/BTC - which way do we go George?ETH/BTC
Red- Resistance
Green- Support
White- Indicators/Point of Control
Stars: Targets
I think it is a good time to be stacking ETH right now as we are still in bear market territory. There has been a lot of bullish sentiment around ETH and a lot of ETH ETF activity recently; Smart money, whales,
ETHBTC: Wedge Reclaim Confirmed by CISD at 0.382Gate one, the descending wedge off the September high has been the dominant structure for ten months, each touch of the upper boundary rejecting cleanly until this one.
Gate two, price compressed into the wedge apex and tested the 0.295 to 0.382 fib band on approach, the same OTE zone marked as the
ETH/BTC Is Hinting at a Short-Term Altseason While Bitcoin continues to dominate headlines, the ETH/BTC pair may be quietly approaching one of the most important technical inflection points in years.
Historically, sustained strength in ETH/BTC has often coincided with periods where capital rotates from Bitcoin into the broader altcoin market.
See all ideas
Summarizing what the indicators are suggesting.
Oscillators
Neutral
SellBuy
Strong sellStrong buy
Strong sellSellNeutralBuyStrong buy
Oscillators
Neutral
SellBuy
Strong sellStrong buy
Strong sellSellNeutralBuyStrong buy
Summary
Neutral
SellBuy
Strong sellStrong buy
Strong sellSellNeutralBuyStrong buy
Summary
Neutral
SellBuy
Strong sellStrong buy
Strong sellSellNeutralBuyStrong buy
Summary
Neutral
SellBuy
Strong sellStrong buy
Strong sellSellNeutralBuyStrong buy
Moving Averages
Neutral
SellBuy
Strong sellStrong buy
Strong sellSellNeutralBuyStrong buy
Moving Averages
Neutral
SellBuy
Strong sellStrong buy
Strong sellSellNeutralBuyStrong buy
Displays a symbol's price movements over previous years to identify recurring trends.