

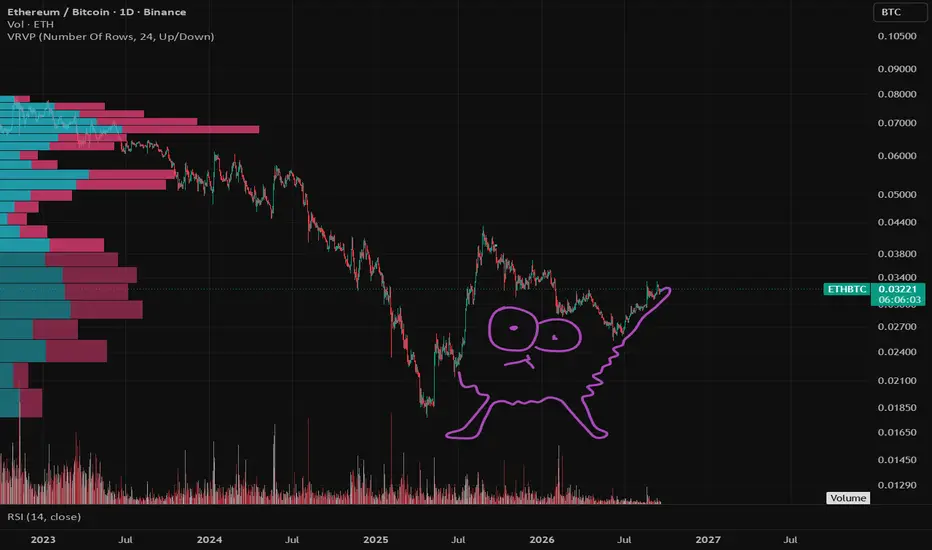
Compare with ETH/BTC
ETHBTC | 1DETHBTC is currently showing a significant structural recovery on the daily timeframe after a prolonged bearish phase that pushed price from the 0.035–0.036 resistance region into the major demand zone around 0.025–0.026.
The market previously formed a clear sequence of lower highs and lower lows, bu
Long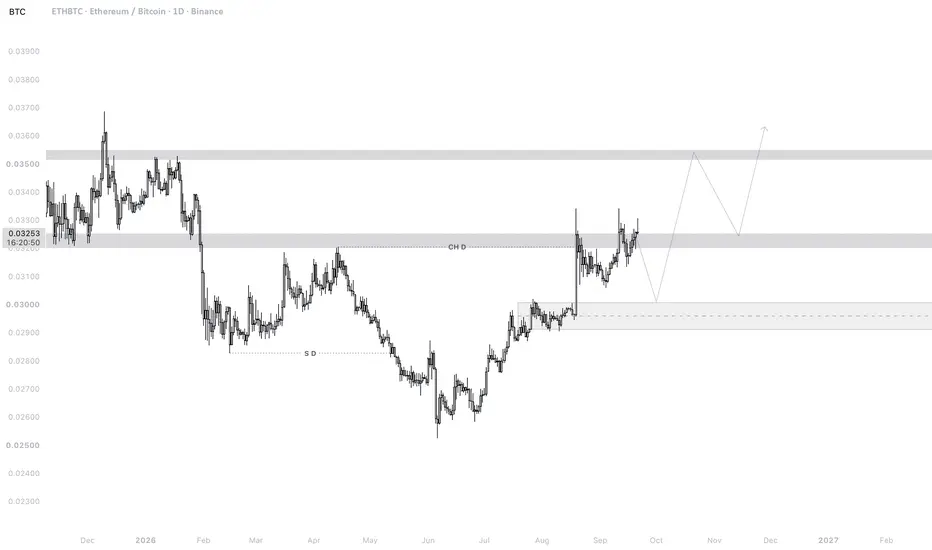
Ethereum will outperform Bitcoin.The last 5 years have been brutal for both Ethereum and altcoins.
You’d better pack your bags. Markets move in cycles, and Ethereum’s - and altcoins’ - time will come.
BTC.D — too high
ETH/BTC — too low
PMI — >50
GOLD — too high
Long
$ETHBTC breaking out Eth will outperform btc in coming months
The chart says it all.
Breaking out of trendline after long time.
Patience will be rewarded.
Long
ETH/BTC - Potential Double Top FormingSo far, ETH/BTC has double topped on the lower timeframe. On August 19, 2026, the ratio topped at 0.03342, and today, September 11, 2026, the ratio has once again topped at 0.03342.
It is too early to confirm this, as today still has plenty of time left before the close, but I wanted to point this

One last pump for ETHBTC before the big dump.March 2022 vibes. ETH has one last mini pump before it falls off the cliff versus BTC and it's USD pair.
Short between 0.3345 and 0.34
Not financial advice.
Short
ETHBTC weakness vs SOLBTCMost altcoins will just bleed forever against BTC. This has been the case with all majors, including the biggest one, ETH, that's been on a massive 9 year downtrend against BTC.
Over this last cycle we saw Solana totally dominate the industry while Ethereum lagged badly. As a result, we got the nas
 Short
Short
ETH/BTC — One More Leg Down Before the Bull RunI know you've probably seen so many Bitcoin/USD charts, Ethereum/USD charts, and different ideas by now that you might be getting tired of them...
So here, I want to look at a different idea: Ethereum against Bitcoin (ETH/BTC).
In my view, before the start of Ethereum's next bull run — after all the
Short
ETH/BTC 1D – Retesting Trendline After Outperformance SpikeEthereum against Bitcoin is trading around 0.03142 on the daily timeframe after pulling back from the recent spike to 0.03390, now sitting almost exactly on the ascending trendline that has defined this ratio since the June lows.
This is the same structure flagged in our earlier update on this pair

See all ideas
Summarizing what the indicators are suggesting.
Oscillators
Neutral
Oscillators
Neutral
Summary
Neutral
Summary
Neutral
Summary
Neutral
Moving Averages
Neutral
Moving Averages
Neutral
Displays a symbol's price movements over previous years to identify recurring trends.