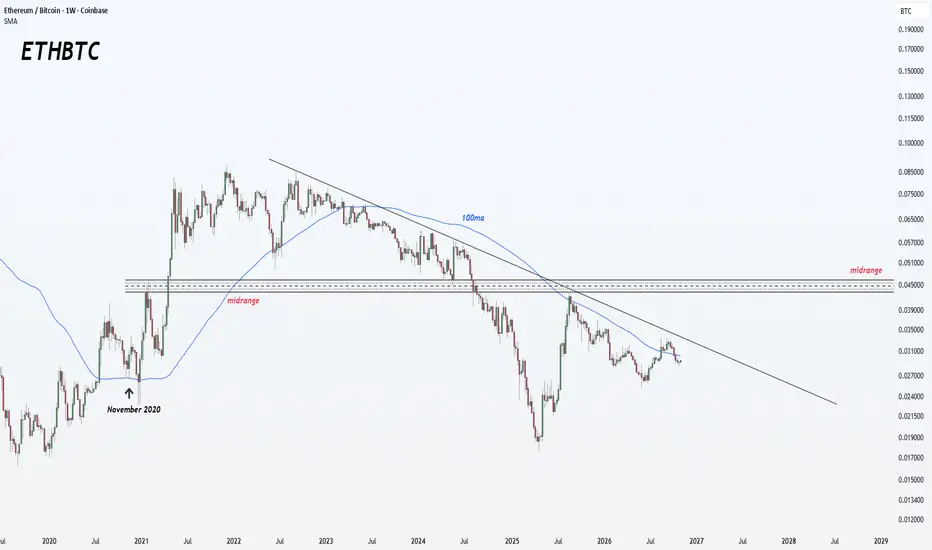
ETHEREUM NEEDS TO SHOW STRENGTH AGAINST BITCOIN ETHEREUM NEEDS TO SHOW STRENGTH AGAINST BITCOIN
One mistake traders make is analysing ETH only against the dollar.
I also watch the ETH/BTC pair.
Why?
🔹 ETH/BTC rising = CRYPTOCAP:ETH outperforming BTC.
🔹 ETH/BTC falling = CRYPTOCAP:BTC showing relative strength.
🔹 A confirmed breakout can si
Ethereum / Bitcoin
No trades
No trades
Peers for comparison
Open interest
Open interest
Price
Liquidations
Long
Short
Price
ETH/BTC NEXT ROTATION6 years ago, Ethereum was preparing for one of its most important expansions against Bitcoin. Today, we are approaching another historical decision
In November 2020, ETH/BTC was recovering from years of weakness. The 0.045 region became a critical barrier before Ethereum eventually entered a powerf
W pattern on ETHBTC means the crypto bias is bullish UFNI have been tracking this W pattern forming on ETH BTC for years. And it is still operating exactly like W pattern should.
What does that mean? My bias is bullish for crypto. Sure we are going to get multi-month consolidations or pull backs but until the price action on ETHBTC is at a major stop
ETH/BTC — One More Leg Down Before the Bull RunI know you've probably seen so many Bitcoin/USD charts, Ethereum/USD charts, and different ideas by now that you might be getting tired of them...
So here, I want to look at a different idea: Ethereum against Bitcoin (ETH/BTC).
In my view, before the start of Ethereum's next bull run — after all the
ETH Is Losing to Bitcoin. ETH/BTC Down 8% This QuarterEthereum has lost ground to Bitcoin every single week this quarter.
ETH/BTC weekly closes since the quarter started: 0.03152, 0.03029, 0.02937, 0.02908. Right now it's around 0.02896, about 8% below where Q4 began.
The Q4 map comes from the Q3 range on weekly bars: high 0.03342, low 0.02758, close
The Eth/Btc Chart No One is Talking AboutI want there to be an altseason, I want a ton of alts to fly to the moon and have a crazy fun time. ETH/BTC has broken under a trendline from 2019, never even managed to make it back to it's 2017 highs in the previous cycle. I don't understand how someone can look at this and not worry for the futur
ETHBTC Elliott Wave: Correction Nearing CompletionThe ETHBTC pair is showing a nice bullish setup formation. After recently identifying a five-wave impulse into wave A/1, we can now see an abc correction developing within the projected wave B/2. This corrective structure may be slowly approaching completion, with potential support in the 0.028–0.02
ETH/BTC - Respecting the 200 ETH/BTC is building phenomenal market structure, which could mean ETH is almost ready to start gaining strength against Bitcoin again.
The 200 SMA
First, note how ETH/BTC has acted around the 200 SMA (blue). I have outlined with black arrows every time the ratio has been below or above this key m
ETH/BTC - Looks All Good Under the HoodETH/BTC is looking impressive here. Potentially a good looking ~ flat/expanded flat 3-3-5. A nice looking wick through the 1.618 level ( wave c = wave a × 1.618 (log scale) ). This correction could be done here.
On the lower time frame, the 5th minute wave of C appears to be an ending diagonal, a
ETHBTC: Potential Breakout Toward 0.064 BTCETHBTC is trading near 0.0302 on the daily chart. If price holds above the rising support and confirms a breakout from the long-term downtrend, the chart points to a potential move toward 0.058–0.064 BTC.
The setup is invalidated below 0.0252 BTC. This is a speculative technical scenario, not a gu
See all ideas
Summarizing what the indicators are suggesting.
Oscillators
Neutral
Oscillators
Neutral
Summary
Neutral
Summary
Neutral
Summary
Neutral
Moving Averages
Neutral
Moving Averages
Neutral
Displays a symbol's price movements over previous years to identify recurring trends.