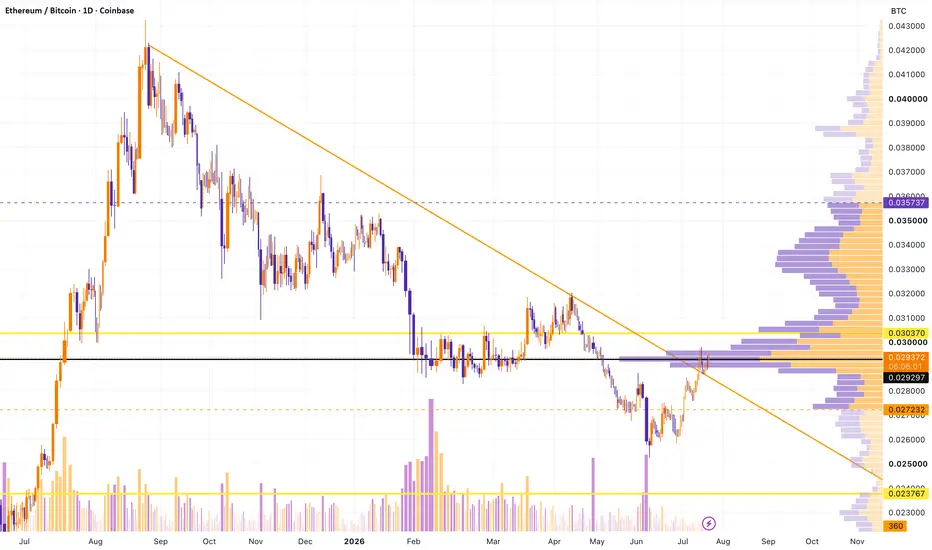
ETH/BTC - Important Retest Taking PlaceOne other chart for ETH worth examining is ETH/BTC. It is currently poised to start gaining strength against BTC, as long as the 200 MA on the daily continues to hold.
Through December 2025 and most of January 2026, the ETH/BTC ratio held the 200 SMA as a level of demand (green arrows). However, once ETH/BTC confirmed a close below this key moving average on January 20, 2026, a massive decline followed which brought the ratio down to a significant low on June 6, 2026.
I pointed this out in a previous idea I recommend reviewing:
From that post, price did appreciate up to the 0.03 level. I made a follow up post when that occurred, which you can review here:
As I stated in that idea, price still has a significant resistance zone it is struggling to clear between 0.03 and 0.031.
With the lower timeframe structure currently being built, if the ratio can hold above the 200 MA, there is a real chance that resistance zone will be tested again and potentially broken. That could lead to a significant increase in ETH's value relative to BTC.
Even the ETH/USD chart is aligning with what looks like early signs of a larger upside move approaching. You can review that idea here:
In-depth trading ideas
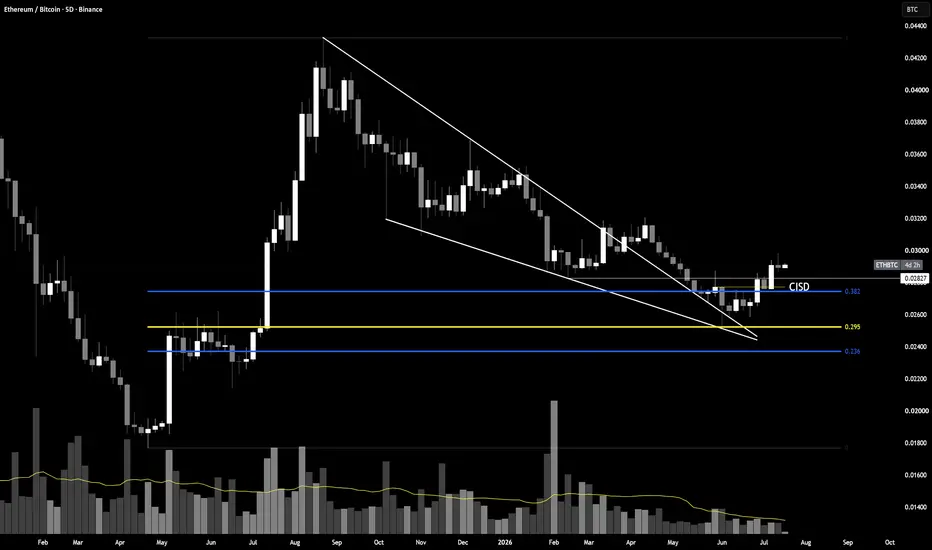
ETHBTC: Wedge Break Extends, Holding Above CISDThis is the same descending wedge from the earlier ETHBTC idea, worth revisiting now that price has moved further from the reclaim.
The wedge itself hasn't changed, ten-plus months of lower highs off the September peak, compressing into the same apex near the 0.295 to 0.382 OTE zone that's marked the reaction level across this entire dataset. What's changed is the follow-through. CISD confirmed the boundary reclaim at 0.02827, and price hasn't just held above it, it's extended to 0.02922, clearing the immediate zone with room.
That's the difference between a reclaim and a confirmed regime shift under Continuation Acceleration Protocol. A single close above a boundary is gate three. Multiple candles holding and extending above it, without giving the level back on the first retest, is what turns a CHoCH-type signal from candidate into something the market has actually accepted.
Volume remains the caveat here, same as it was in the original idea. The decline across the wedge's full duration happened on shrinking participation, and the reclaim so far hasn't reversed that trend meaningfully. Structure has confirmed. Volume hasn't yet caught up to confirm it a second way.
The OTE zone at 0.236 to 0.382 has now been tested and held on the retest, not just touched once. That's the kind of repeat confirmation that carries more weight than a single reaction, the same standard this feed has applied to every OB and fib zone that's mattered this month.
What invalidates this: a close back below 0.02827, giving back the CISD level entirely. What confirms continued strength: holding above it through further tests, ideally with volume finally picking up to match the structural shift.
Marcus Aurelius wrote that the impediment to action advances action. Ten months of rejection was the impediment. This is the first time the reclaim has actually extended instead of immediately fading.
ETH/BTC - Predictive Target #1 Reached Here is an update to my last weekly ETH/BTC post:
Since that post, ETH has gone up 11% against Bitcoin. This is a strong development and follows closely with what I have been predicting for ETH over the past couple of weeks. For more context, go through the description linked above and review the other charts referenced within that idea.
In that last idea I stated: "First, ETH/BTC is likely to rally back toward the 3% ratio, putting the pair around 0.030 to 0.031 once it makes contact with the orange dotted trendline."
As of today, July 27, 2026, ETH/BTC hit a high of 0.0302 and could see some slight near term weakness against BTC from here. The real strength for ETH against Bitcoin will come when the ratio breaks decisively above these levels, and as always I will make a dedicated post when that trend momentum fully shifts.
This is also worth cross referencing with this earlier idea:
In that idea I had my upside target for ETH outlined between 0.030 and 0.0303. Today price reached exactly 0.0302, landing almost precisely at the top of that box:
I will have a further post for ETH/USD coming out later today, so keep an eye out for that.
ETH/BTC - which way do we go George?ETH/BTC
Red- Resistance
Green- Support
White- Indicators/Point of Control
Stars: Targets
I think it is a good time to be stacking ETH right now as we are still in bear market territory. There has been a lot of bullish sentiment around ETH and a lot of ETH ETF activity recently; Smart money, whales, and institutions are positioning themselves for the next leg up, whenever that might occur.
Target 1: 0.04 BTC
Target 2: 0.05 BTC
Target 3: 0.06 BTC
Target 4: 0.07 BTC
Not financial advice. DYOR and invest at your own peril.
Best of luck everyone! =)
ETHBTC: Wedge Reclaim Confirmed by CISD at 0.382Gate one, the descending wedge off the September high has been the dominant structure for ten months, each touch of the upper boundary rejecting cleanly until this one.
Gate two, price compressed into the wedge apex and tested the 0.295 to 0.382 fib band on approach, the same OTE zone marked as the long entry region on this chart, before the current push through the upper boundary.
Gate three, CISD confirmed the shift at 0.382, the control bar reclaiming the boundary with a clean close rather than a wick poke through it. Under Continuation Acceleration Protocol, CISD functions the same way CHoCH does on the intraday charts, a state-of-delivery change that only counts once the close confirms it, not the touch.
The OTE zone marked here, 0.236 to 0.382, is the same region that's produced the reaction on every major low across this entire dataset, going back to the May 2025 impulse candle that started the original wedge in the first place. That's not a coincidence of drawing tools, it's the same zone doing the same job across more than a year of price action.
Volume has been declining across the wedge's entire duration, the compression happening on shrinking participation rather than expanding pressure. A boundary reclaim on a base that thin carries less certainty than one with expansion behind it, worth being direct about that limitation.
What invalidates this: a close back inside the wedge, below 0.382. What confirms it: continued acceptance above the boundary, ideally with volume finally picking up rather than continuing to fade.
Marcus Aurelius wrote that the impediment to action advances action. Ten months of rejection at this trendline was the impediment. CISD is the first close that didn't repeat it.
ETH/BTC Is Hinting at a Short-Term Altseason While Bitcoin continues to dominate headlines, the ETH/BTC pair may be quietly approaching one of the most important technical inflection points in years.
Historically, sustained strength in ETH/BTC has often coincided with periods where capital rotates from Bitcoin into the broader altcoin market. Although no single chart can confirm an altseason, the current technical structure suggests that Ethereum may soon begin outperforming Bitcoin once again.
Monthly Timeframe
The monthly chart suggests that ETH/BTC remains within a multi-year W-X-Y corrective structure that has been developing since the 2017 peak.
Rather than approaching the completion of Wave X itself, the current price action appears to be unfolding within a contracting triangle that forms Wave X. Based on this interpretation, ETH/BTC is now nearing the completion of Wave D, leaving one final Wave E before the larger corrective phase concludes.
This distinction is important because triangle patterns typically represent continuation structures. Instead of signaling the end of the correction immediately, they often indicate that the market is preparing for one final swing before the dominant trend resumes.
The current Wave D advance is expected to test the long-term descending trendline and the upper boundary of the triangle, where resistance may emerge. Should that scenario play out, a corrective Wave E would likely follow, potentially completing the entire Wave X structure.
Once Wave X is complete, the larger Wave Y could begin, marking the next major leg higher in ETH/BTC and potentially setting the stage for a period of Ethereum outperformance relative to Bitcoin.
Daily Timeframe
The daily timeframe provides a closer look at the development of the monthly Wave D.
Following the apparent completion of Wave C near the 0.618 Fibonacci support, ETH/BTC has begun advancing toward the upper boundary of the larger contracting triangle identified on the monthly chart.
Rather than viewing this advance as the beginning of a new long-term impulsive trend, I currently interpret it as Wave D of the higher-timeframe triangle.
From here, the path of least resistance remains higher as long as the current structure remains intact. The primary objective is the confluence formed by the 0.272 Fibonacci retracement, the descending trendline, and previous resistance around 0.054 BTC.
Should price reach this region, it would satisfy the expected termination zone for Wave D and potentially set the stage for the final Wave E, completing the larger Wave X triangle before the next major phase develops.
Why a Short Term Altseason?
At this point, some may wonder why I'm referring to this setup as a short term altseason if the larger Wave X correction has not yet completed.
The answer lies in Glenn Neely's time based analysis.
Based on Neely's guideline for corrective structures, Wave C within Wave D is projected to require approximately 163 days from the recent bottom before reaching completion. This suggests that the current advance is not merely a brief rally lasting a few weeks, but rather a move that could unfold over several months.
If this time projection proves accurate, ETH/BTC would have sufficient time to outperform Bitcoin on a relative basis, creating an environment in which many altcoins may also begin to outperform. While I do not expect this to represent the beginning of the next major multi year altcoin cycle, it does support the possibility of a meaningful short term rotation into altcoins before the larger Wave E correction develops.
In other words, my expectation is not that the entire higher timeframe correction has ended. Instead, I believe the market may first experience a sustained Wave D advance that could last approximately 163 days before the final Wave E completes the larger Wave X triangle.
Markets rarely reward the crowd at obvious turning points. Instead, they tend to reveal subtle shifts in structure long before the broader narrative changes. If the current Elliott Wave count and time based analysis continue to unfold as expected, ETH/BTC may be signaling the beginning of a meaningful period of relative strength for Ethereum, laying the foundation for a short term rotation into the broader altcoin market.
ETH - BTCTrump often says that the US will become the crypto capital. So it will be, not exactly crypto, but a lot will start with stablecoins and smart contracts, and ETH is the progenitor of smart contracts.
I expect good growth in ETH for the US midterm elections, since the Republicans no longer have other tools to increase the electorate this season.
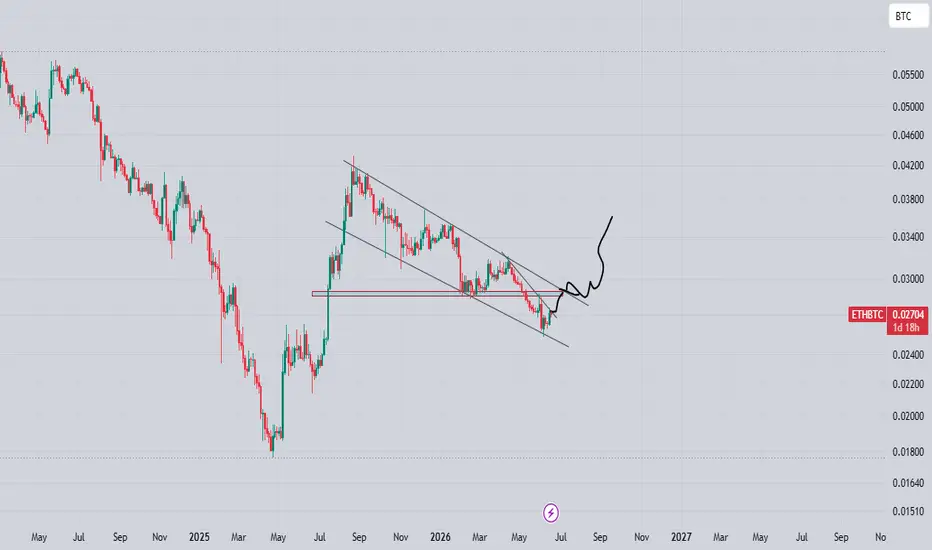
ETH/BTC: 315-Day Descending Channel Nearing BreakoutETH/BTC has been trading inside this descending channel for 315 days, and price is finally approaching a key decision point.
The current move is testing both the upper trendline and the 0.618 Fibonacci level. If buyers can reclaim this area with a strong weekly close, it could be the first sign that momentum is shifting.
Bullish targets:
TP1: 0.03059
TP2: 0.03411
TP3: 0.03814
For now, I want to see confirmation first. If that comes, this structure has plenty of room to expand.
What do you think, does ETH finally outperform BTC from here, or does the channel hold again?
eth can give strong recovery The ETH/BTC pair has been trading within a well-defined range for quite some time and has now reached a key technical area after undergoing a healthy correction. The overall structure still suggests the possibility of a bullish recovery, with price continuing to respect the broader range. At the moment, ETH/BTC is testing a major confluence zone where the horizontal resistance, the quarterly Standard Pivot resistance, and the descending trendline all meet. This creates a strong resistance junction that is likely to determine the next significant move. A confirmed breakout above all three confluences would be a highly bullish signal and could trigger a strong recovery in Ethereum against Bitcoin over the coming days or weeks. If the breakout is supported by momentum and volume, it may offer a high-probability opportunity for a sustained upward move, providing traders with a relatively steady and lower-risk profit potential. As always, patience is essential—waiting for a confirmed breakout is far safer than anticipating the move before confirmation.
Can ETH outperform BTC despite crypto outflows?Can ETH sustain its outperformance against BTC amid continued net capital outflows from the crypto market?
Fundamental analysis
1. After Ethereum (ETH) underperformed Bitcoin (BTC) for some time, ETH has now started to outperform BTC again. This is because ETH is a higher-beta asset than BTC. Therefore, when Bitcoin was in a downtrend, ETH fell more sharply. However, as Bitcoin is now starting to show signs of a rebound, ETH has begun to outperform BTC. When the market shifts into a risk-on environment, ETH usually moves more strongly than BTC, as investors see greater upside potential from real-world utility and ecosystem growth, rather than viewing it purely as a store-of-value asset.
2. However, ETH’s current outperformance may be temporary, as the broader crypto market is still seeing net ETF investor outflows. Therefore, the market may need more time before a clear bullish reversal can be confirmed.
Technical analysis
3. ETHBTC bounced above the last swing high, and the price has started to form higher swings, indicating short-term bullish momentum. However, in the bigger picture, the price remains within a descending channel, suggesting that the long-term trend is still bearish. This is also consistent with the bearish EMA stack.
4. ETHBTC needs to break above the descending channel’s upper bound around 0.03 to confirm a reversal.
5. If ETHBTC fails to break above the channel, the price may retreat toward the channel’s lower bound again.
Analysis by: Krisada Yoonaisil, Financial Markets Strategist at Exness
ETHBTC: Wedge Compresses, CISD Marks the ShiftTen months of lower highs. A clean descending wedge off the September top, price grinding into its own apex by July. That's not distribution. Distribution needs volume. This had the opposite: the volume MA has been sloping down the entire structure, expansion getting harder to find on every leg lower.
Compression with fading volume is absorption, not exhaustion of demand. Wyckoff would call this a shakeout into a spring, not a markdown. The supply doing the selling was getting weaker with every touch of the lower boundary, not stronger.
After a A precision love tap on the sweet spot of the OTE followed by a CHoCH, price just closed back above the upper wedge trendline. CISD confirms it. The state of delivery changed here, not at some retest three candles from now. Gate one: reclaim the boundary. Gate two: hold it. This satisfies gate one.
What invalidates this: a close back inside the wedge. If ETHBTC gives the trendline back on the next few candles, this was a false break and the compression continues. Until then, treat the boundary as the line in the sand, not the confirmation.
Marcus Aurelius wrote that the impediment to action advances action. The wedge was the impediment. Ten months of it. What happens next isn't a prediction, it's a function of whether the boundary holds.
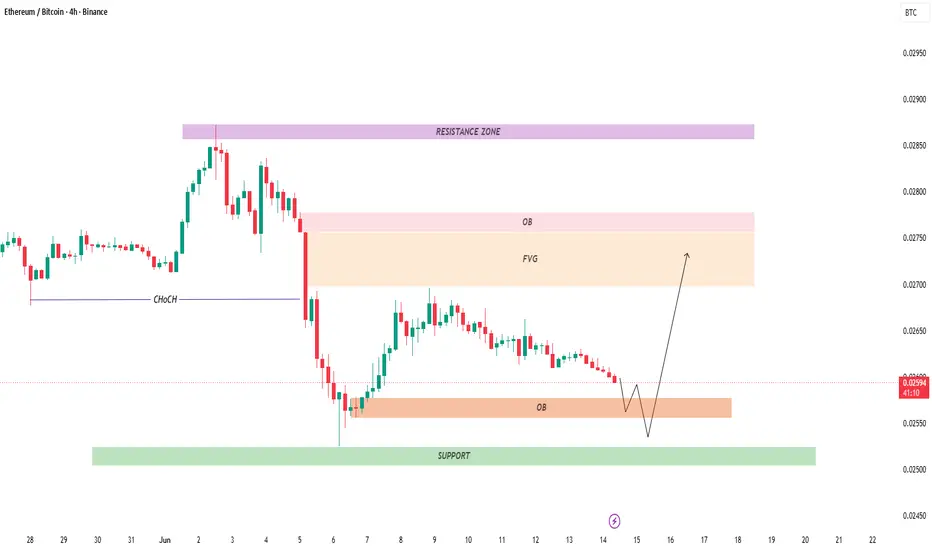
ETH/BTC 4H Analysis – Bullish Reversal Setup📊 ETH/BTC 4H Analysis – Bullish Reversal Setup 🚀
🔍 Market Structure
ETH/BTC remains in a broader bearish structure after a strong breakdown below the marked CHoCH (Change of Character) level. However, price is now approaching a significant demand area where buyers previously stepped in.
🟢 Key Support Zone
Strong support located around 0.0250 – 0.0253
Current price is trading just above this zone.
A successful defense of support could trigger a relief rally.
📦 Bullish Confluence Area
Above current price lies a cluster of:
Order Block (OB)
Fair Value Gap (FVG)
Liquidity imbalance
These areas often attract price during corrective moves and could act as upside targets.
🎯 Potential Bullish Scenario
✅ Price sweeps liquidity below the local lows
✅ Strong reaction from support zone
✅ Break of short-term bearish structure
✅ Rally toward the FVG / OB zone (0.0270 – 0.0278)
⚠️ Risk Factor
A clean 4H close below the support zone would invalidate the bullish setup and could open the door for further downside.
🧠 Trading Outlook
📉 Short-term momentum remains weak, but price is sitting at a high-probability demand zone.
🚀 As long as support holds, the chart favors a bullish recovery toward the FVG and Order Block area. 🎯
ETH/BTC - Weekly Strength DevelopingBased on what has developed since last night, it is very important to examine the ETH/BTC chart. It is giving early signals that the bottom has been established and as flows stabilize across the broader market, ETH should begin reclaiming some of its dominance relative to Bitcoin. I outlined the early stages of this once before, but now on the weekly timeframe even more signs are emerging. Let's break them down:
What Is ETH/BTC?
Before diving in, it is worth explaining what the ETH/BTC chart actually measures, as it is one of the most important and underappreciated metrics in crypto.
The ETH/BTC ratio shows the relationship between the value of Ethereum and the value of Bitcoin. For example, the current ratio of 0.0278 means that 1 ETH is equivalent to 2.78% of 1 Bitcoin. Put another way, it tells you how much of a Bitcoin you would need to spend to buy one Ethereum.
This metric matters because ETH is historically the leading indicator for the broader altcoin market. When ETH begins to strengthen against Bitcoin it typically signals that risk appetite is returning to the crypto market and that altcoins as a whole are beginning to see renewed interest. I have been outlining the early signs of this developing across the broader altcoin market here as well:
Over the past 12 hours a major development has occurred on the ETH/BTC chart. From the weekly close to now, ETH/BTC has increased by 3.73%, bouncing perfectly from oversold conditions on the RSI. This shows that market participants are actively converting their Bitcoin into ETH at this ratio, and it has occurred right below the golden pocket I outlined in my previous ETH/BTC idea.
What to Expect Next
With this strength now showing, here is what the structure suggests should follow.
First, ETH/BTC is likely to rally back toward the 3% ratio, putting the pair around 0.030 - 0.031 once it makes contact with the orange dotted trendline. Once that orange dotted trendline is broken, ETH will begin to see significant appreciation compared to Bitcoin.
The next major move from there would be nearly a 2x from the current ratio, putting ETH/BTC around the 5% level. This would align with both the 0.236 Fibonacci of the macro trend and the legacy trendline on the monthly chart.
The Legacy Trendline
This legacy trendline dates all the way back to January 2016 and up until October 2024 it acted as the floor for ETH/BTC throughout its entire history. October 2024 marked the point where focus shifted almost entirely onto Bitcoin around Trump's pre-election victory, leading to a breakdown of this trendline. Upon that breakdown, ETH/BTC saw multiple monthly candle body rejections at the legacy trendline in November 2024 and again in August 2025.
I am projecting that the next candle body rejection will occur at the legacy trendline once again. Depending on timing it is difficult to say exactly what the ratio will be at that point, but most likely it will align with the 5% level.
I also have the 40 level marked on the monthly RSI. This level has acted as a pivotal turning point throughout the entire lifespan of ETH/BTC, and the real sustained strength should emerge once the 40 level of momentum is reclaimed.
In addition to all of the above, a potential monthly doji reversal is forming right within the golden pocket of ETH/BTC's current Fibonacci trend:
There are still 15 days until the monthly close, but this is another early sign that indecision is entering the downtrend and buyers are beginning to step in and convert their Bitcoin to ETH at these lower ratio valuations.
I will be updating this weekly USD chart for ETH next so keep an eye out for that:
ETH/BTC - Major Underlying Strength A clear deviation is starting to emerge as Bitcoin plummets to the downside. Although every asset has declined in USD terms, Ethereum is beginning to show unmistakable signs of being the next clear winner once the uptrend resumes.
What makes this particularly interesting is that I recently outlined cryptocurrencies outside the top 10 showing resilience against BTC here:
And now you have Ethereum, the second largest cryptocurrency by market cap, completely deviating from its normal pattern of weakness against BTC.
Looking back at my previous ideas over these past few months, I outlined the severe weakness of ETH against BTC in detail. Even as BTC continued its ascent toward $82,000, ETH continued to get rejected from the $2,400 supply level. This was clearly documented in my idea that was chosen as an Editor's Pick by TradingView:
And again I outlined that weakness when reviewing ETH's upside targets:
Now the tables have turned. ETH is clearly being chosen over Bitcoin in the current regime. Market participants are rotating out of Bitcoin and into ETH at a rapid pace, and here is why.
Reason 1: The Dominance Trade
Since the beginning of May, BTC has lost 4% dominance relative to the rest of the market. One of the primary drivers of this is the USDT dominance dynamic I have been outlining for several weeks:
On top of that, the early signs of altcoins showing strength against Bitcoin from my idea linked at the top have continued to develop, with OTHERS gaining over 1% against BTC since that post as Bitcoin has continued to decline.
To be clear, not all altcoins are participating equally. All are gaining some relative strength against Bitcoin, but ETH is clearly being chosen as the standout and somebody in the background knows something. This price action is a clear representation of that.
Therefore, it will be extremely important to watch ETH ETF flows throughout this month. This move could be an early signal that outflows from the Bitcoin ETF are beginning to transfer into the ETH ETF. These are only early signs, but this move is not something to discount.
Reason 2: ETH/BTC Golden Pocket + Weekly Reversal Doji
ETH/BTC has shown clear strength at the golden pocket, printing a weekly reversal doji just two days ago. ETH/BTC is already up almost 5% since reaching that golden pocket and printing that reversal. This is a clear sign of market participants converting their BTC into ETH.
Reason 3: 4H Bullish Divergence + Weekly Oversold Bounce
The 4H RSI has printed a bullish divergence and ETH is simultaneously bouncing from weekly oversold conditions, giving further technical confirmation to this rotation.
Reason 4: ETH Testing Key Weekly Price Levels
ETH has started hitting its key price levels on the weekly timeframe and came very close to its legacy trendline. That analysis can be viewed here:
Reason 5: BTC Nearing Completion of Its Downside Move
Finally, BTC appears to be nearing completion of its downside move. To be clear, there could still be more pain to come on the macro, but at least in the near term BTC is likely to find some relief at the levels outlined here:
Revising the Downside ETH Target
In my last few ideas I was watching for ETH to hit the $1,820 to $1,850 target. However, given what the market is currently showing, that theory needs to be revised. If BTC is able to catch a bid soon, ETH will start to show even greater outperformance in USD terms and those lower targets may not be reached. Keep that in mind.
On top of that, ETH has printed a daily doji reversal candle on its USD pair and is also attempting to bottom near oversold conditions:
There is still an entire trading day ahead of us so anything can happen. But in pre-market trading ETH is holding yesterday's lows and showing tremendous strength against BTC. If BTC can catch a bid at the levels I have outlined, ETH could rally back toward the lower band of the pattern outlined in the chart above.
ETH/BTC Continuation Acceleration Protocol (CAP) BreakoutContinuation Acceleration Protocol (CAP) status: watching for breakout confirmation.
Structure:
Ξ/₿ has completed a textbook ABC correction on declining volume following a sharp impulse move off the 0.02749 Fibonacci 1.272 extension low. Price is now retesting the upper boundary of a 9-month descending wedge. The correction printed on the lowest volume of the entire structure, a classic sign of exhausted selling rather than sustained distribution.
Gate 1 - Regime: Descending wedge nearing apex. Higher timeframe structure compressing into decision point.
Gate 2 - BOS watch: Reclaim of 0.02900 confirms break of the descending structure and shifts intermediate trend.
Gate 3 - OTE: Current price at 0.02827, sitting directly on the 1.272 extension support and wedge resistance confluence.
Gate 4 - CVD: Volume declining on the correction. Watching for delta turn on the 2D to confirm accumulation.
Gate 5 - Catalyst: GENIUS Act comment period closes June 2. CLARITY Act Senate vote June 3. Regulatory clarity arriving simultaneously with the technical setup.
Targets: 0.03200 initial, 0.03600 full structure, 0.04326 measured wedge extension.
Invalidation: Daily close below 0.02600.
ETHBTC Ratio: The Elusive 7 year MONSTER SQUEEZE BULL SEASON ON!
ALT season don't come too often -- and most of the time, for most traders they are vacuumed into a guessing game on when that elusive monster season will come again. Correction can be hefty and painful -- and one wrong step may lead to decay of precious time and most importantly money, unless you are are a hardcore hodler who couldn't care less of the micro movements of the market, and just buy in intervals every month.
BTC as a case study has gone crazy parabolic to heavens level to 120k from a measly valuation at 3000 from 2019 on a 7 year period. Outrageous 1990.91% gains warranting the idea that with this market you don't need to be in-and-out too much because LESS IS MORE.
Now, using the same 7-year cycle intervals with reference to the current ETHBTC ratio -- we are now on that elusive monster squeeze season based on our diagram. The last time this level appeared was on January 2019 (BTC surged from 3300 to 69000), and after 7 years we got another rare occurrence of this same signal.
This is rare -- and to witness this again is very special because this only comes once in blue moon. If you missed that era of BTC goin from 3k to 69000 -- you will know the feeling now.
ALT SEASON is definitely ON.
Ideal seeding is this month as most prices are outrageously cheap -- mostly alts.
I expect 24 months of continued ascend from here on. JUNE 2026 will spark things up.
This new season I expect BTC and ETH to aim for 2.5x levels from this signal. (BTC 200k and ETH 10k respectively)
Happy Planting -- and Happy Harvesting soon.
See you way up there.
As of this post May 29, 2026:
current prices of BTC and ETH for tracking reference of this post:
BTC 73000
ETH 2000
TAYOR.
TRADE SAFELY ALWAYS.
GOD BLESS.
ETH/BTC Keeps Falling — Is 0.016 the Final Support?ETH/BTC continues trading inside a long-term descending channel while momentum slowly deteriorates.
For years, many investors assumed Ethereum would eventually reclaim structural leadership against Bitcoin.
The chart currently suggests otherwise.
At least for now.
Trend Structure
Visible structure shows:
• Persistent lower highs since the 2021–2022 peak
• Repeated inability to sustain rallies
• Long-term descending channel remains intact
• Relative weakness versus Bitcoin continues
This is not a short correction.
The chart reflects a multi-year downtrend.
And importantly:
The trend has not broken yet.
Support / Resistance
Visible levels on chart:
Major Support:
• Horizontal support around 0.01600
• Lower boundary region of descending channel
This appears to be the major downside level highlighted.
Overhead Resistance:
• Descending channel resistance
• Area around moving averages
Price remains trapped beneath both.
Moving Averages
Visible MAs:
• 50 MA ≈ 0.03227 (blue)
• 100 MA ≈ 0.03293 (green)
Observations:
• Price trades below both major moving averages
• Previous rally attempt resulted in visible:
"1 week MA100 rejection"
That rejection preserved bearish structure.
Until price reclaims these averages, trend pressure remains downward.
Indicators Visible
RSI(14):
• RSI near 33–41 zone
• Momentum remains weak
• No clear bullish reversal signal visible
ETH/BTC appears closer to exhaustion than strength.
Yet oversold conditions alone rarely end trends.
Chart Pattern
Primary pattern:
Channel Down (Descending Channel)
The market has respected this structure for years.
Each relief rally has eventually failed inside the channel.
The pattern remains valid until broken.
Bullish Scenario
For bullish recovery:
• Price would need to reclaim moving averages
• Break above descending channel resistance
• Invalidate lower-high structure
No confirmation visible yet.
Bearish Scenario
If current weakness persists:
• Descending channel may continue guiding price lower
• Chart projection suggests possible revisit toward:
0.01600 support
That level appears increasingly important.
Not because support must hold.
But because markets often react where participants expect them to.
The uncomfortable question:
What if Ethereum isn't becoming weaker…
What if Bitcoin is simply becoming stronger faster?
Relative performance can quietly reshape narratives over time.
Do you think ETH/BTC finally breaks this multi-year channel — or does 0.016 become the next major test?
ETH/BTC Continues To Weaken As Another Structural Break OccursLong-term structure still bearish
• ETH vs BTC continues producing lower highs and lower lows since the major August ’25 peak
• The broader trend still heavily favours Bitcoin, with ETH unable to sustain any meaningful upside reversals
Weekly resistance rejected again
• Bulls once again failed to reclaim the key 3227 Sats resistance region
• Price also remains trapped below the declining 21-Week EMA, keeping medium-term momentum firmly bearish
Key support now under pressure
• ETH has now broken below previous weekly support and printed a fresh multi-week low around 2727 Sats
• This current region is becoming extremely important for the medium-term outlook of ETH and altcoins in general
Momentum still favouring BTC
• RSI remains weak and continues languishing near oversold territory rather than showing strong bullish divergence
• StochRSI is also still pointing lower, suggesting bearish momentum has not fully exhausted yet
In Summary
ETH/BTC continues to look structurally weak after failing once again at major weekly resistance. The pair has now broken previous support and slipped to fresh multi-week lows, reinforcing the ongoing trend of Bitcoin outperforming the broader altcoin market. This current support region is becoming increasingly important, as a clean breakdown could trigger another wave of weakness across altcoins generally. For now, bulls need a strong reclaim back above weekly resistance to begin shifting momentum.