ETHFI is nearing the end of its upward trend (8H)From the point where we marked the green arrow, the corrective structure appears to have completed, and ETHFI has entered a bullish pattern.
This pattern appears to be a Diametric, with the price currently approaching the end of Wave F.
If the price moves into the marked red box, we will look for sell/short positions.
The targets are marked on the chart.
Analysis invalidation: A daily candle close above the invalidation level will invalidate this analysis.
If you have a coin or altcoin you want analyzed, first hit the like button and then comment its name so I can review it for you.
Do you also think ETHFI is bullish?
In-depth trading ideas
๏ปฟ$ETHFIUSD The Trend Is Being Tested, Not Broken The Trend Is Being Tested, Not Broken ๐
CRYPTOCAP:ETHFI is sitting on a key support zone where trendline support, previous demand, and market structure meet. Price has already reacted from this area before, making it an important level to watch. The recent pullback looks more like a retracement than a confirmed trend reversal, but buyers still need to prove they are in control. ๐
A strong reaction from this support, backed by rising volume and a confirmed higher low, could shift momentum toward the next liquidity pools around 0.4441, 0.4816, and potentially 0.5360. If this level fails, the market may seek deeper liquidity before the next expansion โ ๏ธ
#LEO524 #ETHFI #Crypto #PriceAction #SmartMoney
Analysis by LEO524
ETHFI USDT LONG SIGNAL#18. FARTCOIN/USDT โ Trade Setup (LONG)
๐ Position Type: LONG
๐ Timeframe: 1H
๐ Market: Futures
๐ฐ Entry Zone:
0.1364
0.1315
๐ Stop-Loss:
0.1290
๐ฏ Take-Profit Targets:
โข TP1:ย 0.1415
โข TP2: 0.1518
โข TP3: 0.1618
โข TP4. 0.1730
Tp5.
โ๏ธ Leverage:
5*3
โซ๏ธ After TP1, move SL to Entry + 0.2%.
โช๏ธ Exit Plan:
โข 40% at TP1
โข 20% at TP2
โข 20% at TP3
20% at TP4
ย
๐ Risk Management:
Risk only 1โ2% of your capital per trade.
โ ๏ธ Always check and confirm the setup on your chart before entering the trade.
ETHFI USDT LONG SIGNAL#145.ย ETHFI /USDT โ Trade Setup (LONG)
๐ Position Type:
๐ Timeframe: 1H
๐ Market: Futures
๐ฐ Entry Zone:
0.3985
๐ Stop-Loss:
0.3865
๐ฏ Take-Profit Targets:
โข TP1:ย 0.4082
โข TP2: 0.42
โข TP3: 0.4324
โข TP4: 0.4456
โ๏ธ Leverage:
5*10
โซ๏ธ After TP1, move SL to Entry + 0.2%.
โช๏ธ Exit Plan:
โข 40% at TP1
โข 20% at TP2
โข 20% at TP3
ย 20%. at. TP4
๐ Risk Management:
Risk only 1โ2% of your capital per trade.
โ ๏ธ Always check and confirm the setup on your chart before entering the trade.
ETHFI: local squeeze with $0.5340 destinationThe Macro Picture ๐บ๏ธ
ETHFI unwound from the $0.5364 macro ceiling into a summer base and has reclaimed $0.4106, holding above the $0.3785 local low. Price is rotating in the middle of the range with the floor intact โ a base rebuilding, not a breakdown.
The Setup โ๏ธ
The Range Floor ๐ข
$0.3785 (Local Low) is the demand shelf, with $0.2654 (Macro Support) as the deeper backstop. Both have held, and that's the base this range pivots on.
The Decision Point ๐ด
$0.4782 (Local High) is the gate. A daily close above it flips the local structure bullish and opens the path to the $0.5340 measured-move target.
The Roadmap ๐ฃ๏ธ
Hold above $0.3785 โ break $0.4782 โ run toward $0.5340. Invalidation is a clean daily close below $0.2654 โ that breaks the range.
This is a GRID Range Play: a defined band to rotate, buying the lower half and scaling out into the breakout.
#ETHFI #EtherFi #crypto #trading #TA #3Commas #GRID
ETHFI Ready to Break Out? | High-Probability Long SetupTechnology Overview
Ether.fi (ETHFI) is a Liquid Restaking protocol built on Ethereum, allowing users to stake their ETH while maintaining control of their private keys. The protocol is integrated with the EigenLayer ecosystem and aims to expand yield opportunities and network security through restaking.
Technical Analysis
On the 12-hour chart, the yellow lines represent the trading range (value area) of the current structure, with the price now approaching its upper boundary.
At the same time, the daily timeframe shows that selling pressure is beginning to weaken, which may indicate a gradual shift in control from sellers to buyers.
However, there are two key areas of interest, marked by the red lines. These represent supply zones where sellers are expected to become active. Therefore, we'll closely monitor the price reaction in these areas. We'll only consider a long position if the price breaks above the most recent daily high of the current structure. Until that confirmation is received, there is no trade.
The target shown on the chart is an initial target only. Trade management and any additional targets will depend on price action, market structure, and proper risk management.
Disclaimer:
This analysis is for educational and informational purposes only and should not be considered financial or investment advice. Always conduct your own research and manage your risk before making any trading decisions.
Good luck to all of us!
Yours, The Chief.
ETHFI PERPETUAL TRADE SELL SETUP Short from $0.43ETHFI PERPETUAL TRADE
SELL SETUP
Short from $0.43
Currently $0.43
Targeting $0.4050 or Down
(Trading plan IF ETHFI go up to $0.47
will add more shorts)
Follow the notes for updates
In the event of an early exit,
this analysis will be updated.
Its not a Financial advice
#ETHFIUSDT (Daily) QM#ETHFIUSDT (Daily)
#ETHFI and the million-dollar pattern! ๐
If a reversal happens from here or from the red zone (even better if it engulfs the zone), our QM (Quasimodo) pattern will be completed.At e
ach of the blue zones, if we get confirmation, we can consider entering a long position.๐ฏ Short
-term target: 0.5154โก Suitable l
everage: 5xFor confirmation
, Iโll be looking at the 4-hour timeframe and using candlestick patterns as confirmation.
Weโre keeping a close eye on this setup.
ETHFIUSDT 1D#ETHFI is moving inside a descending channel on the daily chart. Consider entering this coin only after a clean breakout above the channel resistance and the daily SMA50. In that case, the potential upside targets are:
๐ฏ $0.407
๐ฏ $0.482
๐ฏ $0.543
๐ฏ $0.604
๐ฏ $0.690
๐ฏ $0.800
๐ฏ $0.973
โ ๏ธ Always remember to use a tight stop-loss and maintain proper risk management.
ETHFI / ETHFIUSDT Bullish Setup | Futures Trade IdeaMARKET ANALYSIS
ETHFI is currently reacting from a key technical area highlighted on the chart.
As long as the protected support zone remains intact, the bullish market structure remains valid and higher liquidity targets may continue to attract price action.
A breakdown below the invalidation level would weaken the current bullish scenario and require a reassessment of market conditions.
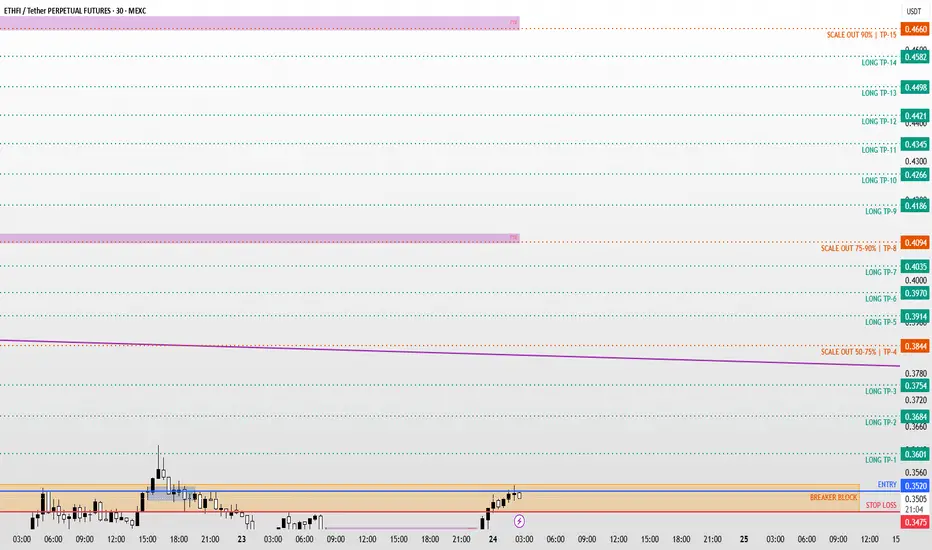
๐ Entry, Stop Loss and Take Profit levels are marked directly on the chart.
โโโโโโโโโโโโโโ
โ ๏ธ DISCLAIMER
This publication is provided solely for educational and market observation purposes.
Nothing contained in this analysis should be considered financial advice, investment advice, or a recommendation to buy or sell any financial instrument.
All trading and investment decisions remain solely the responsibility of the individual trader.
Always conduct your own research and apply proper risk management before entering any position.
โโโโโโโโโโโโโโ
๐ฏ PARALOG
โช๏ธCrypto Market Analysis
โช๏ธBTC Futures Signals
โช๏ธBitcoin & Altcoin Market Analysis
Precision โข Momentum โข Timing
โโโโโโโโโโโโโโ
Exchange: #MEXC Futures
#bitcoin #btc #crypto #futures #technicalanalysis
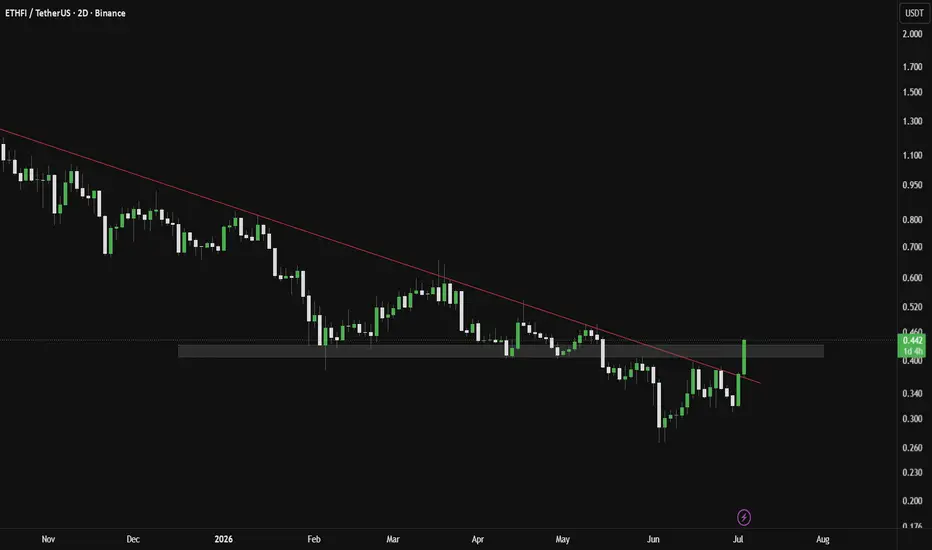
ETHFI/USDT โ Descending TrendLine: Breakout Setup?Will ETHFI Recover From Bearish Pressure? ๐
The ETHFI/USDT chart on the 2D timeframe is still moving under medium-term bearish pressure, with the market structure forming a clear Descending TrendLine since the previous price peak. ๐
This trendline has become a dynamic resistance area that has continuously suppressed price movement over the past several months. โ ๏ธ
Currently, the price is approaching the end of the trendline and entering a narrow consolidation zone. Conditions like this often signal that the market is preparing for its next major move. ๐๐ฅ
โโโโโโโโโโโโโโโโโโ
๐ Pattern Description โ Descending TrendLine
๐ Descending TrendLine
The descending trendline is formed by consistent lower highs since the previous top area.
โจ Characteristics of this pattern:
๐ป Indicates sellers are still dominating the market.
๐ป Price continuously fails to create higher highs.
๐ป Selling pressure starts weakening as price approaches the end of the trendline.
๐ป A valid breakout usually occurs when volume increases and candles successfully close above the trendline. ๐
On this chart, ETHFI appears to be building a support base in the lower area while gradually testing the trendline resistance. ๐งฑ
โโโโโโโโโโโโโโโโโโ
๐ข Bullish Scenario
The bullish scenario will be confirmed if price successfully:
โ
Breaks out and closes strongly above the Descending TrendLine
โ
Reclaims nearby resistance levels
โ
Forms a new higher low after the breakout
๐ฏ Bullish targets on the chart:
๐ 0.4850
๐ 0.5250
๐ 0.5900
๐ 0.6750
๐ 0.8100
If the breakout occurs with strong volume, ETHFI could experience an aggressive relief rally as the long-term downtrend structure begins losing bearish momentum. ๐๐ฅ
The 0.8100 area becomes a major resistance and an important psychological target for a medium-term trend reversal. ๐ฅ
โโโโโโโโโโโโโโโโโโ
๐ด Bearish Scenario
The bearish scenario remains valid if:
โ Price fails to break out above the trendline again
โ Strong rejection occurs at the diagonal resistance area
โ The 0.4300 support area fails to hold
If support breaks down, ETHFI could continue its downtrend toward previous low areas and potentially create a new lower low. ๐
As long as price remains below the Descending TrendLine, the market technically remains in a bearish structure. โ ๏ธ๐ป
โโโโโโโโโโโโโโโโโโ
๐ Conclusion
ETHFI is currently at a very critical area as price approaches the end of the Descending TrendLine after a prolonged downtrend. ๐
A breakout from this trendline could become an early signal of a reversal or at least a significant relief rally. However, until the breakout is fully confirmed, traders should remain cautious of potential fake breakouts and bearish continuation. โก
This area is very interesting to watch because major momentum often appears when the market exits a compression phase like this. ๐ฅ๐
โโโโโโโโโโโโโโโโโโ
#ETHFI #ETHFIUSDT #Crypto #Altcoin #TechnicalAnalysis #CryptoTrading #Breakout #DescendingTrendline #Bullish #Bearish #Trendline #Altseason #CryptoMarket #SupportResistance #PriceAction #Trader #Bitcoin #Ethereum
ETHFI Update๐จ๐ ETHFI Update
ETHFI has broken out of the red resistance zone ๐ด
But now it is facing another resistance around $0.53,
where selling pressure is still present โ ๏ธ
If price breaks out above this level,
the first target will be the blue line level around $0.57 ๐ต๐ฏ
Waiting for strong breakout confirmation and momentum.
Support Lost on ETFHI, 0.4795 Next!$ETFHI breakdown confirmedโ
The range support at 0.5379 has been decisively lost. After sweeping the highs, price reversed sharply and broke below consolidation, confirming a bearish shift in structure.
The breakdown candle shows strong acceptance below support, suggesting sellers are in control. Any bounce toward the broken level may act as resistance.
Outlook:
As long as price holds below 0.5379, the path of least resistance remains down toward
0.4795, followed by 0.4303.
Only a strong reclaim back above the broken level would invalidate the bearish continuation scenario.
#ETFHI #Crypto
ETFHIUSDT could fall to 0.4300 Short squeeze (trap). A sharp liquidity surge followed by a rapid sell-off. The move may have been intended to build momentum ahead of a decline. The overall trend is bearish. A break below 0.5379 could trigger a distribution phase.
Volume is lacking. A sharp spike and subsequent fade against the backdrop of the recent momentum indicates liquidity accumulation.
All attention is on the wedge support and consolidation. A close below 0.5379 could trigger a reversal of the local trend
Scenario: We expect the price to break out of consolidation and breach the support level of the local uptrend. The goal of this move is an aggressive decline toward 0.4858โ0.4269
ETH: will the next breakout happen? key levels to watchETHFIUSDT
Whoโs watching this new kid trying to act like a blue chip already? Lately the whole ETH ecosystem narrative has been heating up again, and according to market chatter, fresh listings and DeFi buzz keep pulling attention back to ETHโrelated tokens. Today price is stuck right at a local value area on the 4H chart, so this is where the next move should get decided.
On the 4H, ETHFIUSDT is grinding sideways just above a dense volume shelf, with multiple green demand blocks stacked below. RSI is cooling off from overbought but still holding bullish territory, which for me screams โhealthy pullbackโ more than โtop is in.โ As long as buyers defend this upper zone, I lean toward another push up as late FOMO money chases the ETH narrative.
My base plan: I like longs on dips into the nearest demand zone with targets toward the recent local highs and then the next liquidity pocket above. If price loses that first green block and starts accepting below the value area, I flip the script and look for a deeper sweep of the lower demand zones before thinking long again. I might be wrong, but ignoring clear levels and volume like this is how traders donate to the market. โ
ETHFI ANALYSIS (1D)This Entire chart is a text book visual of the pattern known as "Double Zig-Zag"
ETHFI finished it's first A-B-C correction after ending the first impulse.
What you see after the crash is an empty desert, means nothing, an interrapting wave which will be needed to form another A-B-C, you combine that with previous one and congrasts, you have the double zig-zag. Bonus: Now you also know why it needs to move a little bit up before it crashs!
ETHFI/USDT Showing Bullish Strength โ Key Invalidation at $0.479ETHFI / USDT is showing strong bullish momentum and early signs of a potential rally toward the $0.6492 โ $0.6569 target zone. Price is currently reacting positively, indicating buyers are active at current levels. However, proper risk management is essential, as any breakdown below $0.4790 would invalidate this bullish setup.
ETHFIUSDT SELL OUTLOOK Just like CRYPTOCAP:BTC is still diving deep, many Alts are following suite and CRYPTOCAP:ETHFI is not left out.
If the sell on CRYPTOCAP:BTC continues as projected, CRYPTOCAP:ETHFI will experience a further move to the downside
Caution: This is not a financial advice, pls DYOR
ETHFI: bounce to short? key levels and targets for todayETHFI. Waiting for the next leg or just bagholding the listing hype leftovers? Lately the buzz in the market is that money is rotating back into majors while the whole restaking theme cools off, and smaller new tokens like ETHFI are feeling that pressure. Todayโs headlines about fading appetite for speculative alts fit perfectly with what the chart is screaming.
On the 4H chart price keeps getting smacked down from the red supply zone around 0.52 and is now hanging under the local volume node near 0.46. RSI is below 50 and pointing south, so momentum is with the sellers. For me that leans to a short scenario toward the green demand area around 0.42 while the market digests the postโlisting hangover.
My base plan: look for failed bounces into 0.46โ0.47 to join shorts, with invalidation if we close back above 0.48 where fresh buyers can squeeze us back to 0.52+. First magnet for me is 0.44 and then the 0.42 demand zone โ
. I might be wrong, but until bulls prove they can reclaim that 0.48 level, I treat every bounce as fuel for the next flush.
ETHFI/USDT Approaching Critical Demand โ Bounce or Breakdown?On the 3D timeframe, ETHFI/USDT remains in a medium to long-term downtrend. After failing to hold the distribution area around 1.4 โ 1.7, price continued to form lower highs and lower lows, confirming strong bearish control. Currently, price is declining and approaching a major demand zone (yellow box) located at 0.51 โ 0.41.
---
Pattern & Market Structure Explanation
1. Primary Trend: Bearish Continuation
Clear Lower High (LH) and Lower Low (LL) structure.
Every bullish attempt is rejected at progressively lower resistance levels.
2. Distribution Range Breakdown
The 0.93 โ 1.77 area acted as a strong distribution zone.
Breakdown from this range confirms trend continuation, not a simple correction.
3. Current Price Action
Price is moving inside a minor descending structure, gradually pressing into the key demand zone.
No valid bullish Break of Structure (BOS) has formed so far.
4. Major Demand Zone (Yellow Box)
The 0.51 โ 0.41 zone is a historical demand area that previously triggered strong bullish impulses.
This zone is expected to be a critical reaction area.
---
Key Levels
Resistance Levels
0.67
0.83
0.93
1.41
1.77
Major Support / Demand
0.51 โ 0.41 (Key Demand Zone)
---
Bullish Scenario
A bullish scenario becomes valid only if price shows a strong reaction inside the 0.51 โ 0.41 demand zone, supported by:
Strong bullish rejection or long lower wicks
Increasing volume
Formation of a Higher Low on lower timeframes
Potential Upside Targets (Relief Rally):
0.67
0.83
0.93
As long as price remains below 0.93, any upside move should be considered a technical bounce, not a trend reversal.
---
Bearish Scenario
The bearish scenario remains dominant if:
Price breaks and closes decisively below 0.41
No significant bullish reaction occurs at the demand zone
Implication:
Failed demand โ continuation of the bearish structure
Increased probability of further downside / price discovery
A clean breakdown below this zone would confirm long-term bearish continuation.
---
Conclusion
ETHFI/USDT is still under strong bearish pressure. The 0.51 โ 0.41 demand zone is the key decision area:
Strong reaction โ potential technical bounce
Breakdown โ bearish continuation
Traders should remain patient and wait for clear price action confirmation before making directional decisions.
#ETHFI #ETHFIUSDT #CryptoAnalysis #Altcoin #BearishTrend #DemandZone #MarketStructure
ETHFI/USDT Bullish Order Flow (LTF Scalp Long idea)๐ขETHFUSDT โ Bullish Order Flow (LTF Scalp Long idea)
Bias: Bullish
ETHFI is Showing bullish order flow on the lower timeframes, with price respecting higher lows and holding above key demand. This setup favors scalp long opportunities in line with current momentum
Price is targeting higher-timeframe supply in line with the bullish order flow.
โ ๏ธ Educational only. Manage risk.