ETHUSD Bullish Target: Clean and Clear SetupETHUSD continues to trade within a healthy bullish market structure, printing a sequence of Higher Highs (HH) and Higher Lows (HL), which confirms that buyers remain in control on the 4-hour timeframe. The recent pullback appears to be a corrective move into a well-defined demand/support zone between 1800 and 1850, where institutional buying interest is likely to emerge.
As long as price remains above this demand area, the bullish outlook remains intact. A strong bullish rejection from the support zone, followed by increased buying momentum, could trigger another impulsive move toward the overhead resistance.
The first major obstacle lies at the 1980โ2000 resistance zone, where sellers have previously entered the market. A decisive breakout and close above this supply area would confirm a continuation of the bullish trend and open the path toward higher price levels.
Bullish Targets
๐ฏ Target 1: 1925 โ Initial resistance and first bullish objective.
๐ฏ Target 2: 2000 โ Key psychological resistance and breakout level.
๐ฏ Target 3: 2100 โ Major bullish target following a confirmed breakout above the resistance zone.
Bullish Bias: The overall structure remains positive while ETHUSD trades above the 1800โ1850 demand zone. Holding this support increases the probability of a bullish continuation toward 1925, 2000, and ultimately 2100 if buyers successfully overcome the major resistance zone.
In-depth trading ideas
๏ปฟEthereum Daily Analysis | Smart Money AccumulationEthereum is holding above a key support zone, keeping the bullish outlook intact. A confirmed reaction from this area could drive price toward the major liquidity and the higher POI.
Key Highlights:
* โ
Strong support zone holding.
* โ
Liquidity rests above recent highs.
* โ
Bullish structure remains valid.
* โ
A clean breakout could fuel further upside.
๐ก Trade with confirmation, not emotions. The best opportunities come from patience and disciplined execution.
Not Financial Advice. Trade at your own risk.
ETHUSD Buy Setup | Trendline Support Signal Bullish ContinuationETHUSD is approaching a high-confluence support area where the ascending trendline meets a significant Point of Interest (POI). Despite the recent pullback, the broader market structure remains bullish, and this demand zone could provide the momentum needed for buyers to regain control.
A strong bullish reaction from this support may lead to a move toward the 1954 resistance level. If buyers successfully break above that key resistance, Ethereum could extend its rally toward the major objective around 2080.
Key Technical Levels
* Market Bias: Bullish
* Support (POI): 1810โ1830
* Trend: Ascending Trendline Support
* First Target: 1954
* Final Target: 2080
* Confirmation: Bullish rejection from the POI followed by a break above recent resistance.
This analysis is based on market structure, trendline support, price action, and liquidity concepts. Always wait for confirmation before entering a trade and maintain disciplined risk management.
โธป
Not Financial Advice. This analysis is for educational purposes only. Always do your own research and manage your risk before trading.
ETHUSD Bullish Outlook | POI Retest Before Major Expansion Ethereum continues to respect its bullish higher-timeframe structure after multiple Breaks of Structure (BOS) confirmed buyer dominance. Price is expected to retrace into the highlighted Point of Interest (POI), where institutional demand could fuel the next bullish expansion.
Key Technical Observations:
* โ
Bullish market structure remains intact.
* โ
Multiple BOS confirmations indicate strong buying momentum.
* โ
Liquidity is resting above recent highs.
* โ
POI is the preferred area to watch for institutional buying.
* โ
A bullish reaction from this demand zone could lead to a continuation toward premium liquidity levels.
Trading Plan:
* ๐ Wait for price to retrace into the POI.
* ๐ Look for bullish confirmation (Market Structure Shift, CHoCH, or strong bullish candle).
* ๐ Place Stop Loss below the POI.
* ๐ Target the previous highs first, then higher liquidity zones as momentum builds.
๐ก The highest-probability trades come from patience and confirmationโnot chasing price. Let the market come to your level before executing your setup.
Not Financial Advice. Trade at your own risk.
ETHUSD: Bullish Order Block Holding Next Target $2,500? | SMC Ethereum is showing strong bullish momentum after respecting a key daily Order Block. Market structure has shifted to the upside with a confirmed Change of Character (CHoCH), suggesting buyers are regaining control.
๐ Technical Outlook:
* โ
Daily Order Block acting as support
* โ
Bullish CHoCH confirmed
* โ
Higher low structure remains intact
* ๐ฏ Potential targets: $2,000 โ $2,300 โ $2,500
A healthy retracement into the highlighted Order Block could provide a continuation opportunity if bullish confirmation appears.
โ ๏ธ This analysis is for educational purposes only and is not financial advice. Always use proper risk management and wait for confirmation before entering a trade.
ETHUSD: Golden OTE Zone (0.72โ0.78) + MSS | Long to 1975 BSLExecutive Summary & Signal Overview
๐ Asset: ETH/USD (Ethereum / US Dollar)
๐ Position Type: Limit Buy / Long Entry
๐ Buy Zone: 1,875.00 โ 1,880.00
๐ก๏ธ Stop Loss (SL): 1,856.83 (Below Fibonacci Level 1 / Swing Low)
๐ฏ Target 1 (BSL 1): 1,925.00 (Fib Anchor Peak)
๐ฏ Target 2 (BSL 2): 1,952.00 (Intermediate High)
๐ฏ Target 3 (BSL 3): 1,975.00 (Major Range High)
โ๏ธ Risk-to-Reward (R:R): 1 : 4.4+
๐ 2. Technical & Confluence Breakdown
๐ A. Fibonacci Golden Ratio / OTE Zone (0.72 โ 0.78)
Drawing the Fibonacci retracement from the recent expansion low (1,857) to the local swing high (1,925), the $1,875 โ $1,880 area lines up precisely with the 0.72 โ 0.78 Optimal Trade Entry (OTE) golden zone.
This level acts as a high-probability discount area where institutional buyers re-enter long positions before continuing impulse moves.
๐ B. Lower Timeframe Market Structure Shift (MSS)
Prior to the current push, price swept the lower Sell-Side Liquidity (SSL) and responded with strong bullish displacement, creating a clean Market Structure Shift (MSS) to the upside.
The structural shift confirms that short-term seller momentum has exhausted and buyers are in control of order flow.
๐ฆ C. Demand Zone Confluence
The $1,875 โ $1,880 region overlaps with an unmitigated 15m order block / demand zone responsible for breaking the local structure. Retesting this block provides a strong risk-defined entry.
๐งฒ D. Unfilled Buy-Side Liquidity (BSL) Targets
Multiple clean swing highs sit stacked at 1,925.00, 1,952.00, and ultimate liquidity resting at 1,975.08. These pools represent prime exit liquidity for the move.
๐ก๏ธ 3. Execution & Risk Management Guidelines
Invalidation Level:
A candle close below $1,856.83 invalidates the OTE setup, signaling that the move was a temporary pullback rather than a structural reversal.
Partial Profit Protocol:
At TP 1 ($1,925.00): Lock in 30โ40% partials and secure the trade by moving Stop Loss to Breakeven (BE).
At TP 2 ($1,952.00): Take another 30% off the table and trail stops under lower-timeframe higher lows.
At TP 3 ($1,975.00): Full exit or leave a minimal runner for higher timeframe imbalances.
โ ๏ธ Educational Disclaimer: This signal analysis is strictly for educational, analytical, and back testing purposes only. It is not financial advice. Always adhere to strict risk management and never risk more capital than you are prepared to lose! ๐ก๏ธโจ
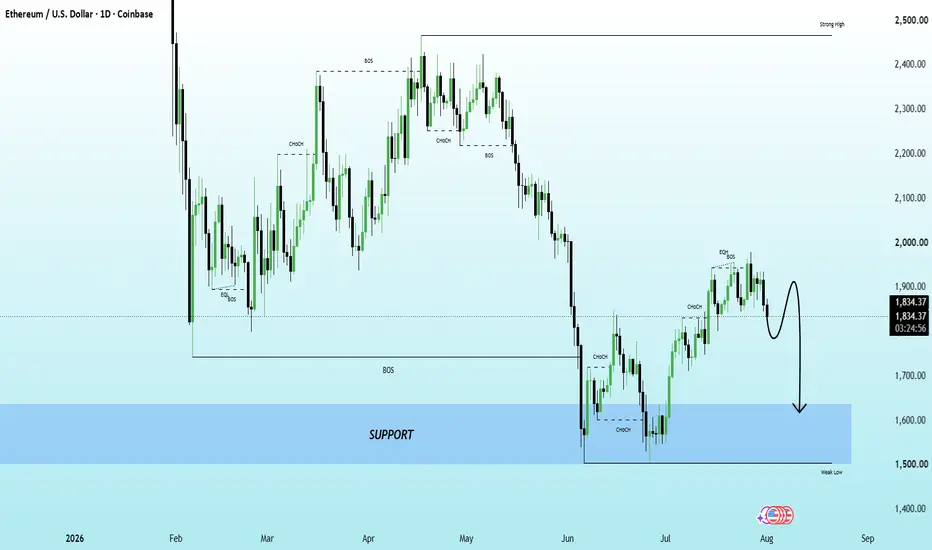
ETHUSD | Bearish Retest Before the Next Move?Ethereum is trading inside a bearish market structure after rejecting a key resistance area. Price may see a short-term retracement before continuing lower toward the major support zone.
A breakdown below the recent weak low would strengthen the bearish outlook and could open the way for a move into the highlighted demand area. Patience and confirmation remain key.
Key Levels:
๐น Resistance: 1900โ1950
๐น Support: 1550โ1650
๐น Bias: Bearish ๐
โ ๏ธ This analysis is for educational purposes only and does not constitute financial advice. Always wait for confirmation and use proper risk management.
Ethereum Analysis: Demand Zone Signals Potential ReversalETHUSD is approaching a high-probability Point of Interest (POI) after a corrective decline from recent highs. The highlighted demand zone around 1780โ1790 aligns with previous market structure and could attract fresh buying interest.
A liquidity sweep into the POI followed by a strong bullish reaction may confirm the continuation of the overall uptrend. If buyers regain control, Ethereum could target the recent swing highs, with the next major resistance located around 1953.
Key Technical Levels
* Market Bias: Bullish
* Support (POI): 1780โ1790
* Trend: Bullish after correction
* First Confirmation: Strong bullish rejection from the POI
* Target: 1953
This analysis is based on price action, market structure, liquidity concepts, and demand zone analysis. Always wait for confirmation before entering a trade and follow proper risk management.
โธป
Not Financial Advice. This analysis is for educational purposes only. Always do your own research and manage your risk before trading.
Ethereum - Here comes the bear market bottom!โจEthereum ( CRYPTO:ETHUSD ) is retesting incredible support:
๐Analysis summary:
Over the past two weeks alone, Ethereum is already up a decent +20%. And with this first push higher, Ethereum is nicely starting to respect a clear higher timeframe support area. This could very well be the bottom and Ethereum is starting another +150% bullrun soon.
๐Levels to watch:
$1,500 and $4,500
Keep your #LONGTERMVISION๐
โ Phil (@TheTraderPhil)
ETHUSD H1: Price Feeling Its Way Back Up After Two RejectionsETHUSD is currently trading just below a fairly steep descending trendline, which has already blocked price's upward momentum twice. After the most recent rejection, price fell quite sharply to test the support zone around 1,860โ1,870, then bounced slightly and is now moving sideways.
This is a detail worth watching.
The fact that price keeps getting rejected at the same trendline suggests sellers are still in control, and each retest tends to come with strong selling volume as seen in the most recent instance. If price continues along this scenario, there's a good chance of another pullback rally to retest the trendline.
The scenario I'm watching is buying while price still holds a confirmed bullish signal, with a stop loss below the 1,870 zone, targeting 1,910โ1,920, where price's reaction needs to be watched to confirm whether the decline will repeat.
This is just my personal perspective based on technical analysis, not investment advice. Always wait for confirmation before entering a trade and manage your risk carefully.
ETH - Today's Close Could Signal Next Expansion Looking at Ethereum, there is currently a major development unfolding. There are still about 6 hours until the close, so anything can happen, but I wanted to outline the current scenario so you are prepared for it.
First, review my last idea:
If you have been following me for a while, you will know the emphasis I have been placing on the "weekly legacy trendline". Even the daily candles have been proving this to be a very significant level for Ethereum.
When I made that last post on July 15th, I pointed out how this level would be difficult to break above and would likely see a rejection first. Over the next 2 days, ETH dropped over 6% from the daily close below the legacy trendline.
Then again on July 20th and 21st, ETH closed 2 more daily candles right below the legacy trendline, and over the following 2 days ETH saw another 4% decline from that close.
But now things get interesting. ETH closed the first weekly candle back above this legacy trendline since the weekly close on May 18th. This is the first reclaim of this critical trend for ETH, and it supports the daily outlook I have been building.
Based on the selloff that occurred today, this could be the retest before the expansion phase begins toward $2,060 to $2,150. That is exactly why today's close is so crucial. Just as the two prior periods of daily closes below the legacy trendline led to selloffs, this could be the first time price closes a daily candle above the trendline, signaling a pump in price rather than the selloffs we have been seeing, due to this reclaim.
Today's and tomorrow's candle closes are going to be extremely important. In addition to today closing above the trendline, we need to see tomorrow confirm it as well, so this does not become a fakeout.
The main reason for this caution is the RSI. A slight bearish divergence is forming, and trend momentum is not yet at the point needed to fully support the expansion move. As soon as the daily RSI breaks above 67 (red line), it is likely to push further toward overbought conditions, and that should help fuel the rally toward the upside target mentioned above.
ETH/USD SENDS CLEAR BULLISH SIGNALS|LONG
ETH/USD SIGNAL
Trade Direction: long
Entry Level: 1,861.66
Target Level: 1,941.50
Stop Loss: 1,808.80
RISK PROFILE
Risk level: medium
Suggested risk: 1%
Timeframe: 9h
Disclosure: I am part of Trade Nation's Influencer program and receive a monthly fee for using their TradingView charts in my analysis.
โ
LIKE AND COMMENT MY IDEASโ
ETHEREUM Ready to get rejected to $1250 at least.Ethereum (ETHUSD) has been trading within a 1-year Channel Down but since the June 26 Double Bottom has found itself on a technical Bullish Leg that not only broke above its 1D MA50 (blue trend-line) but is currently the closest to its 1D MA200 (orange trend-line) since the November 13 2025 test.
Along with the 0.618 Fibonacci retracement level from the previous Lower High, these two form a strong Resistance cluster that is about to reject the uptrend on a very distinct signal. That is the 1D RSI Lower Highs, a Bearish Divergence that was seen on both of ETH's previous Lower Highs.
A -39% decline from a potential 1D MA200 rejection (minimum Bearish Leg within this Channel Down) would hit $1250, while a -47.30% (2nd strongest Bearish Leg) would test the November 09 2022 Low at $1100.
---
** Please LIKE ๐, FOLLOW โ
, SHARE ๐ and COMMENT โ if you enjoy this idea! Also share your ideas and charts in the comments section below! This is best way to keep it relevant, support us, keep the content here free and allow the idea to reach as many people as possible. **
---
๐ธ๐ธ๐ธ๐ธ๐ธ๐ธ
๐ ๐ ๐ ๐ ๐ ๐
ETH/USD: Coiled Between EMA55 and Swing Low, 1,981 Is the LineETH is stuck in a tight neutral pocket on the 4H โ price at 1,887 sits in the lower half of the volatility band, just under EMA21 at 1,908 and EMA55 at 1,900. The trend backbone flattened out after that bullish BoS 24 bars ago at 1,956, and since then we've printed a swing high at 1,981 that's still holding as resistance and a swing low at 1,856 that's still holding as support. Classic coil. Why it matters: with ATR at only 28 and the band pinched between roughly 1,866 and 1,951, the market's telling us it wants a decision. The whole 1,900-1,908 EMA cluster is right on top of price, so the first clean 4H close reclaiming that zone flips the short-term bias back to the trend side of the bullish BoS. Trigger I'm watching: a 4H close back above 1,908 (EMA21) with follow-through into 1,920 โ that opens the door to retest the 1,981 swing high. Invalidation is clean โ a 4H close below 1,856 breaks the swing low and the coil resolves the other way; the idea's done there. Targets stack as: 1,951 at the upper band, then the 1,981 swing high (the real level everyone's watching), and above that the 1,956 BoS level gets re-tagged from the topside. Patience here โ let the coil break before doing anything.
Setup: 4H close back above EMA21 at 1,908 with follow-through toward 1,920 activates the reclaim.
Invalidation: 4H close below the 1,856 swing low invalidates the setup.
Targets: 1,951 โ upper band edge, first friction ยท 1,981 โ open swing high, the level to break ยท 2,010 โ clean-air projection above the swing
ETH/USD: Fresh Bullish BoS Above 1,956 Opens Path to 1,981ETH just printed a fresh bullish BoS on the 4H right at 1,956.45 โ that prior swing high is done and the trend backbone is agreeing. Price at 1,965.61 is sitting above the upper volatility band (1,937.35), with EMA21 at 1,904.45 and EMA55 at 1,888.19 both stacked underneath. Trend bias is squarely up.
Why it matters: the last swing low at 1,848.09 is still open 16 bars back, so structure has been building higher lows into this break. ATR is running 21.94, so the band is tight โ that's why a clean close through 1,956 carries weight rather than being noise. The catch is that we're extended above the upper band on the same bar as the BoS, which historically invites a drift back toward EMA21 before the next leg.
The setup activates on a hold above 1,956 on the retest โ ideally a pullback into the 1,940-1,950 zone that finds buyers against the reclaimed swing. If price gets sloppy and closes back below EMA55 at 1,888, the idea's done โ that would put the whole broken-swing thesis in question and reopen the 1,848 low as a magnet.
Targets stack cleanly from here: 1,981.24 is the window high and first cushion, then round-number 2,000, with 2,050 as the extended reach if momentum sustains beyond the band. Watching the reaction on the first retest โ that's where this either earns follow-through or fades.
Setup: Hold above the reclaimed 1,956 swing on a pullback into 1,940-1,950 confirms the BoS.
Invalidation: A 4H close back below EMA55 at 1,888 cancels the setup.
Targets: 1,981 โ window high, first cushion ยท 2,000 โ round-number magnet ยท 2,050 โ extended reach if band-riding continues
ETHUSD H1: Resistance Retest Could Determine the TrendETHUSD has just completed a sharp decline after falling from the resistance zone around 1,920โ1,930, breaking below both MA lines and touching the support zone around 1,860โ1,870, where price has started to stall and form a short-term bottom.
What's notable is that right at this support zone, price has shown a fairly clear bounce reaction, and I believe price is likely to continue rising to retest the old resistance zone around 1,920โ1,930 โ a zone that previously blocked the uptrend.
The fact that price held the support zone right after the sharp decline suggests there's still some technical buying pressure here, enough to produce a pullback rally to test the resistance zone above. However, this is also the same zone that previously caused a strong reversal, so price's reaction here will determine whether the downtrend continues.
The scenario I'm watching is buying at the current price zone around 1,882โ1,885, with a stop loss below the support zone around 1,860, targeting the 1,920โ1,930 resistance zone above, where price's reaction needs to be watched to confirm whether the rally will extend further.
This is just my personal perspective based on technical analysis, not investment advice. Always wait for confirmation before entering a trade and manage your risk carefully.
ETHUSD Buyers Remain in Control: Target Setting at 2200The overall market structure remains bullish. Price has consistently printed Higher Highs (HH) and Higher Lows (HL) after a bullish market structure shift, confirming that buyers remain in control. The recent Break of Structure (BOS) validates the continuation of the uptrend.
Market Structure
Bullish Market Structure remains intact.
Multiple bullish BOS confirmations indicate institutional buying pressure.
No confirmed bearish Change of Character (CHoCH) has formed yet.
Current Price Position
Price is currently trading below the 1950 Supply Zone, which is acting as short-term resistance. This area has rejected price once, making it an important decision point.
Expected Short-Term Move
A temporary retracement is expected before the next bullish expansion.
The most likely retracement targets are:
Fair Value Gap (FVG): 1835โ1850
If selling pressure increases, price may extend toward the higher timeframe Bullish Order Block (1700โ1750), where strong institutional demand is expected.
Bullish Continuation Scenario
If buyers defend the FVG or Bullish Order Block and bullish confirmation appears:
Price is expected to resume the uptrend.
The first objective will be a break above 1950.
A successful breakout could drive price toward the 2200 Bearish Order Block, which is the major higher-timeframe liquidity target.
Key Zones
Resistance / Supply: 1950
Major Target: 2200 Bearish Order Block
Support (FVG): 1835โ1850
Major Demand: 1700โ1750 Bullish Order Block
Trading Plan
Wait for price to retrace into the highlighted FVG or Bullish Order Block.
Look for bullish confirmation such as a bullish CHoCH, BOS, strong rejection candles, or increased buying volume before entering long positions.
Avoid buying directly into the 1950 supply unless price closes decisively above it.
ETHUSD: Peaked and this rejection is targeting $1,360Ethereum remains highly bearish on its 1W technical outlook (RSI = 41.527, MACD = -300.290, ADX = 21.473) as the long term bearish trend remains intact. This week capitalized on the failure to cross above its 1D MA200 and with a standard LH Bearish Divergence formed on the 1D RSI, it seems to have technically peaked. This is the very same formation that was seen on all 3 prior market peaks of the Bear Cycle. The rejection on the 0.5 Fibonacci level is another similarity and according to this, ETH may drop to the 1.236 Fibonacci extension (TP = 1,360).
## If you like our free content follow our profile to get more daily ideas. ##
## Comments and likes are greatly appreciated. ##
ETHUSD Following the Up-TrendHello Traders
In This Chart HOURLY Forex Forecast By FOREX PLANET
today analysis ๐
๐ขThis Chart includes_
๐ขWhat is The Next Opportunity on Etherium Market
๐ขhow to Enter to the Valid Entry With Assurance Profit
This CHART is For Trader's that Want to Improve Their Technical Analysis Skills and Their Trading By Understanding How To Analyze The Market Using Multiple Timeframes and Understanding The Bigger Picture on the Charts