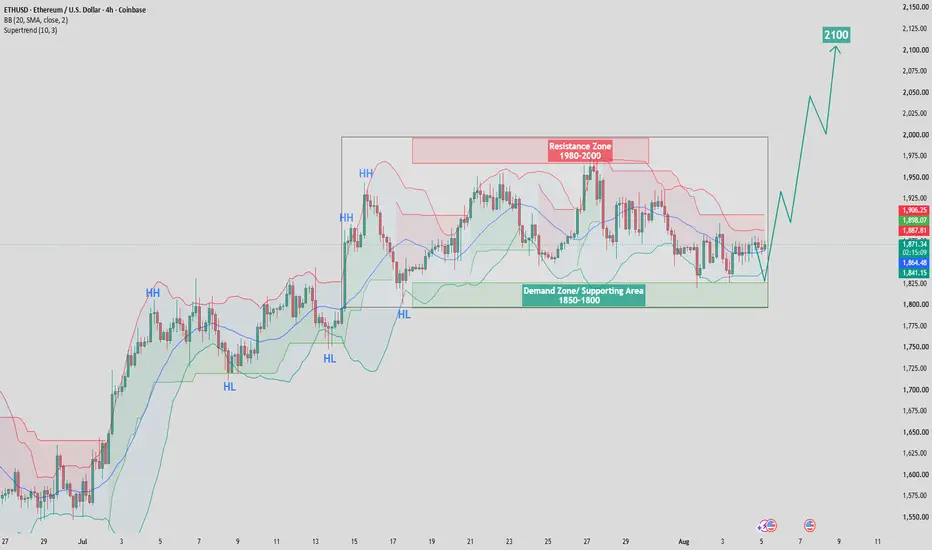
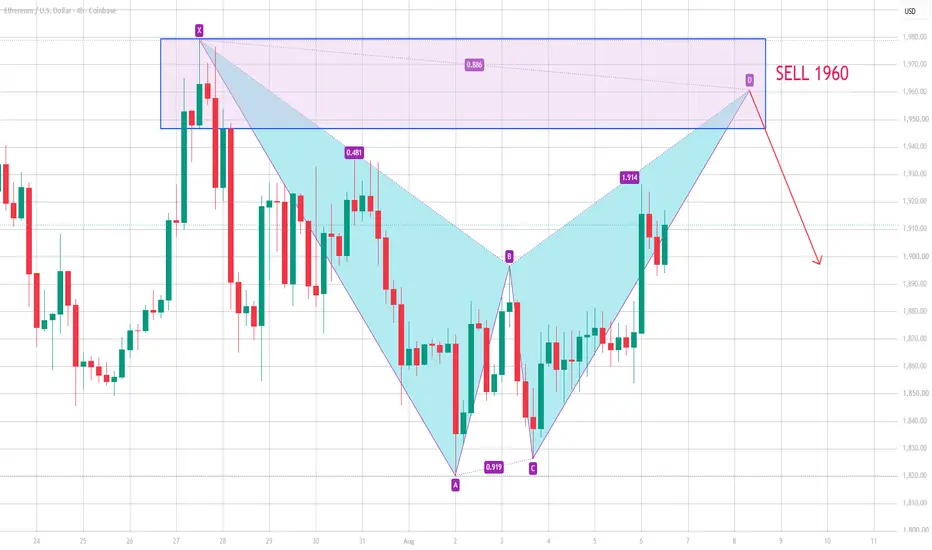
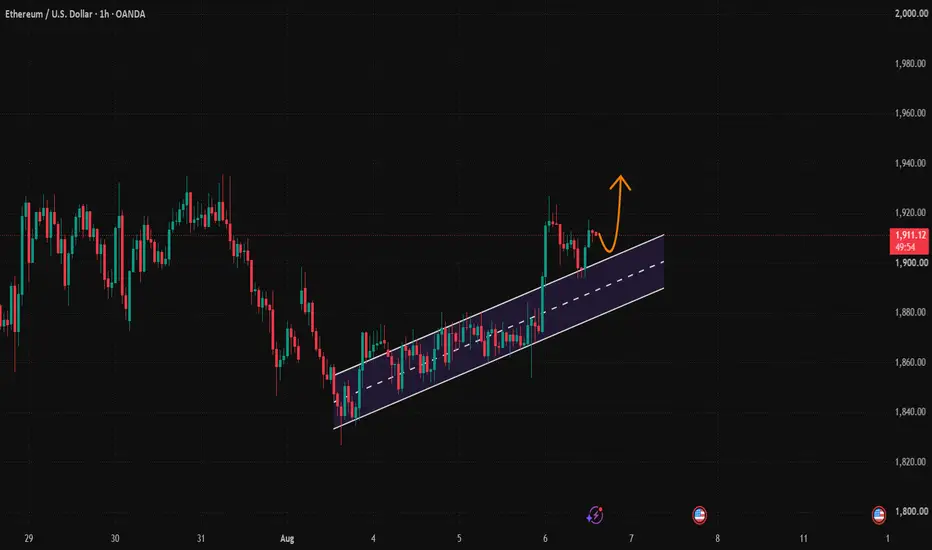
ETHUSD Bullish Target: Clean and Clear SetupETHUSD continues to trade within a healthy bullish market structure, printing a sequence of Higher Highs (HH) and Higher Lows (HL), which confirms that buyers remain in control on the 4-hour timeframe. The recent pullback appears to be a corrective move into a well-defined demand/support zone between 1800 and 1850, where institutional buying interest is likely to emerge.
As long as price remains above this demand area, the bullish outlook remains intact. A strong bullish rejection from the support zone, followed by increased buying momentum, could trigger another impulsive move toward the overhead resistance.
The first major obstacle lies at the 1980–2000 resistance zone, where sellers have previously entered the market. A decisive breakout and close above this supply area would confirm a continuation of the bullish trend and open the path toward higher price levels.
Bullish Targets
🎯 Target 1: 1925 – Initial resistance and first bullish objective.
🎯 Target 2: 2000 – Key psychological resistance and breakout level.
🎯 Target 3: 2100 – Major bullish target following a confirmed breakout above the resistance zone.
Bullish Bias: The overall structure remains positive while ETHUSD trades above the 1800–1850 demand zone. Holding this support increases the probability of a bullish continuation toward 1925, 2000, and ultimately 2100 if buyers successfully overcome the major resistance zone.
In-depth trading ideas
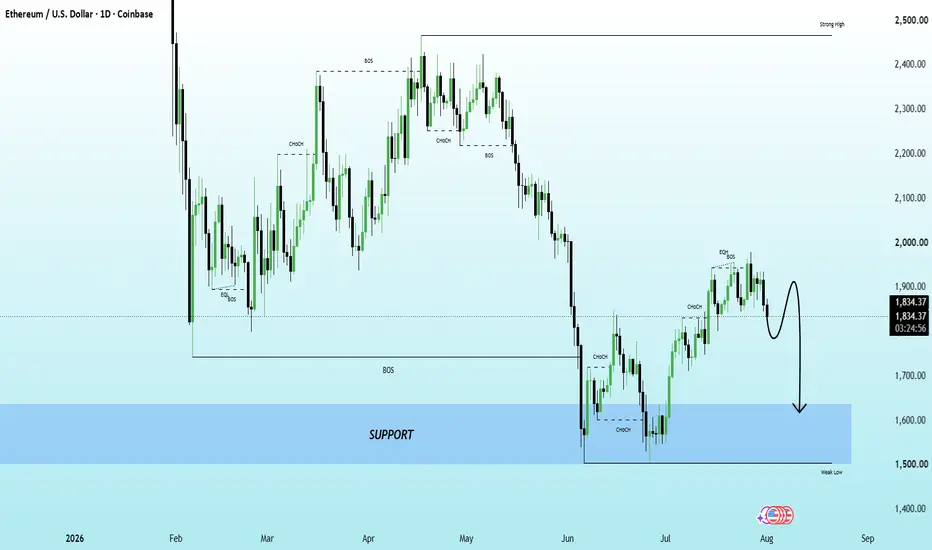
ETHUSD | Bearish Retest Before the Next Move?Ethereum is trading inside a bearish market structure after rejecting a key resistance area. Price may see a short-term retracement before continuing lower toward the major support zone.
A breakdown below the recent weak low would strengthen the bearish outlook and could open the way for a move into the highlighted demand area. Patience and confirmation remain key.
Key Levels:
🔹 Resistance: 1900–1950
🔹 Support: 1550–1650
🔹 Bias: Bearish 📉
⚠️ This analysis is for educational purposes only and does not constitute financial advice. Always wait for confirmation and use proper risk management.
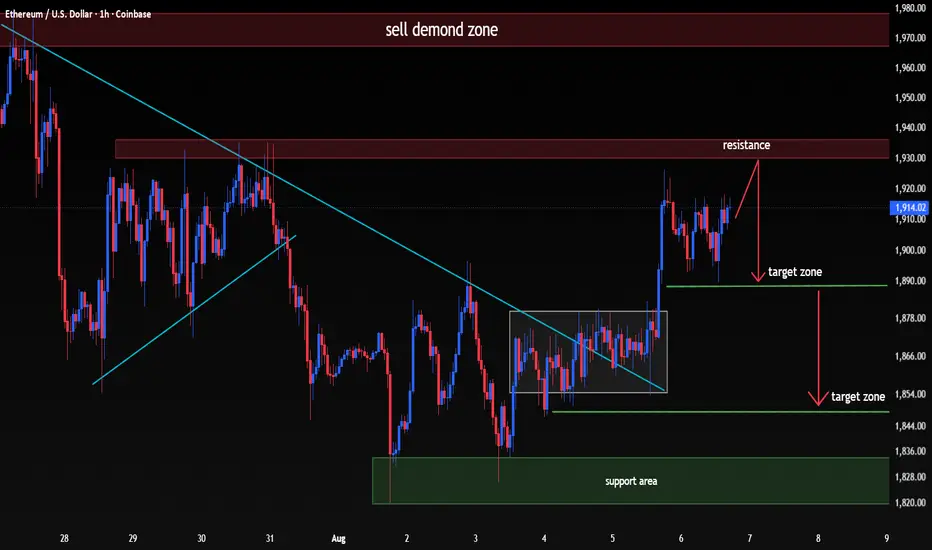
ETHUSD | SELL SETUP (1H)...ETHUSD | SELL SETUP (1H)
📍 Entry Zone: 1912 – 1922
🎯 Profit Targets:
TP1: 1890
TP2: 1848
🛑 Risk Control:
A sustained 1H close above 1935 would invalidate the bearish setup.
Market View:
ETH has rallied into a key resistance zone after a strong impulsive move, where sellers may become active. Price is approaching an area that previously acted as supply, making it a potential rejection point. As long as price remains below 1935, the bearish scenario remains valid, with 1890 as the first downside objective and 1848 as the next support target if selling pressure strengthens.
ETH Ready to Explode Above $2,000ETHUSD continues to show a constructive bullish structure after repeatedly holding the 1,850–1,800 demand zone, where buyers have consistently stepped in to absorb selling pressure. Despite recent consolidation beneath resistance, price remains supported above the key dynamic trend indicators, suggesting accumulation rather than distribution.
The market is currently trading within a range, with the 1,980–2,000 resistance zone acting as the primary barrier to further upside. A decisive breakout above this supply area would likely trigger buy-side liquidity and confirm a continuation of the broader bullish trend.
The series of higher highs and higher lows established earlier in the trend remains intact, indicating that buyers are still in control. As long as ETHUSD continues to defend the 1,850–1,800 support region, the bullish outlook remains favorable.
Bullish Targets
🎯 Target 1: 1,950 – First resistance and short-term liquidity objective.
🎯 Target 2: 2,000 – Major breakout level and psychological resistance.
🎯 Target 3: 2,100 – Primary bullish objective following a confirmed breakout above the resistance zone.
A sustained move above 2,000 would strengthen bullish momentum and increase the probability of an impulsive rally toward 2,100, while the 1,850–1,800 demand zone remains the key support that bulls must defend to maintain the current market structure.
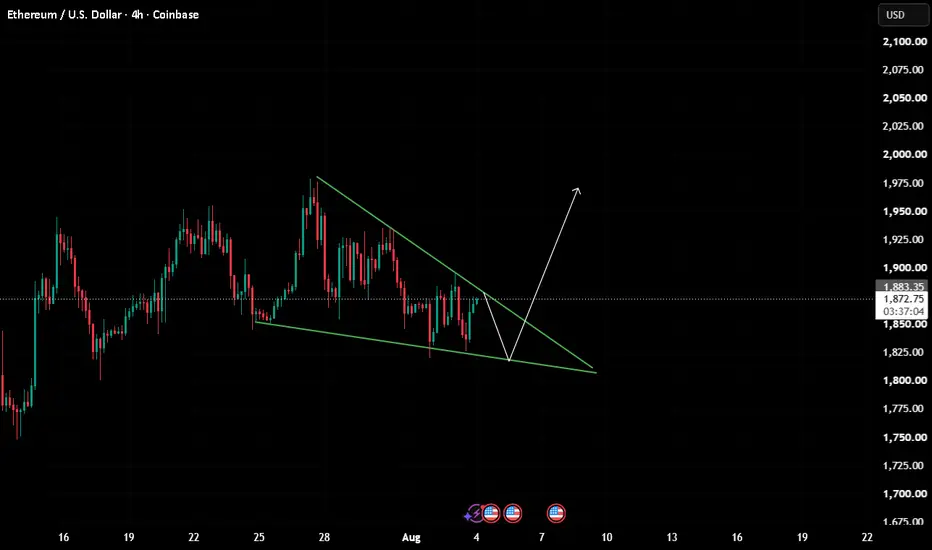
ETHUSD H4 | Potential Bearish DropBased on the H4 chart analysis, we can see the price reacting off our sell entry level at 1,874.19, a pullback resistance.
Our stop loss is set at 1,960.69, which is a pullback resistance.
Our take profit is set at 1,800.28, an overlap support that aligns with the 38.2% Fibonacci retracement.
High Risk Investment Warning
65% of retail investor accounts lose money when trading CFDs with this provider. You should consider whether you understand how CFDs work and whether you can afford to take the high risk of losing your money.
Ethereum Daily Analysis | Smart Money AccumulationEthereum is holding above a key support zone, keeping the bullish outlook intact. A confirmed reaction from this area could drive price toward the major liquidity and the higher POI.
Key Highlights:
* ✅ Strong support zone holding.
* ✅ Liquidity rests above recent highs.
* ✅ Bullish structure remains valid.
* ✅ A clean breakout could fuel further upside.
💡 Trade with confirmation, not emotions. The best opportunities come from patience and disciplined execution.
Not Financial Advice. Trade at your own risk.
ETHUSD Bullish Outlook | POI Retest Before Major Expansion Ethereum continues to respect its bullish higher-timeframe structure after multiple Breaks of Structure (BOS) confirmed buyer dominance. Price is expected to retrace into the highlighted Point of Interest (POI), where institutional demand could fuel the next bullish expansion.
Key Technical Observations:
* ✅ Bullish market structure remains intact.
* ✅ Multiple BOS confirmations indicate strong buying momentum.
* ✅ Liquidity is resting above recent highs.
* ✅ POI is the preferred area to watch for institutional buying.
* ✅ A bullish reaction from this demand zone could lead to a continuation toward premium liquidity levels.
Trading Plan:
* 📍 Wait for price to retrace into the POI.
* 📍 Look for bullish confirmation (Market Structure Shift, CHoCH, or strong bullish candle).
* 📍 Place Stop Loss below the POI.
* 📍 Target the previous highs first, then higher liquidity zones as momentum builds.
💡 The highest-probability trades come from patience and confirmation—not chasing price. Let the market come to your level before executing your setup.
Not Financial Advice. Trade at your own risk.
100k is end game.circled in green is where i believe eth is in the current cycle relative to btc's:
---
people have given up on CRYPTOCAP:ETH , yet the world’s largest institutions continue accumulating it while building the foundations of a new global financial system upon its chain. while the crowd has spent the last half decade drowning in doom and gloom, CRYPTOCAP:ETH has quietly carved out an enormous monthly 1, 2 setup.
---
if my postulation is correct, the coming waves into the 2030's will likely become increasingly contracted, as wave (1) already produced a historic extension.
---
100k+ is end game.
How One Interest Rate Decision Moves the Entire Economy?The Domino Effect of Interest Rates:
Most traders know that interest rate announcements can move the market, but very few understand why they have such a powerful impact. An interest rate decision does not only affect banks or currencies. It creates a chain reaction that spreads through the entire economy. Just like a row of dominoes, one small action can trigger a series of events, with each event leading to another. By understanding this chain reaction, traders can better understand why markets behave the way they do.
The First Domino
Every chain reaction begins with a single domino, and in the economy, that first domino is the central bank. Institutions such as the Federal Reserve or the European Central Bank change interest rates to keep the economy balanced. If inflation is rising too quickly, they usually increase interest rates to slow spending. If the economy is weak, they lower interest rates to encourage borrowing and investment.
Although changing an interest rate may seem like a simple decision, it is often the starting point of much larger economic changes. One announcement from a central bank can influence millions of people, thousands of businesses, and financial markets around the world.
Borrowing Becomes More Expensive
When interest rates rise, borrowing money becomes more expensive. Banks charge higher interest on mortgages, business loans, and personal loans, which means people have to pay more to borrow the same amount of money. Businesses also face higher financing costs when they want to expand or invest in new projects.
Because borrowing is no longer as affordable, both consumers and businesses become more cautious with their money. This is the second domino in the chain, and it begins slowing economic activity.
Consumer Spending Slows
As loans become more expensive, people naturally begin spending less. Some families delay buying a new home, others postpone purchasing a new car, and many reduce spending on non-essential items. Instead of taking on new debt, they focus more on saving and managing their finances carefully.
When millions of people make these decisions at the same time, overall demand in the economy starts to decline. Businesses begin noticing fewer customers and lower sales, even though nothing has changed about their products.
Businesses Feel the Impact
Businesses rely on consumer spending to generate revenue. When customers spend less, companies often experience slower sales and lower profits. Expansion plans may be delayed, investments may be reduced, and companies become more careful about their future decisions.
This slowdown is not because businesses suddenly become less efficient. It is simply a result of fewer people buying goods and services. The effects of higher interest rates have now spread from consumers to businesses.
Hiring Begins to Slow
As businesses earn less, they also become more cautious about hiring new employees. Instead of expanding their workforce, many companies decide to freeze recruitment until economic conditions improve. Some businesses may even reduce staff to lower their operating costs.
With fewer job opportunities available, income growth across the economy begins to slow. This causes consumers to spend even less, allowing the domino effect to continue.
Inflation Starts to Fall
One of the main reasons central banks raise interest rates is to reduce inflation. When borrowing decreases and spending slows, demand for goods and services begins to fall. Since fewer customers are competing to buy the same products, businesses find it harder to keep increasing prices.
This gradual reduction in demand helps bring inflation back under control. Although the process can take several months, it is the outcome central banks are trying to achieve when they increase interest rates.
The Currency Becomes Stronger
Higher interest rates often attract foreign investors because they can earn better returns on savings and government bonds. Before investing, these investors need to buy the country's currency, increasing demand for it in the foreign exchange market.
As demand for the currency increases, its value often rises against other currencies. This is one of the main reasons why Forex traders pay close attention to every interest rate decision made by central banks.
My Thoughts:
An interest rate decision is much more than a number announced by a central bank. It is the first domino in a long chain of economic events. Higher rates make borrowing more expensive; expensive borrowing reduces spending; lower spending affects businesses, businesses slow hiring, inflation begins to cool, and currencies often become stronger. Every step leads naturally to the next.
The next time you hear that a central bank has changed interest rates, don't just focus on the immediate market reaction. Instead, think about the entire chain of events that has just begun. Understanding the domino effect can help you understand not only today's market movement, but also the economic story that will continue unfolding in the weeks and months ahead.
By @BrightRally_Research on @TradingView
Tom Lee's Ethereum Era. My Ethereum Season Thesis Is Playing OutTom Lee's Ethereum Era. My Ethereum Season Thesis Is Playing Out 👑🚀
Over the past few weeks, one name has become impossible to ignore in the Ethereum conversation: Tom Lee.
His growing conviction in Ethereum and the recent developments surrounding BitMine have reignited institutional interest in ETH. Whether you agree with every aspect of his thesis or not, one thing is becoming clear—Ethereum is once again at the center of the conversation.
What's interesting is that this lines up with what I've been discussing for some time.
In my previous Ethereum Dominance analysis, I explained why I believed we were approaching the conditions for an Ethereum season. The idea wasn't based on hype—it was based on technical structure, capital rotation, and the historical relationship between Bitcoin and Ethereum dominance.
Today, that thesis remains intact.
From a technical perspective, Ethereum continues to build from a major support zone while attempting to reclaim its long-term trend.
The first key resistance remains 2,442 . A sustained move above that level shifts the focus toward 2,765 .
Beyond that, I continue to target the previous cycle highs around 4,697 , with the longer-term roadmap still pointing toward the all-time highs near 5,706 .
At the same time, Ethereum Dominance is beginning to stabilize exactly where I expected it to. If dominance starts expanding from here, it would strengthen the case that capital is rotating into Ethereum—a key ingredient for the Ethereum season thesis I shared in my previous analysis.
Institutional narratives may change.
Headlines may come and go.
But when fundamentals begin supporting a technical thesis that's been building for months, it's worth paying attention.
Is this the beginning of Tom Lee's Ethereum era?
The charts are certainly giving Ethereum a chance to prove it.
Trading Wisdom 📜
Markets often reward those who prepare before the narrative becomes popular. By the time everyone agrees on a story, much of the opportunity has already passed. Watch the charts, understand the rotation, and let price confirm the thesis.
Disclaimer
I'm not a financial advisor — I'm a master of Prognosis. These are my personal views. I read charts like a poet reads the stars. You still gotta trade at your own risk. 🧠💥
One Love,
The FXPROFESSOR 💙
ETHUSD H1: Resistance Has Stopped the RallyAfter a strong recovery from the recent low, ETHUSD moved directly into the 1,915–1,920 resistance zone but failed to sustain the breakout. Clear selling pressure emerged in this area, quickly pushing price lower and interrupting the short-term bullish structure.
What stands out is that buyers have attempted to break through this resistance several times without success. This suggests that supply remains strong above, while bullish momentum is gradually weakening after the previous recovery.
If price continues to trade below the resistance zone, I expect ETHUSD to correct toward the 1,885–1,890 support area. This will be an important zone for determining whether buyers still have enough strength to preserve the recovery structure. The current bearish pressure will only begin to weaken if price breaks decisively above 1,915–1,920.
This analysis reflects only my personal view. Please make your trading decisions based on your own analysis.
Wishing you successful trading!
(Maybe?) Unpopular Opinion- Bottom in, Major Rally VERY Soon
If you wanna debate technical analysis and market sentiment and all that you are overcomplicating things dramatically. The market is and has been dumb for an extended period of time now. The AI bubble has at least 1 more leg up and with the QQQ and SPY regaining all time highs at a rapid rates in spite of EVERYTHING going on in the world, everyone knowing this yet still buying and taking on more risk, etc. everything in my gut is screaming its time for ETH to rally big and fast. BTC too, but ETH more so.
Why is the SPY and QQQ mooning during the last year while crpyto is being sold off slowly, bleeding for months, constantly stuck in ranges? Because Trump set off the crpyto rally too early and shook it up. Because everyone thought it would pump but rules and rules and its always max pain, max accumulation, max doubt, and then when you least expect it you pull up the charts and you missed the first 40% of the rally in just a week. There is simply no way stocks like AMD, SPCX, TSLA, TSM, etc are staying with market caps higher than ETH. There is no way the market cap of ETH does not pass AMD by end of year.
ETH will not be 1/3 of AMDs market cap in 1 month. If all these companies are valued this high, I simply must insist that ETH is severely undervalued at less than a ONE TRILLION USD market cap. Get it and do it soon, we are about to start. ETH USD monthly chart is gonna have a big bullish engulfing candle for August, mark my words.
What Really Happens Inside One Candle?When traders look at a chart, they usually see a green or red candle and immediately decide whether buyers or sellers were stronger. But a single candle is much more than a colored bar on the screen. It is the final result of thousands of buy and sell orders, stop losses, limit orders, and market orders interacting with each other within a short period of time. Every candle tells a story that most traders never see.
A bullish candle, for example, does not simply mean buyers entered the market. Behind that candle is a sequence of events that unfolded in real time. Understanding what happens inside one candle can completely change the way you read price action and help you see the market beyond simple candlestick patterns.
It Starts With Accumulation:
Every strong move usually begins quietly. Before price rallies, large institutions often need to build positions without attracting attention. If they buy everything at once, their own orders would push the price much higher before they finish buying.
Instead, they accumulate positions gradually. During this phase, price often moves sideways because buying and selling remain relatively balanced. While retail traders may see a boring range, institutions are patiently building positions behind the scenes. This accumulation becomes the foundation for the next move.
Liquidity Comes First:
Before price can move higher, institutions need enough sell orders to buy from. Those sell orders often come from retail traders placing stop losses below recent lows or entering short positions at support.
As price briefly moves lower, many stop losses are triggered and new sellers enter the market. What looks like a bearish move to most traders is often the moment institutions find the liquidity they need. Without enough sellers, large buy orders cannot be executed efficiently.
Market Orders Push the Price:
Once enough liquidity has been collected, aggressive buying begins. Market buy orders start consuming the available sell orders in the order book. As more sell orders are absorbed, price begins moving upward.
This is the stage where the candle starts growing. Retail traders often believe the move begins here, but in reality, most of the preparation happened earlier during accumulation and liquidity collection.
Limit Orders Keep the Market Balanced:
While market orders are responsible for moving price, limit orders help control that movement. As buyers continue pushing upward, new sell limit orders appear from traders taking profits or opening short positions.
These limit orders temporarily slow the rally and create the small pullbacks and wicks that appear inside the candle. The market is constantly balancing aggressive buyers against passive sellers, creating the shape of the candle one transaction at a time.
The Candle Finally Closes:
By the time the candle closes, thousands of individual transactions have already taken place. Buyers and sellers have continuously exchanged positions, stop losses have been triggered, liquidity has been consumed, and institutions may have completed part of their execution.
To most traders, the finished candle simply looks bullish.
To someone who understands market mechanics, it represents an entire battle that unfolded between buyers and sellers during that period.
Every Candle Is More Than a Pattern:
Many beginners spend months memorizing candlestick patterns without asking how those candles were actually formed. A bullish engulfing pattern or a large bullish candle is not powerful because of its shape. It is powerful because of the buying and selling activity that created it.
When you understand the sequence behind a candle, you stop seeing random bars and start seeing the flow of orders inside the market. Every wick tells you where price was rejected. Every body shows who gained control. Every close reflects the final balance between buyers and sellers.
My Thoughts:
A single candle may seem simple, but it is one of the most information-rich objects on a trading chart. Behind every bullish candle are institutions accumulating positions, liquidity being collected, stop losses being triggered, market orders consuming available liquidity, and thousands of participants making decisions at the same time.
The next time you look at a single candle, don't just ask whether it is bullish or bearish.
Ask yourself,
"What had to happen for this candle to exist?"
Because every candle is not just a price movement. It is the visible result of thousands of invisible decisions happening inside the market.
By @BrightRally_Research
XAGUSD H1: Are Buyers Gradually Running Out of Strength?XAGUSD has maintained a strong bullish move with a series of higher highs, but recent price action shows that the upward pace is clearly slowing. After forming a new high around 62.50–62.80, price has failed to extend the move and has begun consolidating while renewed selling pressure appears.
What stands out is that each new bullish leg is becoming shorter, while price is now trading close to the nearby support zone around 61.10–61.30. This suggests that buyers are still preserving the bullish structure, but momentum is no longer as strong as before and the risk of a deeper correction is increasing.
If the nearby support breaks, I expect XAGUSD to pull back toward the 59.70–60.00 area. This scenario would become even clearer if price fails to create another new high and begins forming a lower high.
This analysis reflects only my personal view. Please make your trading decisions based on your own analysis.
Wishing you successful trading!
Ethereum - Here comes the bear market bottom!✨Ethereum ( CRYPTO:ETHUSD ) is retesting incredible support:
🔎Analysis summary:
Over the past two weeks alone, Ethereum is already up a decent +20%. And with this first push higher, Ethereum is nicely starting to respect a clear higher timeframe support area. This could very well be the bottom and Ethereum is starting another +150% bullrun soon.
📝Levels to watch:
$1,500 and $4,500
Keep your #LONGTERMVISION🙏
— Phil (@TheTraderPhil)
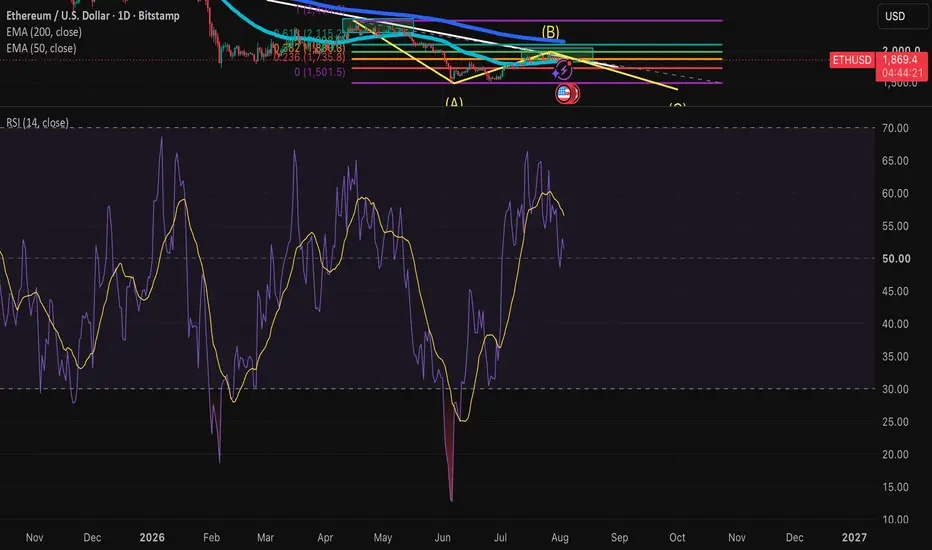
Ethereum (ETH) Macro Headwinds & Wave C Unfolding🌍 Fundamental & Macro Overview:
Ethereum (ETH) is currently navigating a complex macroeconomic landscape. Broad risk-off sentiment is sweeping across major markets, driven by recent institutional outflows and the US Federal Reserve keeping the federal funds rate unchanged at 3.5%-3.75%. Fed Chairman Kevin Warsh has delivered a hawkish outlook, reaffirming the central bank's commitment to a 2% inflation target. Furthermore, escalating geopolitical tensions have pushed crude oil prices back toward $90 a barrel, intensifying inflation concerns and the prospect of higher-for-longer interest rates. This environment is putting pressure on risk assets, aligning perfectly with the technical structure we are observing on the charts.
📊 Technical & Quant Analysis (1D Timeframe):
Looking at the daily chart for Ethereum, we see a clear convergence of quantitative factors pointing toward a defensive posture:
Elliott Wave & Price Action: ETH is currently respecting a key Fibonacci resistance zone. Short-term indicators suggest that a bearish Wave (C) is beginning to unfold, seeking lower liquidity zones. The price recently lost the 20-day EMA at $1,867.9, leaving the 50-day EMA at $1,849.0 as the immediate structural support.
Momentum & Moving Averages (EMAs): The broader trend is facing resistance. The 100-day EMA at $1,926.0 has capped recent upward attempts, and the 200-day EMA at $2,159.8 continues to slope downward. The MACD histogram has widened into negative territory, confirming a bearish momentum shift.
RSI & Leverage Warning: Crucially, the 14-day RSI is sitting squarely in neutral territory near the 50 line. Because we are not seeing overbought levels on the RSI, initiating highly leveraged short positions right now is not prudent. The market has not stretched enough to guarantee a high-probability, massive flush from this exact point without potential whipsaw volatility.
🎯 Strategy & Next Steps:
Given the current geopolitical climate and the lack of an overbought RSI signal, the most prudent short-term approach is patience. Waiting for clearer confirmation or executing shorts with extreme care and low leverage is the optimal play. A daily close below the 50-day EMA at $1,849.0 could confirm the Wave (C) continuation toward the $1,750 zone.
⚠️ Disclaimer: This post is strictly for educational purposes and intended to intellectually enrich the trading community. It is NOT financial or investment advice. Always manage your risk and execute trades based on your own quantitative research.
ETH: H1 Soup Into HTF Supply_Dump ComingEthereum is trading inside a high-timeframe premium zone where multiple bearish confluences are beginning to align.
Price has already delivered an H1 liquidity sweep (Turtle Soup) into an H4 Breaker while sitting beneath a Daily Fair Value Gap. If buyers fail to reclaim this area, the odds favor a move lower to rebalance liquidity resting beneath the market.
What I'm Watching
• H1 Turtle Soup into HTF resistance.
• H4 Breaker acting as a rejection zone.
• Daily FVG overhead limiting upside.
• Multiple sell-side liquidity pools remain untapped.
Trade Plan
📍 Watch for bearish confirmation inside the H4 Breaker.
📉 Failure to hold above the current premium zone could trigger a sweep of the nearest sell-side liquidity.
🎯 If momentum continues, price may target the deeper liquidity pools below.
As always, liquidity provides the roadmap, but confirmation decides the trade.
Not financial advice. Always manage your risk.
ETHUSD: Peaked and this rejection is targeting $1,360Ethereum remains highly bearish on its 1W technical outlook (RSI = 41.527, MACD = -300.290, ADX = 21.473) as the long term bearish trend remains intact. This week capitalized on the failure to cross above its 1D MA200 and with a standard LH Bearish Divergence formed on the 1D RSI, it seems to have technically peaked. This is the very same formation that was seen on all 3 prior market peaks of the Bear Cycle. The rejection on the 0.5 Fibonacci level is another similarity and according to this, ETH may drop to the 1.236 Fibonacci extension (TP = 1,360).
## If you like our free content follow our profile to get more daily ideas. ##
## Comments and likes are greatly appreciated. ##
ETH PERPETUAL TRADE SELL SETUP Short from $1922ETH PERPETUAL TRADE
SELL SETUP
Short from $1922
Currently $1922
Targeting $1865 or Down
(Trading plan IF ETH
go up to $1970 will add more shorts)
Follow the notes for updates
In the event of an early exit,
this analysis will be updated.
Not a Financial advice
ETH/USD Long: Price Reclaims Support After RSI DivergenceMy read, straight up: ETH bottomed, printed a bullish RSI divergence, and took back the level that used to stop every rally. I'm long. Entry near $1,850, stop under $1,516, target $2,386.
What I see
ETH sold off hard and made its low near $1,516. But look at the RSI: while price made a lower low, momentum made a higher low. That gap is a bullish divergence — sellers were running out of power even as price kept dropping. Since then, ETH pushed back above $1,850 and is now holding around $1,915. The level that was a ceiling is now a floor.
Why it matters
This is simple. When a key level flips from resistance to support, and momentum is already turning up under it, the odds favor the buyers. I'm not guessing a bottom — the chart already showed me the turn. My job now is to trade with it, not against it.
The plan
Direction: Long
Entry: ~$1,850 on a pullback (best), or here around $1,915
Stop loss: $1,516
Target: $2,386
Risk / Reward: about 1.6 to 1 from $1,850
Where I'm wrong
If ETH closes back below $1,516, the trade is dead. The low failed, the divergence failed, I'm out. If price loses $1,850 and can't climb back over it within a day or two, I step aside and wait. No ego. The stop is the stop.
What I'm watching
Hold above $1,915 → the road opens to $2,000, then $2,200, then $2,386.
RSI staying above its signal line (around 56) keeps the momentum on my side.
Rising volume on any push through $2,000 tells me it's real, not just a bounce.
That's the whole idea. Clear level, clear trigger, clear invalidation. Trade your own plan and your own size.
This is my chart read, not financial advice.
#ETH #Ethereum #ETHUSD #Crypto #RSIDivergence #TechnicalAnalysis #CryptoTrading #Altcoins