Long trade
🧠 Trade Context
Pair: ETHUSDT / ETHUSDC.P
Session: London AM
Direction: 🟢 Buyside / Long
Entry: 1654.64
Stop: 1643.51
Profit Target: 1776.22
R:R: 10.92
⚡ SNAP TRIGGER
Trigger Type 🟢 Sellside Sweep → Bullish OB Reaction → Reclaim Trigger
Trigger Sequence
💧 Price sells into lower range liquidity.
🔹 Price taps the bullish OB/inefficiency zone.
🟢 Price reacts to the low.
✅ Entry activates around 1654.64.
🎯 Price targets buyside liquidity at 1776.22.
🔍 Market Context
🔹 ETH previously traded from the upper range into a strong bearish delivery leg.
🔹 Price has reached the lower range/discount area.
🔹 A bullish order block and inefficiency zone are marked around the entry area.
🔹 The low has been attacked, creating a potential sellside manipulation event.
🔹 Price is now attempting to reclaim from the lower zone.
🔹 The trade is targeting the opposite side of the range, with 1776.22 as the main
buyside PAY level.
ETHUSDT — London AM Buyside Sweep Recovery
ETH has sold into the lower range and tapped a bullish OB/inefficiency zone.
The trade idea is based on a sellside sweep reaction and reclaim from discount to initiate a buyside entry.
In-depth trading ideas
ETH - Picture Perfect Market StructureETH has created some of the most structurally sound and predictable market structure we have seen in a while, and I want to go back through my previous posts to outline how I was able to identify this structure and predict this drop was going to happen.
May 5, 2026: Both Scenarios Outlined
Let's start with the current chart I have laid out for this idea:
The left pattern was an ascending triangle with a bullish bias and the right pattern was a rising wedge with a bearish bias. After that post, ETH saw two more perfect rejections right at the top of the ascending triangle before breaking down from the bottom. Therefore any retest back to the lower trendline will be a bearish retest and lead to a continuation of the downtrend. The right chart saw one more wick to the solid black trendline of the rising wedge before falling back to the lower support trendline. ETH is currently in the process of confirming the breakdown below that support trendline.
March 2026
This breakdown is no coincidence. I outlined this strong level of potential supply and selling around $2,400 as far back as March 2026, when I first pointed it out as the "First Target" being the 1.618 extension here:
April 13, 2026
I pointed out ETH's 3D double top on April 13th, which then led to a triple top on May 1st. I will also be posting a follow up idea to this chart:
April 17, 2026
When ETH was trading around $2,420 I posted this idea outlining the major bearish divergence that was forming. I will be making a fully updated follow up idea to that post so stay tuned:
April 22, 2026
I highlighted once again the repeated rejections price was seeing at the 1.618 around $2,400:
April 27, 2026
Then again the significance of the $2,380 level was outlined here:
May 6, 2026
Finally, I pointed out the 2D gravestone doji that marked the top for ETH before this 12% decline began:
Trust the charts before you trust your emotions. I cannot outline a better technical playbook than the ETH market structure that predicted this downside move step by step. Hopefully you have all been following along and were able to gain value and learn from these ideas!
ETH Ethereum Price TargetIf you haven`t sold this top:
The bear case:
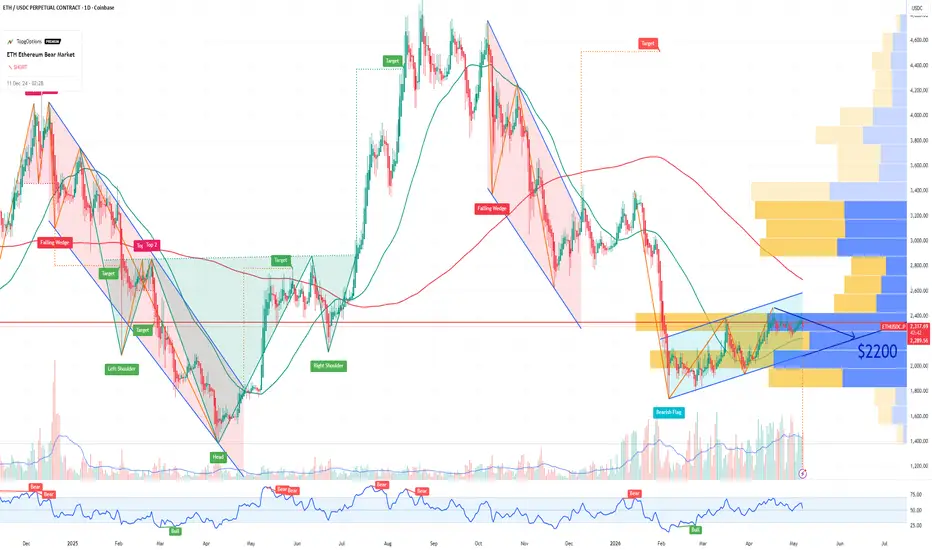
Technical vulnerability at key levels: $2,200 has acted as major support/resistance multiple times in 2026. ETH is showing signs of a short-term descending pattern; failure to reclaim $2,400 resistance and hold above the 50-day EMA could trigger a swift retest of $2,200, with a break opening the door to $2,000–$2,100
Macro headwinds pressure risk assets: Sticky inflation, elevated energy prices, and the Fed’s cautious stance on rate cuts (unlikely before mid-2026) continue to weigh on high-beta plays like Ethereum. ETH remains tightly correlated with broader risk sentiment — any equity correction or delayed liquidity boost hits altcoins hardest.
On-chain and sentiment fatigue: ETF inflows have slowed or turned mixed in recent months, while whale distribution on rallies and cooling retail participation increase corrective risk. Despite solid Layer-2 activity, lack of fresh catalysts (post-Glamsterdam hype fade) leaves ETH exposed to short-term selling pressure.
What serious analysts & outlets are saying:
MEXC / CoinJournal: $2,200 is the critical make-or-break level — breakdown risks a 5–10% move lower.
InvestingHaven: Bear-case range for 2026 includes retest of $2,000 or below if macro pressure persists.
Bear flag patterns and failed breakouts above $2,200 point to downside first; cautious bias until clear reclaim.
Motley Fool (short-term notes): While long-term bullish, near-term uncertainty from macro and ETF flows could see ETH grind back to support zones like $2,200.
Bottom line: Technical weakness around current resistance, ongoing macro caution, and fading short-term momentum make a retest of the established $2,200 support a realistic and high-probability scenario in the coming weeks.
ETH - Both Scenarios ETH is about to make a major move and I wanted to outline both patterns I am currently seeing in the charts so we can be prepared for either direction.
Ascending Triangle (Left Chart)
Starting with the bullish argument, ETH appears to be forming an ascending triangle with the top of the triangle sitting around $2,380 to $2,400. I have outlined the significance of this level in detail across many previous ideas:
If ETH is able to close two consecutive daily candles above the top of the triangle (given that price previously saw a false break above this level) the full measured move would target around $3,250. This would also align with Target 3 from the last linked idea, though the "Main Target" level should also play a role if the breakout occurs.
Rising Wedge (Right Chart)
On the contrary, the right chart outlines the bearish scenario. Price could be forming some sort of rising wedge or bear flag. If price gets rejected once again and breaks the lower support trendline, the measured move to the downside would be approximately $1,820.
It is too early to say with certainty which direction will be chosen, but I wanted to lay out both scenarios in advance so we can be fully prepared for whichever one plays out.
My scanner has dissected Ethereum’s DNAMost traders bleed money because they listen to opinions. We listen to the frequency. 🎧📉
In a world saturated with "trust me bro" analysis, we’ve completely tuned out the noise. We aren't seeking confirmation—we’re tracking mathematical necessity. My scanner has dissected Ethereum’s DNA, and the verdict is clear:
ETHUSD – Discount Reaction or Bearish Continuation?Overall context:
Market structure is clearly bearish (multiple BOS down)
Price below EMA200 → institutional bearish bias
Current reaction from discount / liquidity zone
🔍 What’s clear on chart:
1. Structure:
Strong bearish impulse → BOS confirmed
Then a minor bullish CHoCH → reaction, not reversal
2. Liquidity:
Sell-side liquidity (HL 1745) taken ✔
Price now in a reaction zone
3. Current range:
Between:
PDL (1968) – support
PDH (2076) – resistance
Your entry (~2106) = under resistance → risky positioning
⚖️ Scenarios
🟢 Bullish (weaker scenario):
If price:
holds above PDL
breaks 2150 with BOS
➡️ targets:
TP1: 2473
TP2: 2839 (EMA200)
→ This is just a pullback in bearish trend
🔴 Bearish (primary scenario):
If price:
rejects from current zone
breaks below 1968
➡️ continuation:
Toward new lows <1900
Confirmed by LTF BOS
🎯 Final verdict:
👉 This is a reaction zone, not confirmation
👉 Your long is counter-trend
👉 Key levels:
2150 = bullish confirmation
1968 = invalidation
Holding out for 1750?!Hello everyone!
In this video, I explain a little bit more about how I use the 1h McGinley Dynamic average (yellow dotted line) in my analysis, as well as candles where I look for supply and demand. Currently, I am short ETH and holding out to see if price will get back down to 1750.
I will be watching the 4h McGinley Dynamic average (thick blue line) closely to see how price reacts, as well as taking off half of my position as soon as price is trending near some recent lows that saw some buying previously.
Thank you for following! Trade simple. Trade small. Live to trade another day!
ETHUSD - More Downside To Come? I think so...Hello everyone, happy trading out there!
In this video, I will take you through my analysis of ETHUSD and why I believe there is more room for this crypto pair to fall.
Using the 'Core' strategy using 1h and 4h (5) period McGinley Dynamic averages, as well as VWAP (Monthly) and the Money Flow Index (MFI), I will show you why I believe ETH has more room to continue falling.
I hope this video helps bring you more clarity and understanding. Feel free to use these tools in your own way and find out what works best for you in your trading!
See you on the next video!
Keeping It Simple - Incorporating the Money Flow Index (MFI)In this video, we will be looking at the 'Core' of the Heiken Ashi McGinley Dynamic trading strategy (it needs an official name - it's coming...!) PLUS how to incorporate the Money Flow Index (MFI) into the strategy.
In the last video, using 'Bar Replay,' we went back in time to a random bar and applied ONLY the core strategy using HA candles and a (5) period McGinley Dynamic Average.
***CORE STRATEGY***: We will always trade AT or NEAR the average. We will BUY if the price closes ABOVE the average and SELL if the price closes BELOW the average.
In this video, we looked at how to identify BULLISH/BEARISH Divergence using price and the MFI, and we took another trade and got STOPPED OUT AGAIN!!!
So far, we are down (3) trades. As we add more components to the strategy, will we gain a better understanding of the true market direction and where it might be headed so that we can make up for our losses?
We will find out in the next video!
See you there!
Keeping It Simple - Trading the Core!In this video, we will be looking at the 'Core' of the Heiken Ashi McGinley Dynamic trading strategy (it needs an official name - it's coming...!)
Using 'Bar Replay,' we will go back in time to a random bar and apply JUST the core strategy using HA candles and a (5) period McGinley Dynamic Average.
We will always trade AT or NEAR the average. We will BUY if the price closes ABOVE the average and SELL if the price closes BELOW the average.
In this video, we took the trade and got STOPPED OUT!!! In the next video, we will ADD another component of the strategy to see how THAT component might have helped us make a better decision before pulling the trigger...
See you in the next video!
The Crap Works!Hello everyone,
I've been trading some similar version of this strategy for about 1-2 years now, and it has allowed me to be more consistent, free, and humble in how I look at the markets. PLEASE DO NOT FOLLOW how I do things verbatim (unless you would like to!)
Feel free to take what I have here and modify it to fit your own trading personality and goals that YOU have!
I hope this video has been helpful for you, and I look forward to hearing your feedback!
ETH/USDC: A Gentle Unfolding of Harmonious Flow (3H Timeframe)In the serene cadence of the market, ETH/USDC presently dwells within a balanced range of 2685–3065 on the 3-hour chart.
From the perspective of the Harmonious Flow of Energy, this consolidation is not mere hesitation, but a quiet accumulation — a space where forces align in subtle proportion, neither overpowering the other, yet preparing for natural resolution.
The structure speaks of restraint: proportional waves, measured volumes, and a context that favours continuity over disruption. The energy here feels contained, yet directed — pointing toward an upward release when the balance tips with clarity.
A breakout above the range carries a calm probability of extension toward 3800–4000, a zone where past resistance may gently invite reflection. There, the flow could pause, allowing a harmonious correction — not a reversal, but a respectful return to test the conviction of buyers who entered within 2685–3065.
Such a retracement would serve the deeper rhythm: affirming strength without excess, protecting positions with poise rather than force.
This reading requires no urgency. When the elements — flow, harmony, proportion, and context — converge without pressure, the path reveals itself simply. Until then, we observe with lightness.
Wishing you clarity in the flow.
Ethrium:next what!4-hour Ethereum (ETH/USDC)
**Resistance zones** sit around **$3,588**, **$3,805**, and **$3,886**, while a stronger barrier lies near **$4,112** — the upper edge of the channel. On the downside, **$3,167** is the key support being tested right now, and if it breaks, ETH could slide toward **$2,745**, where stronger buying may appear.
Overall, the trend remains **bearish**, though a short-term bounce is possible if ETH holds above $3,167. For a real bullish reversal, the price needs to break above the channel and stay over the 38.2% retracement zone.
---
Ethereum Short on Weekly? ETH broke the weekly support. Bear 🐻 around?
🔮 Ethereum (ETH) Short-Term Market Overview
* Recent Trend: Ethereum has shown a degree of volatility recently but has generally been in a consolidation phase. In the past week, some sources indicate the price has seen a slight increase (around +1.69% to +3.69% in the last week), although it has experienced a minor pullback on the most recent day.
* Key Price Zones:
* Support: Immediate support is often identified around the $3,888 - $3,900 range. Holding this level is seen as crucial for maintaining an upward bias. The $3,900 and $3,972 levels (100-day EMA) are also noted as significant support points.
* Resistance: Key resistance is seen around the $4,100 – $4,200 band, which includes the 20-day and 50-day Exponential Moving Averages (EMAs). A decisive break above this zone would be a strong bullish signal.
* Consolidation: The price appears to be trading within a range (or a "sideways channel") between approximately $3,900 and $4,200 as it consolidates recent movements.
📈 Technical Outlook for the Week Ahead
Most analyses suggest the following scenarios for the next seven days:
| Scenario | Price Action | Target Range | Key Condition |
|---|---|---|---|
| Bullish Case | A clean breakout and a weekly close above the major resistance zone. | $4,350 to $4,450 | Breaking the $4,260 level would signal a stronger upward trend. |
| Consolidation | Price remains range-bound as market participants wait for a major catalyst. | $3,900 to $4,200 | Failure to break the EMA resistance barrier. |
| Bearish Case | A decisive move below the immediate support zone. | Potential testing of lower supports. | Breaking below $3,900 means bearish flag.
📰 Market Factors to Watch
* Macroeconomic News: Upcoming economic announcements, particularly from the U.S. Federal Reserve (such as interest rate decisions), can significantly impact the entire crypto market. Lower rates are often seen as favorable for riskier assets like Ethereum.
* ETF Flows: The flow of funds into and out of Ethereum Exchange-Traded Funds (ETFs) is a significant indicator of institutional interest and can move the price.
Important Note: Price predictions are based on technical analysis and market sentiment, and they are not guaranteed. The cryptocurrency market is highly volatile, and you should always conduct your own research before making any investment decisions.
Would you like me to look up the current price of Ethereum or recent news updates related to its network developments?
Ethereum-Game start nowtechnical analysis with key support and resistance
The Ethereum/USDC daily chart shows a recent breakdown from its rising channel, with clear Fibonacci retracement levels providing important support and resistance zones. The latest price action suggests a bearish move, making these levels crucial for traders.
### Key Support Levels
- **$3,739**: The 61.8% Fibonacci level acts as the next major support, currently being tested by the price action, which can be seen as a critical pivot for short-term sentiment .
- **$3,171**: The 50% Fibonacci level, if the bearish momentum continues, will become a strong medium-term support to watch .
- **$2,889**: If price falls further below $3,171, the 38.2% level offers deeper support for future reversal attempts .
### Key Resistance Levels
- **$4,012–$4,014**: This cluster near the 78.6% Fibonacci retracement, coinciding with previous consolidation, stands as the major near-term resistance. A move above this level could indicate bullish recovery potential .
- **$4,312–$4,213**: These areas, reflected by recent swing highs and horizontal overlaps, are decisive for medium-term bullish reversals. A sustained move above this region would retest the upper ranges of the previous channel .
- **$4,856**: The 100% Fibonacci extension marks the upper resistance target if bullish sentiment returns aggressively .
### Pattern & Trend Notes
- The breakdown from the ascending channel is a bearish signal, especially as price failed to hold above the 78.6% retracement and is swiftly approaching the 61.8% level .
- Watch for a retest of broken support as resistance, which could trigger additional sell-offs if price fails to reclaim higher ground .
- If price stabilizes above $3,739, a bounce towards $4,012 is possible, but a loss of this support increases risk for downward continuation .
This analysis highlights critical risk and opportunity zones for traders, guiding short-term position management with clear reference levels.