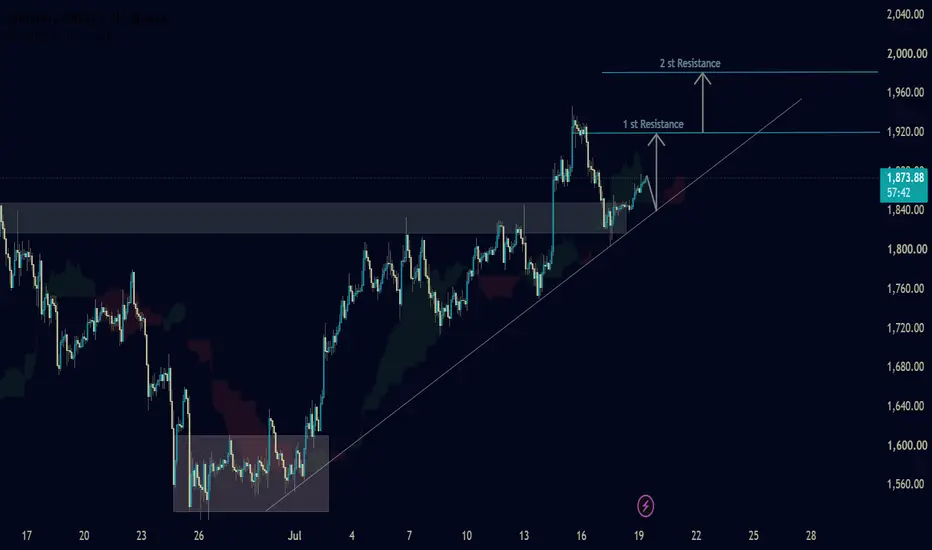
ETH/USDT: THE $1,960 WEDGE RETEST! 🚀🚀
Pulling back right after testing the $1,960 resistance ceiling at 1,956.01! Are you panic-selling this short-term dip, or preparing to buy the ultimate wedge support bounce? 🤔
Ethereum is continuing its strong multi-week ascent, but overhead supply at the horizontal resistance line has triggered
ETH/USDT: THE $1,875 WEDGE REJECTION! 🚀 🛑
Facing heavy resistance around the $1,950 ceiling! Are you blindly chasing this late relief bounce, or lining up your shorts for the impending trendline drop? 🤔
Ethereum is struggling to sustain upside momentum, trading near 1,923.62 as overhead supply weighs heavily on the market. On this 1-ho
Ethereum Price Approaches ResistanceEthereum is approaching a major technical resistance zone around the $2,022 level, where multiple high-confluence indicators are aligning.
This area combines daily resistance with the 0.618 Fibonacci retracement, the VWAP, and the Point of Control, making it one of the most significant levels curr
ETH/USDT: THE $1,960 WEDGE REBOUND! 🚀 🚀
Bouncing right off the $1,870 support line at 1,880.03! Are you panic-selling this local dip, or getting ready to ride the trendline squeeze back to higher highs? 🤔
Ethereum has completed an immaculate retest of its primary macro Support line inside this giant ascending Wedge pattern. While emo
ETHUSDT - The Battle for a Key Support Zone BINANCE:ETHUSDT.P is showing local bullish momentum and appears stronger than Bitcoin in the current market environment. Price action is focused on the 1800–1850 zone, where buyers and sellers are competing for control
Bitcoin remains in consolidation between 61,000 and 65,000, while the broad
ETHUSDT – H2 – Ascending Trendline Continuation SetupETHUSDT – H2 – Ascending Trendline Continuation Setup
Ethereum is maintaining a constructive bullish structure after rebounding from a strong demand zone and establishing a series of higher highs and higher lows. Price has successfully reclaimed key support and is now holding above a rising trendli
ETH – Bearish Rejection at 1930, Eyes on 1730 SweepETH just rejected the 1930 supply zone for a second time, setting up a clean shift lower once the local low breaks.
Why This Level Matters:
Price tapped the same 1930 zone that capped the previous rally and printed another rejection. The reaction is holding, and momentum is now leaning to the dow
ETHUSDT: Watching 1885–1890 for a Potential Short SetupEthereum has rallied back into a key resistance area after losing its short-term bullish structure. I'm watching the 1885–1890 zone for a potential short opportunity if sellers continue to defend this level.
Trade Plan:
Entry (Short): 1885–1890
Stop Loss: 1901
TP1: 1861
TP2: 1842
TP3: 1803
A move
The trading tournaments ERAIn the last post I said the shift I'm betting on for the next two years isn't an asset class. Here it is.
It's the format. Specifically, competitive trading.
Let me back into it from where the industry actually is right now.
Every venue out there - centralized, decentralized, big or boutique -
See all ideas
Summarizing what the indicators are suggesting.
Oscillators
Neutral
SellBuy
Strong sellStrong buy
Strong sellSellNeutralBuyStrong buy
Oscillators
Neutral
SellBuy
Strong sellStrong buy
Strong sellSellNeutralBuyStrong buy
Summary
Neutral
SellBuy
Strong sellStrong buy
Strong sellSellNeutralBuyStrong buy
Summary
Neutral
SellBuy
Strong sellStrong buy
Strong sellSellNeutralBuyStrong buy
Summary
Neutral
SellBuy
Strong sellStrong buy
Strong sellSellNeutralBuyStrong buy
Moving Averages
Neutral
SellBuy
Strong sellStrong buy
Strong sellSellNeutralBuyStrong buy
Moving Averages
Neutral
SellBuy
Strong sellStrong buy
Strong sellSellNeutralBuyStrong buy
Displays a symbol's price movements over previous years to identify recurring trends.