ETH/USDT: THE $1,960 WEDGE RETEST! ๐๐
Pulling back right after testing the $1,960 resistance ceiling at 1,956.01! Are you panic-selling this short-term dip, or preparing to buy the ultimate wedge support bounce? ๐ค
Ethereum is continuing its strong multi-week ascent, but overhead supply at the horizontal resistance line has triggered a controlled, localized pullback. On this 4-hour Binance chart, ETH is coiling beautifully inside a massive ascending Wedge pattern. ๐๐ฅ
Look closely at the purple blueprint trajectory mapping out the upcoming path. The algorithm is executing a healthy, multi-wave pullback down toward the primary Support line near the 1,910 - 1,925 region. This zone represents a high-confluence institutional demand pocket designed to absorb panic sellers and reload long positions before launching a high-velocity rally straight back toward the 1,960 Resistance line. ๐ฏ๐น
Maintaining strict technical patience remains your greatest edge in this market. Chasing prices right under a verified resistance wall is a risky move. Professional desks wait for the price to complete its pullback sequence into verified trendline support before stepping in alongside the smart money. ๐งโโ๏ธโก
Trade Parameters:
๐ Long Zone: 1,910 - 1,925 ๐๏ธ
๐ Stop-Loss: 4h close below 1,885 โ
๐ฐ Take-Profit: 1,960 ๐ฏ
The bears are attempting to build short momentum on this minor pullback, completely unaware of the massive buy wall waiting at the wedge support floor. Stay focused, stick to your execution plan, and let the algorithm do the heavy lifting for you.
Keep your risk strictly managed, maintain composure through the dip, and we will see you back up at the 1,960 resistance target! ๐๐
In-depth trading ideas
๏ปฟETH/USDT: THE $1,875 WEDGE REJECTION! ๐ ๐
Facing heavy resistance around the $1,950 ceiling! Are you blindly chasing this late relief bounce, or lining up your shorts for the impending trendline drop? ๐ค
Ethereum is struggling to sustain upside momentum, trading near 1,923.62 as overhead supply weighs heavily on the market. On this 1-hour Binance chart, ETH is coiling inside a giant ascending Wedge pattern, repeatedly hitting a wall directly beneath its primary Resistance line. ๐๐ฅ
Look closely at the purple blueprint trajectory mapping out the upcoming sessions. The algorithm is poised to execute a brief, deceptive reflex pump back up toward the 1,940 - 1,950 resistance zone to sweep remaining liquidity and trap late breakout buyers. ๐ชค
Once those retail bids are fully absorbed into institutional short books, a sharp stair-step markdown sequence is set to unfold, flushing prices straight down to the lower macro Support line near 1,875. ๐ฏ๐
Maintaining strict technical patience is your absolute edge in this high-volatility environment. Trying to force long positions right under an established macro resistance ceiling is a fast track to getting liquidated. Professional desks wait for the crowd to overextend at resistance before aligning their capital with the smart money flow. ๐งโโ๏ธโก
Trade Parameters:
๐ Short Zone: 1,940 - 1,950 ๐งฑ
๐ Stop-Loss: Hourly close above 1,970 โ
๐ฐ Take-Profit: 1,875 ๐ฉธ
The retail crowd is still holding onto hope for an immediate breakout, completely oblivious to the heavy supply wall waiting right above their heads. Stay disciplined, keep your risk strictly managed, and let the algorithm do the heavy lifting for you.
Don't let short-term lower-timeframe noise shake your confidence. We will see you down at the 1,875 support target floor! ๐๐
Ethereum Price Approaches ResistanceEthereum is approaching a major technical resistance zone around the $2,022 level, where multiple high-confluence indicators are aligning.
This area combines daily resistance with the 0.618 Fibonacci retracement, the VWAP, and the Point of Control, making it one of the most significant levels currently on the chart. When several technical factors converge at the same price, the market often reacts strongly, making this a key area to monitor over the coming sessions.
If Ethereum fails to break above this resistance, the probability increases for a rotational move back toward the lower end of its established trading range. The next major support sits near $1,050, where weekly support is expected to attract buyers if price weakens. Such a move would not necessarily invalidate the broader market structure but instead reinforce the idea that
Ethereum remains range-bound while participants await a stronger catalyst for expansion.
For bulls, reclaiming and holding above the $2,022 resistance would be the first indication that momentum is shifting in favour of a sustained breakout.
Until then, this region is likely to act as a decision point between continuation and rejection. As long as resistance remains intact, traders should expect continued range trading, with price rotating between established support and resistance before the next meaningful directional move develops.
ETH/USDT: THE $1,960 WEDGE REBOUND! ๐ ๐
Bouncing right off the $1,870 support line at 1,880.03! Are you panic-selling this local dip, or getting ready to ride the trendline squeeze back to higher highs? ๐ค
Ethereum has completed an immaculate retest of its primary macro Support line inside this giant ascending Wedge pattern. While emotional retail traders were panic-selling the lower-timeframe dip, institutional buy orders heavily absorbed the sell pressure right at the bottom floor. ๐๐ฅ
Look closely at the purple blueprint trajectory mapping out the upcoming path. The algorithm has established a rock-solid reaction on the lower trendline support and is primed to launch a multi-wave, stair-step expansion straight toward the overhead Resistance line near 1,960. ๐ฏ๐น
Maintaining strict technical patience is your absolute edge in this environment. Trying to force short trades directly into a verified high-timeframe demand floor is a fast track to getting squeezed out. Professional desks wait for the support retest to confirm before aligning their capital with the smart money flow. ๐งโโ๏ธโก
Trade Parameters:
๐ Long Zone: 1,865 - 1,885 ๐๏ธ
๐ Stop-Loss: Hourly close below 1,840 โ
๐ฐ Take-Profit: 1,960 ๐ฏ
The bears who tried to short the bottom of this wedge are rapidly getting trapped as buyers take full control of the price action. Stay focused, stick to your execution plan, and let the algorithm carry the trade up to our target.
Keep your risk strictly managed, maintain composure through the expansion, and we will see you up at the 1,960 resistance ceiling! ๐๐
ETHUSDT - The Battle for a Key Support Zone BINANCE:ETHUSDT.P is showing local bullish momentum and appears stronger than Bitcoin in the current market environment. Price action is focused on the 1800โ1850 zone, where buyers and sellers are competing for control
Bitcoin remains in consolidation between 61,000 and 65,000, while the broader market trend is still bearish. The lack of both fundamental and technical support continues to weigh on the crypto market as a whole.
From a technical perspective, Ethereum has broken above resistance, confirming a short-term bullish structure. During the ongoing correction, price is respecting the local trendline while testing the 1808โ1848 area of interest
Resistance levels: 1848, 1946, 1966
Support levels: 1833, 1807, 1774
The key trigger remains 1848. If bulls can establish sustained consolidation above this level, it could become the technical catalyst for a move toward 1945โ1966
Best regards,
R. Linda
ETH โ Bearish Rejection at 1930, Eyes on 1730 SweepETH just rejected the 1930 supply zone for a second time, setting up a clean shift lower once the local low breaks.
Why This Level Matters:
Price tapped the same 1930 zone that capped the previous rally and printed another rejection. The reaction is holding, and momentum is now leaning to the downside. The local low near 1913 is the trigger that opens the door to a larger move.
Gameplan / Primary Scenario:
Sell the break of the local low around 1913. Once that level gives way, ride the continuation toward the 1828 major target, with room to extend into the 1730 demand zone below if selling accelerates. No entry until the low breaks โ that confirmation is the whole setup.
If this added value, boost it forward. What are your thoughts?
Swallow Academy
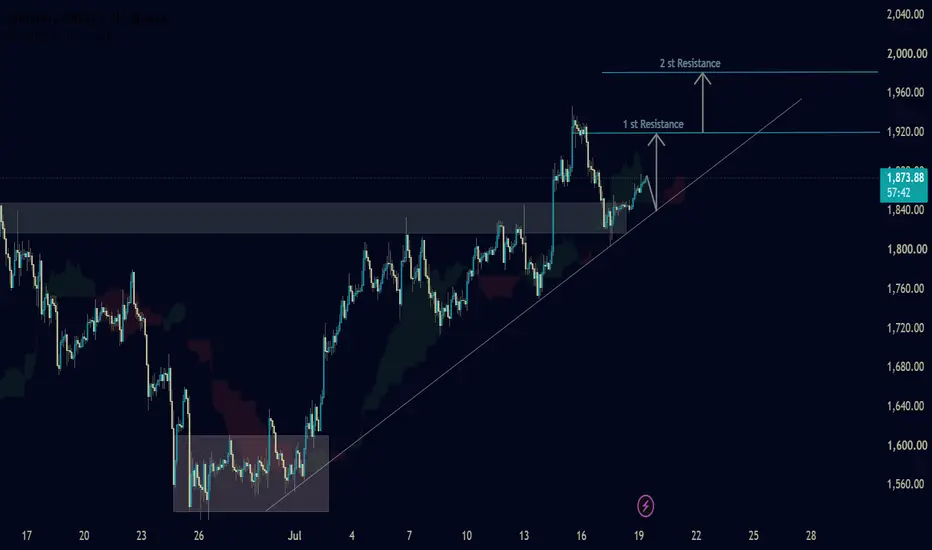
ETHUSDT โ H2 โ Ascending Trendline Continuation SetupETHUSDT โ H2 โ Ascending Trendline Continuation Setup
Ethereum is maintaining a constructive bullish structure after rebounding from a strong demand zone and establishing a series of higher highs and higher lows. Price has successfully reclaimed key support and is now holding above a rising trendline, indicating that buyers remain in control of the short-term trend.
The recent pullback appears to be a healthy retest of the ascending trendline rather than a trend reversal. As long as ETH continues to respect this dynamic support, bullish momentum may strengthen toward the next resistance levels. A confirmed move above the first resistance could trigger an extended rally toward the higher target zone.
If the Bullish Structure Holds
๐ข 1st Resistance: 1,920.00
๐ข 2nd Resistance: 1,980.00
๐ด Support Zone: 1,820.00 โ 1,840.00
โ ๏ธ Disclaimer: This analysis is for educational purposes only. Always wait for confirmation before entering a trade and apply proper risk management to protect your capital.
ETHUSDT: Watching 1885โ1890 for a Potential Short SetupEthereum has rallied back into a key resistance area after losing its short-term bullish structure. I'm watching the 1885โ1890 zone for a potential short opportunity if sellers continue to defend this level.
Trade Plan:
Entry (Short): 1885โ1890
Stop Loss: 1901
TP1: 1861
TP2: 1842
TP3: 1803
A move above 1901 would invalidate this bearish setup. As always, I'll wait for confirmation before entering and manage risk accordingly.
This is my personal market analysis, not financial advice.
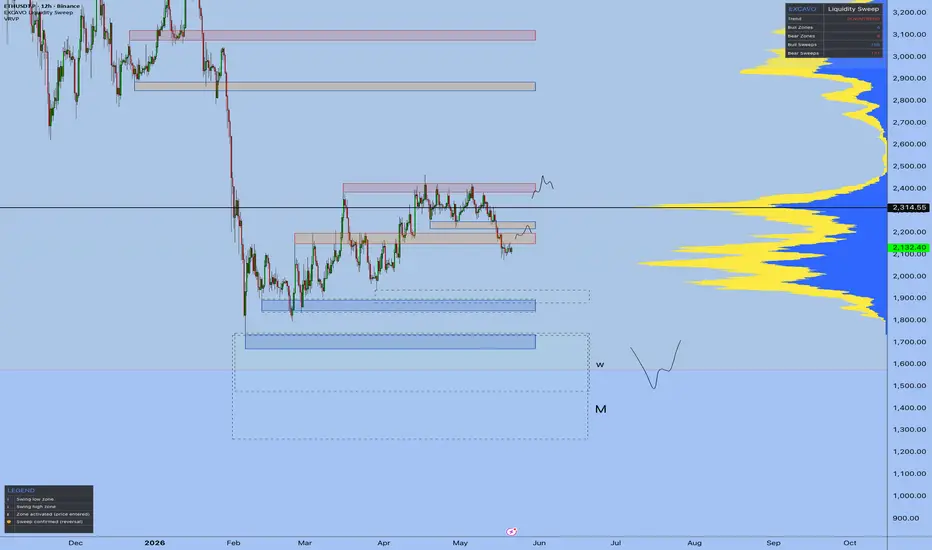
The trading tournaments ERAIn the last post I said the shift I'm betting on for the next two years isn't an asset class. Here it is.
It's the format. Specifically, competitive trading.
Let me back into it from where the industry actually is right now.
Every venue out there - centralized, decentralized, big or boutique - is fighting for the same finite resource: serious traders. Not tourists. Not airdrop hunters. People who put real size on, stay engaged, and generate the volume that pays for the books. The acquisition cost for that kind of user has gone vertical. Referral programs aren't enough anymore. Fee discounts aren't enough. The platforms know this. They're searching for a format that solves three things at once: bring traders in, prove who's actually good, build a community around the proof.
That format already exists. It's just been underused. Trading tournaments. Real prize pools. Public leaderboards. Finite windows. Provable performance.
Two reasons this matters to you, not just to platforms.
1. Tournaments produce what no certificate can - verifiable edge.
You can read books, take courses, post on TradingView for ten years. None of it confirms whether your system actually holds up under real pressure against real operators on a clock. A tournament does. Prize fund on the table, leaderboard public, time-boxed. You find out what your system does, or you find out it doesn't do what you thought.
For traders who came to this industry only to make money - fine, ignore this. For traders who came to become something - to confirm an edge, to compete at a level, to be measurable - competitive trading is the most direct route I see right now.
2. Tournaments are where community actually compounds.
Solo is brutal. Every honest trader knows this. The best ideas, the early-warning signals, the counter-arguments that save you from your own bias โ they come from other people. But "community" as a chat-room concept is broken. Most groups are P&L-dumping grounds. Real community forms around shared stakes.
You enter as an individual or a team, you compete, you debrief, you learn faster in three weeks than three months alone. You didn't sign up for a community. The format built one anyway.
I'm not theorizing. I ran one in March.
49 verified traders signed up to compete on the same clock. Best result: +157% ROI in 30 days. About a third never placed a single trade. That gap - between people who say they'll show up and people who actually trade under public stakes - is the most honest filter in this industry.
The leaderboard was the visible result. The thing I didn't expect was everything around it.
As for me, I share all my work, indicators and trades with my people, which is really necessary.
Over the past 9 months, I've done a lot to provide tools that work.
Traders who'd never spoken started comparing entries in real time. Debriefing each other's setups. Calling out each other's blind spots. Sharing what worked the first week and what blew up the second. By the end, the community around the leaderboard was as valuable as the leaderboard itself - because that's where everyone figured out, together, what actually works and what doesn't. Not in theory. In live conditions, on the same clock, against the same market.
The next layer is already forming on the same logic: bots against bots, with the builders behind them publicly accountable for results. Whether the operator is human, machine or hybrid, the format becomes the proving ground.
What to do, concretely, this quarter.
1. Enter one tournament you're scared to enter. Pick a venue you respect, a format that's a stretch but not impossible, a window you can fully commit to. The point isn't winning. The point is finding out where your system breaks under real conditions and a public clock.
2. Find or build a team before the next major bracket. You don't have to compete solo. The traders who compound fastest from here will operate in small high-trust teams โ three to five people, complementary edges, ruthless debriefs. If you don't have that already, this is the year to build it.
3. Start thinking about your bot - even if you'd never call yourself a quant. The next layer of competition is partly automated. Operators who learn to instrument their own decisions in code will pull away from those who don't. Start with one rule from your discretionary system. Codify it. Backtest it. Track it live. Just one. Build from there.
If you've competed - in any format, any venue - tell me in the comments what the format got right and what it got wrong. I'm building the next one and I'm reading every answer in the first 24 hours.
Best regards EXCAVO
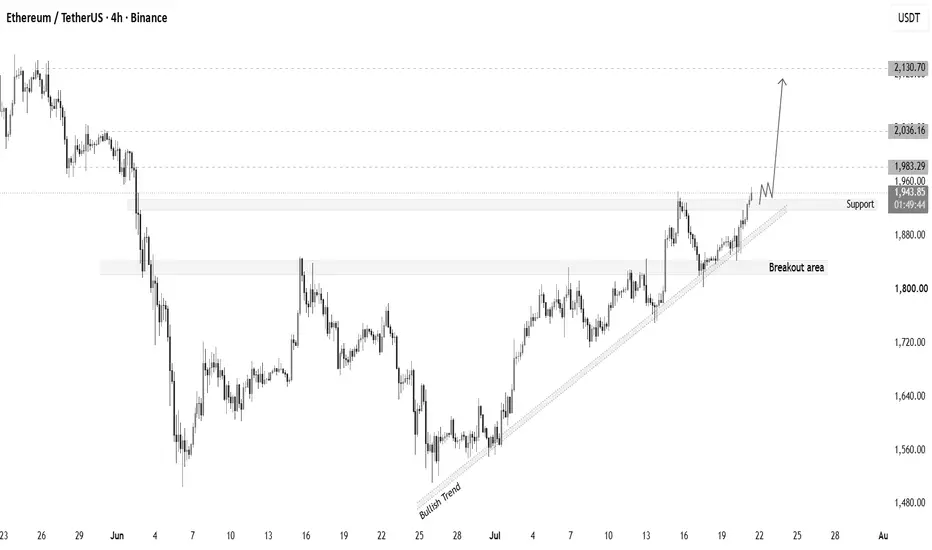
Ethereum is showing a strong bullish structureETH/USD โ 4H Time Frame
๐ข Bullish Breakout Setup
Ethereum is showing a strong bullish structure and is approaching a key resistance breakout at 1,835. A confirmed breakout and sustained move above 1,943 would strengthen the bullish trend and signal potential continuation to higher levels.
๐ Key Breakout Levels:
โ
Resistance: 1,835
โ
Buy Confirmation: 1,943
๐ฏ Technical Targets:
โ
Target 1: 1,983
โ
Target 2: 2,036
โ
Target 3: 2,130
Market View:
ETH is building bullish momentum on the 4-hour chart. A clean breakout above the resistance zone followed by strength above 1,943 could attract additional buying pressure and drive price toward the listed targets.
๐ Bias: STRONG BUY
โ ๏ธ This analysis is based on technical price action and market structure. Always wait for breakout confirmation and use proper risk management before entering any trade.
ETHUSDT: New Bullish Wave!Ethereum has just broken out of a prolonged consolidation zone, extending its upward momentum toward the 1,980 USDT level. This breakout, accompanied by increased trading volume, indicates that buyers are becoming more active.
Following this rapid rise, the price may need to retest the breakout zone before continuing its advance.
On the 2-hour (H2) chart, ETHUSDT maintains a structure of higher highs and higher lows. The price is trading above both the EMA34 and EMA89, while both moving averages continue to slope upward. The 1,900โ1,920 USDT area currently serves as a key confluence zone, aligning the former resistance level, the EMA cluster, and the short-term bullish structure.
The preferred scenario is to wait for a pullback to the 1,900โ1,920 USDT range and observe a clear buying response. If this zone holds and the price reclaims the 1,960โ1,980 USDT level, bullish momentum could extend toward 2,020 USDT, followed by a higher target around 2,060 USDT.
Next expected moves of Ethereum Ethereum is testing a key resistance zone near $1,940 after completing a complex corrective structure. Price may first push toward point G before a possible rejection toward the highlighted support area around $1,900โ$1,910. Watch the marked trendline and support zone for confirmation.
ETHUSDT: CVD Bull Div Method B, Projected Path to POCGate one, BOS confirmed bullish structure had already shifted near 1,880 before the pullback into the OTE zone.
Gate two, price swept the TCW OTE ETH LONG zone, tagging just above 1,800 with CVD Bull Div confirming at the same level marked here: price pressing toward a lower low while cumulative volume delta held a higher low, order flow disagreeing with the wick the same way it has on every prior instance of this exact setup type.
Gate three, CHoCH confirmed once price reclaimed back through the 0.295 to 0.382 band, the control bar turning the sweep and divergence into a live trigger.
Method B Entry landed at the CVD Bull Div itself, the same earlier-entry technique used on every version of this setup, order flow confirming before the full structural reclaim completes.
Since that entry, price ran through 1,940, rolled over into the current OB near 1,840 to 1,870, and the projected path calls for this OB to hold as the retest zone before the move extends toward TP1, positioned directly under POC at 2,064.67. Worth being direct about where this stands: the projection is drawn, the OB is marked, but the retest hasn't been proven yet. This is a live setup, not a completed one.
This is the same POC that BTC already tested and pulled back from on the daily. Whether ETH reaches it on this leg is an open question this chart hasn't answered.
What invalidates this: a close back below the OB's lower edge near 1,840, breaking the zone this projection depends on holding. What confirms it: the retest holding and price resuming toward TP1.
Marcus Aurelius wrote that the impediment to action advances action. The OB is the current impediment. Whether it holds is what turns the projection into the next confirmed leg.
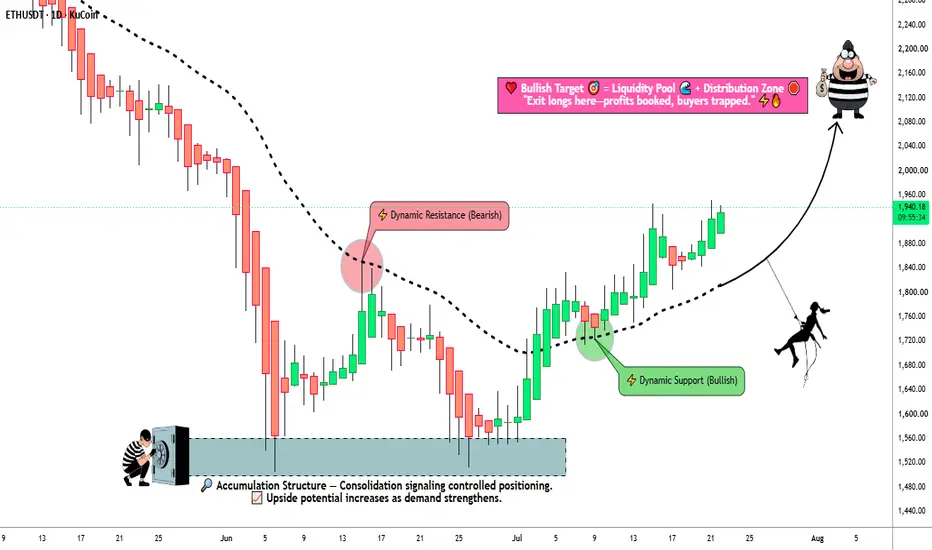
Ethereum Liquidity Map | Bulls Still In Control๐๐น ETH/USDT โ "ETHEREUM vs TETHER" | The Vault Blueprint ๐ (Day/Swing Setup) ๐น๐
Dear Ladies & Gentlemen โ Thief OG's ๐
The crew is back with another heist plan. This time we're cracking the Ethereum vault โ and the blueprint says one thing: smooth pullback, clean structure, bullish intent. Let's move in. ๐ต๏ธโโ๏ธ๐ฐ
๐ LIVE MARKET SNAPSHOT
๐ Asset: ETH/USDT (Ethereum vs Tether)
๐ 24H Bias: Mildly bullish, holding above the $1,800โ$1,806 shelf
๐ RSI (Daily): ~63 โ strengthening momentum, not yet overbought
๐๏ธ THE PLAN
Bullish continuation plan, confirmed off a smooth moving average pullback โ the kind of clean retest that gives the crew confidence to move in rather than chase.
๐ช Vault Zone (Entry): Any price level you're comfortable buying into on this pullback structure โ flexible entry, not a single fixed tick.
๐ Getaway Point (Final Target): @ 2100
๐ This zone is a police barricade โ heavy resistance, overbought risk, classic trap-and-reversal territory. If you're in profit near here, escape clean. Don't get greedy and get cuffed.
๐จ Getaway Point 1 (Scalpers/Day Traders): @ 2050
Quick in-and-out crew, this is your exit ramp.
โ ๏ธ Dear Ladies & Gentlemen (Thief OG's) โ I'm not recommending you set only my TP. It's your own call. You make the money, then you take the money, at your own risk.
๐จ Thief SL (Stop Loss): @ 1800
โ ๏ธ Dear Ladies & Gentlemen (Thief OG's) โ I'm not recommending you set only my SL either. Your risk, your rules. Protect your own vault.
๐ RELATED PAIRS TO WATCH (Correlation Desk)
BINANCE:BTCUSDT โ $66,300 โ ETH's big brother. BTC leads risk sentiment across the whole crypto market; if BTC stalls at resistance, ETH's rally attempts usually stall too. Watch BTC first, trade ETH second.
BINANCE:XRPUSDT โ $1.13 โ Altcoin risk-appetite gauge. When XRP and ETH move together, it signals broad alt-market strength rather than an ETH-only move โ more conviction for the vault plan.
BINANCE:SOLUSDT โ $78 โ Another high-beta alt. Tends to amplify ETH's moves; if SOL is outperforming ETH right now, it's a tell that risk appetite is broad-based, not ETH-specific.
TVC:DXY (US Dollar Index): Inverse relationship with crypto majors. A softening dollar historically supports ETH's push toward the $1,900โ$2,100 zone; dollar strength caps it.
๐ FUNDAMENTAL & MACRO FACTORS โ What the Market Is Actually Showing
(Neutral read โ this is what's out there, not shaped to fit the trade direction)
ETF Flow Activity: Recent sessions showed a mix โ a notable spot ETF inflow day (~$105M) alongside a same-window net outflow (~$6.3M) on major crypto trackers. Read: institutional interest is present but not one-directional yet.
Derivatives Positioning: Long/short account ratios on major exchanges currently lean long (above 1.4โ1.8x), meaning more retail traders are positioned bullish even after recent pullbacks โ a crowded long can also fuel sharp wick-outs near resistance.
Network Roadmap: Ethereum co-founder Vitalik Buterin published a "Lean Ethereum" roadmap targeting quantum-safety, privacy, and scalability upgrades through 2029 โ a longer-term structural narrative, not a short-term price driver.
Exchange Product Expansion: A major exchange launched USD-settled ETH options, expanding institutional derivatives access โ adds liquidity depth to the ETH ecosystem.
Macro Calendar โ High Impact Ahead:
๐
FOMC Interest Rate Decision โ Wednesday, 29 July, 7:00 PM London Time. Current Fed funds target range: 3.50%โ3.75%, held steady since December. No new Summary of Economic Projections this meeting, but the statement/press conference language on the pace of future cuts is the real market mover โ risk assets including ETH tend to see volatility spikes around this release.
๐ฆน THIEF TRADER WISDOM
"A real thief doesn't chase the vault โ the vault opens when the plan is right." ๐
"Patience is the best crew member you'll ever have." โณ๐
"Enter like a professional, exit like a legend." ๐โโ๏ธ๐ฐ
Stay sharp, stay disciplined, and protect your capital like it's the last bag in the vault. Wishing the whole crew a profitable, clean run. ๐๐
โ ๏ธ Risk Disclaimer: This is not financial advice. All levels (entry, TP, SL) are reference points for educational/analytical purposes only. Trading crypto carries high risk โ always do your own research and manage your own risk.
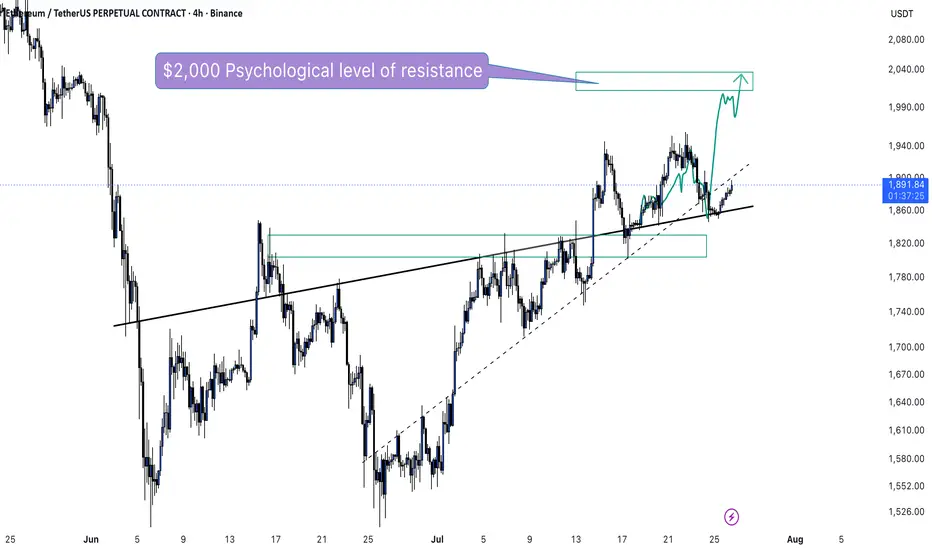
ETHUSDT: ascending triangle long into the $2K short wallETHUSDT โ Long swing setup (1D)
THE SETUP
ETH has built a clean staircase of higher lows through July (~1,450 to 1,600 to 1,700 to 1,800 to now ~1,870) while capped by the $2,000 round number โ an ascending triangle. Rising demand into fixed resistance is a bullish continuation structure, and $2,000 is stacked with shorts (reports cite ~$975M above $1,952). A reclaim would force covering โ squeeze fuel.
CONFLUENCES
- Daily uptrend intact: higher lows, structure unbroken above $1,800
- Entry at rising support / prior structure, $1,845โ$1,880
- Ascending triangle: flat $2,000 resistance + rising lows
- Funding positive but not overheated โ room to run
- Whale accumulation (10k ETH off Binance; a16z 25k+ ETH) into a heavy short cluster
- Clean invalidation below $1,800, RR ~1.8:1 to TP1
FUNDAMENTALS
Whales and long-term holders accumulated on exchange outflows through late July while ~$1โ2B of shorts sit at/above $2,000. Glamsterdam upgrade targeted H2 2026. Note: spot ETH ETFs saw net outflows recently โ a mixed signal, which is why the $1,800 invalidation is firm.
TRADE PLAN
Entry zone: 1,845 โ 1,880
Stop loss: 1,795 (below the $1,800 July higher-low structure)
TP1: 1,985 (+6.6% | ~1.8R)
TP2: 2,100 (+12.8% | ~3.5R)
TP3: 2,250 (+20.8% | ~5.8R)
Invalidation: a daily close below $1,800 kills the idea.
Follow for the daily levels โ updates posted on this idea as it plays out.
Not financial advice. Trade your own plan and manage risk.
ETH Analyses-11, [July 21, 2026]Welcome to my page! I share daily technical analyses of Ethereum and other charts here.
BINANCE:ETHUSDT
๐ก Market Analysis:
The price is currently compressing within a wedge pattern and testing the upper trendline resistance. We anticipate a rejection toward the key support at 1,670.00 before a strong breakout with an 80% candle body triggers a new bullish trend.
Key Support & Resistance:
Key Resistance: 2,000.00 - 2,250.00
Key Support Area: 1,670.00 - 1,850.00
๐ฏ Trade Entry & Exit Plan:
Entry : Breakout/Pullback of trendline or key zones with >80% candle body and two waves outside the range.
Stop Loss : Behind the last wave or the last breakout candle with a large body.
Take Profit : Minimum R:R 2, with further targets at major horizontal levels (2,000.00 and 2,250.00).
โ ๏ธ Risk Management:
Maximum 1% risk per trade.
โค๏ธ Please share your thoughts and comments on this analysis!
ETH LONG vs SHORT #ETH #Crypto
The asset continues to trade within a medium-term ascending channel.
The key resistance remains the $1,950 area, where the main concentration of sellers is currently located. Despite this, buyers continue to hold their ground, so the overall outlook remains bullish.
The dominance of short-term SHORT positions could become an additional catalyst for further upside. I also wouldn't rule out a retest of the $1,905 level. If that happens, this will be a key area to watch for buyer activity.
LONG vs SHORT
I also want to discuss the new CLARITY Act. I'm currently preparing a detailed review.
Its adoption is widely viewed as a potentially bullish development for the crypto market, as it aims to provide greater regulatory clarity for digital assets in the United States. However, it's not that straightforwardโthere are a number of important nuances and potential pitfalls that could have a significant impact on the market.
A full breakdown is coming soon.
ETHUSDT โ SHORT TRADE SETUP | 1D | THE CHART ALCHEMIST | 24 JULY๐ ETHUSDT โ SHORT TRADE SETUP | 1D | THE CHART ALCHEMIST | 24 JULY 2026
๐น Entry Zone: 1,850 โ 1,935
๐ฏ Take Profit Targets:
TP1: 1,738.5
TP2: 1,630
TP3: 1,518
TP4: 1,310
TP5: 1,081
TP6: 865
TP7: 653
TP8: 478
๐ SL (1D Closing): Above 2,072
โ ๏ธ This trade setup is shared for educational purposes only and does not constitute financial advice. No claim, no blame.
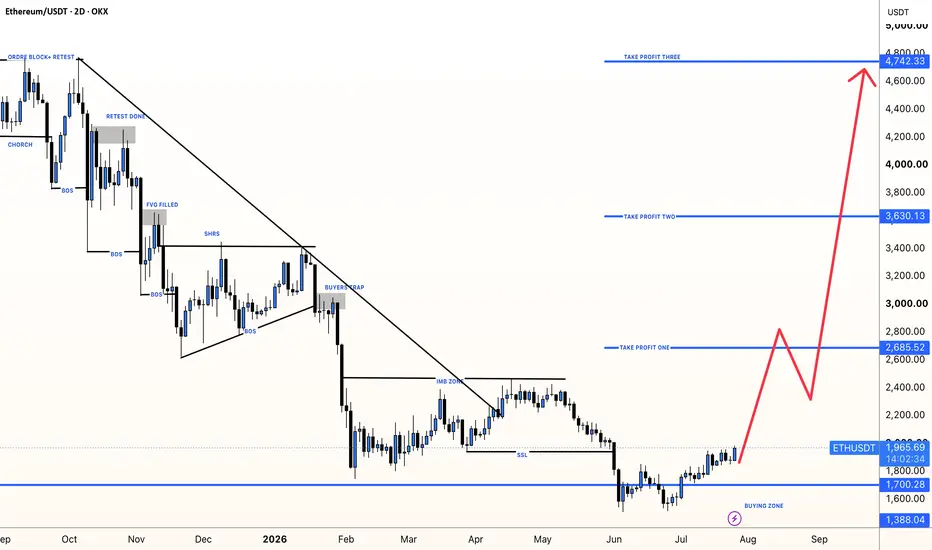
ETHUSDT: Beginning Of One Of The Biggest Move! $5000! ๐บETHUSD recently hit a record low, causing significant concern among ETH investors. The price has rejected nicely and most sell-side liquidity has been removed, suggesting a potential move towards $5000.
๐บThis is a swing move and may take time to reach the target, but we have three potential targets with this trading setup, each with an equal chance of being hit. As the trading cycle progresses, we could see a bullish impulse.
๐บRemember, trading requires patience, so wait for the perfect opportunity to enter long with this analysis. As always, do your own research before investing in the volatile crypto market, which carries significant risk and could potentially liquidate your entire trading account. If you agree with our work, please like and comment on our ideas. Also, follow us for more trading setups.
Good luck and trade safely!โค๏ธ
Team Setupsfx_
Why is the $2,000 Level a Confluence Point for ETH?Ethereum has dropped 62% from its peak, but my eyes are on a single level. Want to know why?
So if three separate indicators are all pointing to the same price, what could the market be telling us?
On the chart, three independent tools meet at the same point.
The resistance of the downtrend that has continued since August 2025 sits at 2,000 today. The most traded price of the past year, meaning the POC (FRVP), is again at 2,000. The Equilibrium that shows the balance between buyers and sellers is at the exact same spot. We call it confluence when three separate data points meet at a single price.
This is what makes 2,000 dollars the most critical level on this chart.
Current Situation
We are at 1,876 dollars right now.
As long as price stays below the 2,000 dollars where the confluence meets, sellers appear to be in control. Every move up can be read for now as an attempt to return to the POC. Until 2,000 is broken with a weekly close above it, it is too early to talk about a trend reversal.
Even if 2,000 is cleared, ETH's road is tough. Just above it, 2,147 (SMA200) and 2,300 (realized price) resistances are waiting. For the trend to turn, these levels must be cleared one by one and confirmed.
Conclusion
ETH appears stuck between 1,500 and 2,000.
If 2,000 is cleared, the first hope for a reversal may emerge. If it cannot be cleared, 1,743 (SMA50) may come back onto the agenda. In short, 2,000 could be the line of destiny for this market.
Do you think ETH can make a weekly close above 2,000 dollars in the period ahead?
ETH/USDT: THE 1,975 WEDGE LAUNCHPAD! ๐
Slamming down toward the 1,780 support floor. Are you panic-selling this temporary dip, or lining up your bags for the ultimate trendline squeeze? ๐ค
The broader crypto market is experiencing a quick flush, but Ethereum is quietly preparing an explosive structural counter-attack! On this 1-hour Binance chart, ETH is coiling beautifully inside a massive ascending Wedge pattern. ๐๐ฅ
The recent drop from the 1,940 local high has successfully washed out over-leveraged longs. The price is now sliding directly into the primary macro Support line around the 1,780 region, where major institutional buy-limit blocks are waiting to trap greedy short-sellers. ๐ชค
The purple trajectory maps out an immaculate bullish continuation sequence. The algorithm is poised to test the key Support line, absorb the remaining retail panic, and then launch a powerful, multi-wave rally straight toward the top of the wedge near 1,975. ๐
Patience remains your ultimate superpower in this setup. Instead of chasing the market when it is already green, professional traders wait for the price to hit high-confluence support zones before scaling in. Let the weak hands sell the bottom! ๐งโโ๏ธโก
Trade Parameters:
๐ Long Zone: 1,780 - 1,810 ๐๏ธ
๐ Stop-Loss: Hourly close below 1,750 โ
๐ฐ Take-Profit: 1,975 ๐ฏ
The bears are getting excited over this short-term drop, but they are walking straight into a giant trendline trap. Stay highly disciplined, block out the noise, and let the algorithm do the heavy lifting for you. See you at the 1,975 target! ๐๐